Kafka
Collect and ship Kafka application logs to Logstash and Elasticsearch
Follow the steps below to send your observability data to Logit.io
Logs
Filebeat is a lightweight shipper that enables you to send your Apache Kafka application logs to Logstash and Elasticsearch. Configure Filebeat using the pre-defined examples below to start sending and analysing your Apache Kafka application logs.
Install Integration
Install Filebeat
To get started you will need to install filebeat. To do this you have two main options:
- Choose the filebeat (opens in a new tab) ZIP file (Windows ZIP x86_64) or
- Choose the Microsoft Software Installer MSI (opens in a new tab) file (Windows MSI x86_64 (beta))
To successfully install filebeat and set up the required Windows service you will need to have administrator access.
If you have chosen to download the zip file:
- Extract the contents of the zip file into C:\Program Files.
- Rename the extracted folder to filebeat
- Open a PowerShell prompt as an Administrator (right-click the PowerShell icon and select Run As Administrator).
- From the PowerShell prompt, run the following commands to install filebeat as a Windows service:
cd 'C:\Program Files\filebeat'.\install-service-filebeat.ps1If script execution is disabled on your system, you need to set the execution policy for the current session to allow the script to run. For example:
PowerShell.exe -ExecutionPolicy UnRestricted -File .\install-service-filebeat.ps1For more information about Powershell execution policies see here (opens in a new tab).
If you have chosen to download the filebeat.msi file:
- double-click on it and the relevant files will be downloaded.
At the end of the installation process you'll be given the option to open the folder where filebeat has been installed.
- Open a PowerShell prompt as an Administrator (right-click the PowerShell icon and select Run As Administrator).
- From the PowerShell prompt, change directory to the location where filebeat was installed and run the following command to install filebeat as a Windows service:
.\install-service-filebeat.ps1If script execution is disabled on your system, you need to set the execution policy for the current session to allow the script to run. For example:
PowerShell.exe -ExecutionPolicy UnRestricted -File .\install-service-filebeat.ps1For more information about Powershell execution policies see here (opens in a new tab).
The default configuration file is located at:
C:\Program Files\filebeat\filebeat.yml
Enable the Kafka module
There are several built in filebeat modules you can use. You will need to enable the kafka module:
.\filebeat.exe modules list
.\filebeat.exe modules enable kafka
In the module config under modules.d, change the module settings to match your environment. You must enable at least one fileset in the module.
Filesets are disabled by default.
Copy the snippet below and replace the contents of the kafka.yml module file:
# Module: kafka
# Docs: https://www.elastic.co/guide/en/beats/filebeat/8.12/filebeat-module-kafka.html

- module: kafka
  # All logs
  log:
    enabled: true

  # Set custom paths for Kafka. If left empty,
  # Filebeat will look under /opt.
  #var.kafka_home:

  # Set custom paths for the log files. If left empty,
  # Filebeat will choose the paths depending on your OS.
  #var.paths:
Update Your Configuration File
The configuration file below is pre-configured to send data to your Logit.io Stack via Logstash.
Copy the configuration file below and overwrite the contents of filebeat.yml.
# ============================== Filebeat modules ==============================
filebeat.config.modules:
  path: ${path.config}/modules.d/*.yml
  reload.enabled: false
  #reload.period: 10s

# ================================== Outputs ===================================
# ------------------------------ Logstash Output -------------------------------
output.logstash:
  hosts: ["@logstash.host:@logstash.sslPort"]
  loadbalance: true
  ssl.enabled: true

# ================================= Processors =================================
processors:
  - add_host_metadata:
      when.not.contains.tags: forwarded
  - add_cloud_metadata: ~
  - add_docker_metadata: ~
  - add_kubernetes_metadata: ~
If you're running Filebeat 7 add this code block to the end. Otherwise, you can leave it out.
# ... For Filebeat 7 only ...
filebeat.registry.path: /var/lib/filebeat
If you're running Filebeat 6 add this code block to the end. Otherwise, you can leave it out.
# ... For Filebeat 6 only ...
registry_file: /var/lib/filebeat/registry
Validate your YAML
It's a good idea to run the configuration file through a YAML validator to rule out indentation errors, clean up extra characters, and check if your YAML file is valid. Yamllint.com (opens in a new tab) is a great choice.
Validate Configuration
.\@beatname.exe test config -c @beatname.ymlIf the yml file is invalid, @beatname will print a description of the error. For example, if the
output.logstash section was missing, @beatname would print no outputs are defined, please define one under the output section
Start filebeat
To start Filebeat, run in Powershell:
Start-Service filebeatLaunch OpenSearch Dashboards to View Your Data
Launch OpenSearch DashboardsHow to diagnose no data in Stack
If you don't see data appearing in your stack after following this integration, take a look at the troubleshooting guide for steps to diagnose and resolve the problem or contact our support team and we'll be happy to assist.
Kafka Dashboard
The Kafka module comes with predefined Kibana dashboards. To view your dashboards for any of your Logit.io stacks, launch Logs and choose Dashboards.
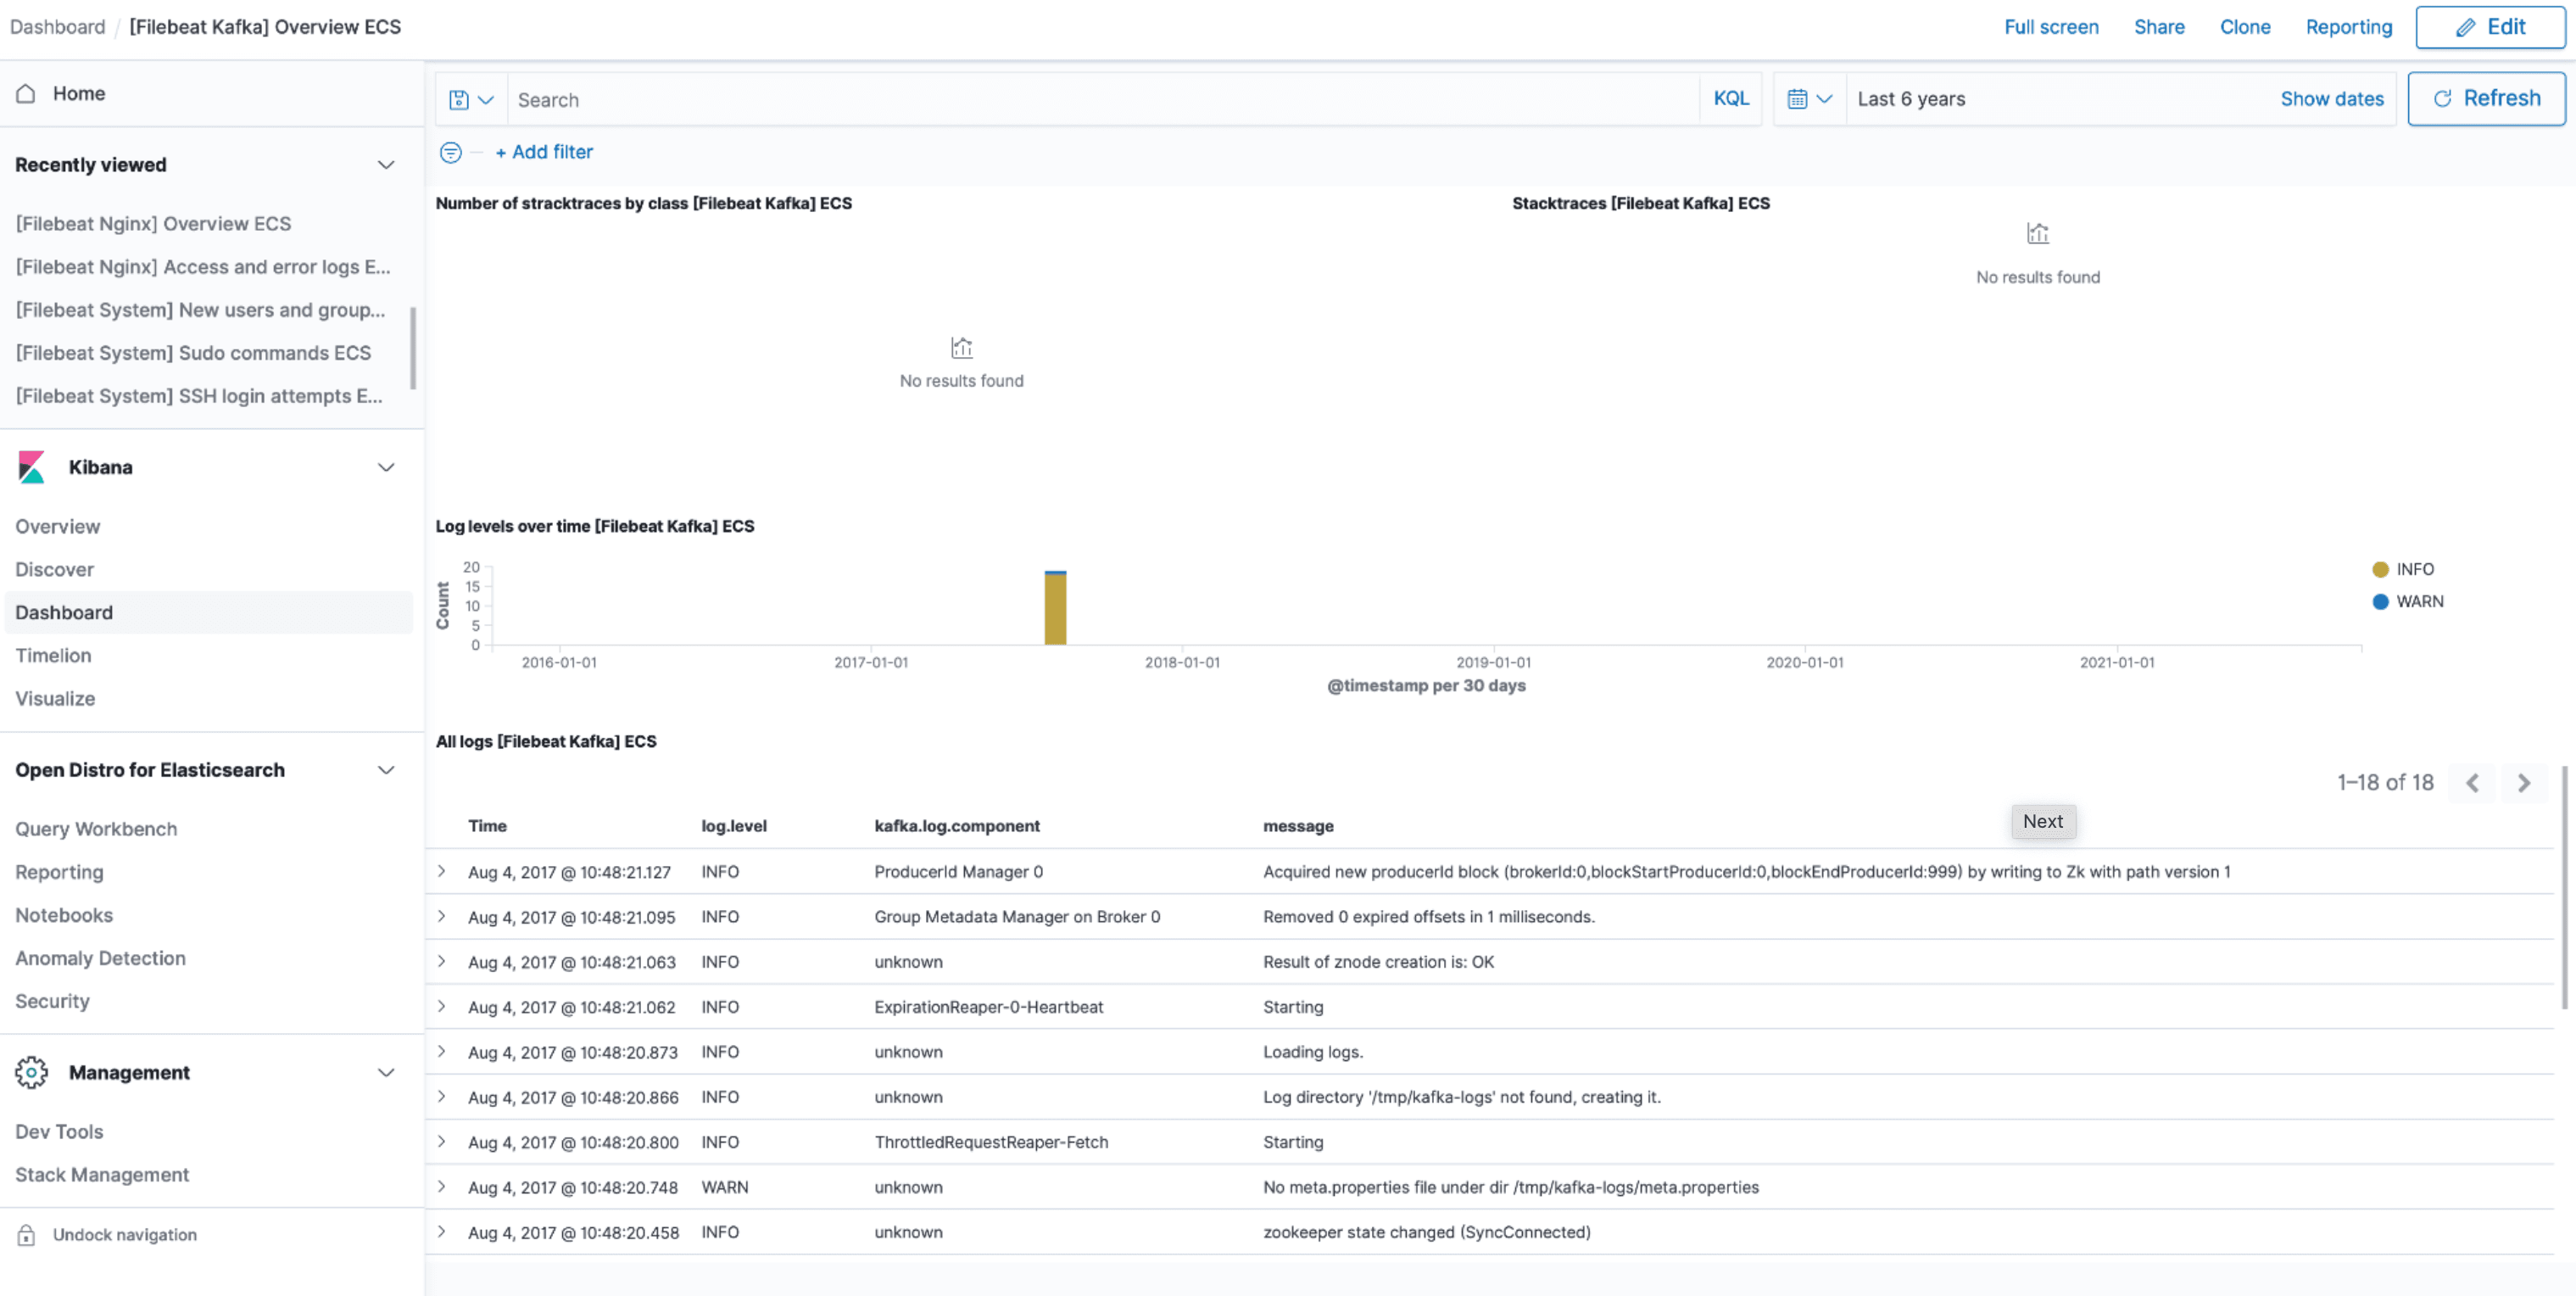
Apache Kafka Logging Overview
Apache Kafka is a distributed streaming platform written in Scala & Java, that is primarily used for generating low latency real-time data streaming pipelines for apps & data lake engines.
Kafka offers users the ability to publish & subscribe to record streams, decouple data & sort the aggregated data in chronological order for improved real-time processing. The platform is suited to processing many trillions of cross systems events per day making the tool ideal as a big data solution.
Kafka is one of the leading Apache projects and is used by enterprise level businesses globally; including Uber, LinkedIn, Netflix & Twitter. Much of this infrastructure also uses Logstash, which works side by side with the platform as Kafka acts as a buffer between the two for improved resilience.
The combined power of Elasticsearch, Logstash & Kibana form the Elastic Stack which can be used for efficient log analysis (opens in a new tab) as platform & Kafka broker logs contain vital information on the performance & overall health of your systems.
Our hosted Elastic Stack (opens in a new tab) solution can help monitor & visualise Kafka logs and alert you on performance issues & broker degradation in real time. Logit.io's built in Kibana can easily generate dashboards for capturing various Kafka log messages along with their severity counts.
If you need any assistance with analysing your Kafka logs (no matter if their server, utils or state-change logs) we're here to help. Feel free to get in touch by contacting the Logit.io help team via chat & we'll be happy to help you start analysing your log data.