Redis
Ship Redis Application logs to Logstash
Follow the steps below to send your observability data to Logit.io
Logs
Find the process of sending Redis application logs to your Logstash instance easier through using our provided configuration examples.
Install Integration
Install Filebeat
To get started you will need to install filebeat. To do this you have two main options:
- Choose the filebeat (opens in a new tab) ZIP file (Windows ZIP x86_64) or
- Choose the Microsoft Software Installer MSI (opens in a new tab) file (Windows MSI x86_64 (beta))
To successfully install filebeat and set up the required Windows service you will need to have administrator access.
If you have chosen to download the zip file:
- Extract the contents of the zip file into C:\Program Files.
- Rename the extracted folder to filebeat
- Open a PowerShell prompt as an Administrator (right-click the PowerShell icon and select Run As Administrator).
- From the PowerShell prompt, run the following commands to install filebeat as a Windows service:
cd 'C:\Program Files\filebeat'.\install-service-filebeat.ps1If script execution is disabled on your system, you need to set the execution policy for the current session to allow the script to run. For example:
PowerShell.exe -ExecutionPolicy UnRestricted -File .\install-service-filebeat.ps1For more information about Powershell execution policies see here (opens in a new tab).
If you have chosen to download the filebeat.msi file:
- double-click on it and the relevant files will be downloaded.
At the end of the installation process you'll be given the option to open the folder where filebeat has been installed.
- Open a PowerShell prompt as an Administrator (right-click the PowerShell icon and select Run As Administrator).
- From the PowerShell prompt, change directory to the location where filebeat was installed and run the following command to install filebeat as a Windows service:
.\install-service-filebeat.ps1If script execution is disabled on your system, you need to set the execution policy for the current session to allow the script to run. For example:
PowerShell.exe -ExecutionPolicy UnRestricted -File .\install-service-filebeat.ps1For more information about Powershell execution policies see here (opens in a new tab).
The default configuration file is located at:
C:\Program Files\filebeat\filebeat.yml
Enable the Redis Module
There are several built in filebeat modules you can use. You will need to enable the redis module:
.\filebeat.exe modules list
.\filebeat.exe modules enable redis
In the module config under modules.d, change the module settings to match your environment. You must enable at least one fileset in the module.
Filesets are disabled by default.
Copy the snippet below and replace the contents of the redis.yml module file:
# Module: redis
# Docs: https://www.elastic.co/guide/en/beats/filebeat/8.12/filebeat-module-redis.html

- module: redis
  # Main logs
  log:
    enabled: true

    # Set custom paths for the log files. If left empty,
    # Filebeat will choose the paths depending on your OS.
    #var.paths: ["/var/log/redis/redis-server.log*"]

  # Slow logs, retrieved via the Redis API (SLOWLOG)
  slowlog:
    enabled: true

  # The Redis hosts to connect to.
  #var.hosts: ["localhost:6379"]

  # Optional, the password to use when connecting to Redis.
  #var.password:
Update Your Configuration File
The configuration file below is pre-configured to send data to your Logit.io Stack via Logstash.
Copy the configuration file below and overwrite the contents of filebeat.yml.
# ============================== Filebeat modules ==============================
filebeat.config.modules:
  path: ${path.config}/modules.d/*.yml
  reload.enabled: false
  #reload.period: 10s

# ================================== Outputs ===================================
# ------------------------------ Logstash Output -------------------------------
output.logstash:
  hosts: ["@logstash.host:@logstash.sslPort"]
  loadbalance: true
  ssl.enabled: true

# ================================= Processors =================================
processors:
  - add_host_metadata:
      when.not.contains.tags: forwarded
  - add_cloud_metadata: ~
  - add_docker_metadata: ~
  - add_kubernetes_metadata: ~
If you're running Filebeat 7 add this code block to the end. Otherwise, you can leave it out.
# ... For Filebeat 7 only ...
filebeat.registry.path: /var/lib/filebeat
If you're running Filebeat 6 add this code block to the end. Otherwise, you can leave it out.
# ... For Filebeat 6 only ...
registry_file: /var/lib/filebeat/registry
Validate your YAML
It's a good idea to run the configuration file through a YAML validator to rule out indentation errors, clean up extra characters, and check if your YAML file is valid. Yamllint.com (opens in a new tab) is a great choice.
Validate configuration
.\@beatname.exe test config -c @beatname.ymlIf the yml file is invalid, @beatname will print a description of the error. For example, if the
output.logstash section was missing, @beatname would print no outputs are defined, please define one under the output section
Start filebeat
To start Filebeat, run in Powershell:
Start-Service filebeatLaunch OpenSearch Dashboards to View Your Data
Launch OpenSearch DashboardsHow to diagnose no data in Stack
If you don't see data appearing in your stack after following this integration, take a look at the troubleshooting guide for steps to diagnose and resolve the problem or contact our support team and we'll be happy to assist.
Metrics
Configure Telegraf to ship Redis metrics to your Logit.io stacks.
Install Integration
Install Telegraf
This integration allows you to configure a Telegraf agent to send your metrics to Logit.io.
Choose the installation method for your operating system:
When you paste the command below into Powershell it will download the Telegraf zip file.
Once that is complete, press Enter again and the zip file will be extracted into C:\Program Files\InfluxData\telegraf\telegraf-1.34.1.
wget https://dl.influxdata.com/telegraf/releases/telegraf-1.34.1_windows_amd64.zip -UseBasicParsing -OutFile telegraf-1.34.1_windows_amd64.zip
Expand-Archive .\telegraf-1.34.1_windows_amd64.zip -DestinationPath 'C:\Program Files\InfluxData\telegraf'
or in Powershell 7 use:
# Download the Telegraf ZIP file
Invoke-WebRequest -Uri "https://dl.influxdata.com/telegraf/releases/telegraf-1.34.1_windows_amd64.zip" `
                -OutFile "telegraf-1.34.1_windows_amd64.zip" `
                -UseBasicParsing

# Extract the contents of the ZIP file
Expand-Archive -Path ".\telegraf-1.34.1_windows_amd64.zip" `
            -DestinationPath "C:\Program Files\InfluxData\telegraf"
The default configuration file is location at:
C:\Program Files\InfluxData\telegraf\telegraf.conf
Configure the Telegraf input plugin
The configuration file below is pre-configured to scrape the system metrics from your hosts, add the following code to the configuration file telegraf.conf from the previous step.
# Read metrics from one or many redis servers
[[inputs.redis]]
  ## specify servers via a url matching:
  ##  [protocol://][username:password]@address[:port]
  ##  e.g.
  ##    tcp://localhost:6379
  ##    tcp://username:[email protected]
  ##    unix:///var/run/redis.sock
  ##
  ## If no servers are specified, then localhost is used as the host.
  ## If no port is specified, 6379 is used
  servers = ["tcp://localhost:6379"]

  ## Optional. Specify redis commands to retrieve values
  # [[inputs.redis.commands]]
  #   # The command to run where each argument is a separate element
  #   command = ["get", "sample-key"]
  #   # The field to store the result in
  #   field = "sample-key-value"
  #   # The type of the result
  #   # Can be "string", "integer", or "float"
  #   type = "string"

  ## Specify username and password for ACL auth (Redis 6.0+). You can add this
  ## to the server URI above or specify it here. The values here take
  ## precidence.
  # username = ""
  # password = ""

  ## Optional TLS Config
  # tls_ca = "/etc/telegraf/ca.pem"
  # tls_cert = "/etc/telegraf/cert.pem"
  # tls_key = "/etc/telegraf/key.pem"
  ## Use TLS but skip chain & host verification
  # insecure_skip_verify = true
Replacing the values for protocol, password, address and port as needed.
Read more about how to configure data scraping and configuration options for Redis (opens in a new tab)
Configure the output plugin
Once you have generated the configuration file, you need to set up the output plug-in to allow Telegraf to transmit your data to Logit.io in Prometheus format. This can be accomplished by incorporating the following code into your configuration file:
[[outputs.http]]
  url = "https://@metricsUsername:@metricsPassword@@metrics_id-vm.logit.io:@vmAgentPort/api/v1/write"
  data_format = "prometheusremotewrite"

  [outputs.http.headers]
    Content-Type = "application/x-protobuf"
    Content-Encoding = "snappy"
Start Telegraf
From the location where Telegraf was installed (C:\Program Files\InfluxData\telegraf\telegraf-1.34.1) run the program
providing the chosen configuration file as a parameter:
.\telegraf.exe --config telegraf.confOnce Telegraf is running you should see output similar to the following, which confirms the inputs, output and basic configuration the application has been started with:

Launch Grafana to View Your Data
Launch GrafanaHow to diagnose no data in Stack
If you don't see data appearing in your stack after following this integration, take a look at the troubleshooting guide for steps to diagnose and resolve the problem or contact our support team and we'll be happy to assist.
Redis Dashboard
The Redis module comes with predefined Kibana dashboards. To view your dashboards for any of your Logit.io stacks, launch Logs and choose Dashboards.
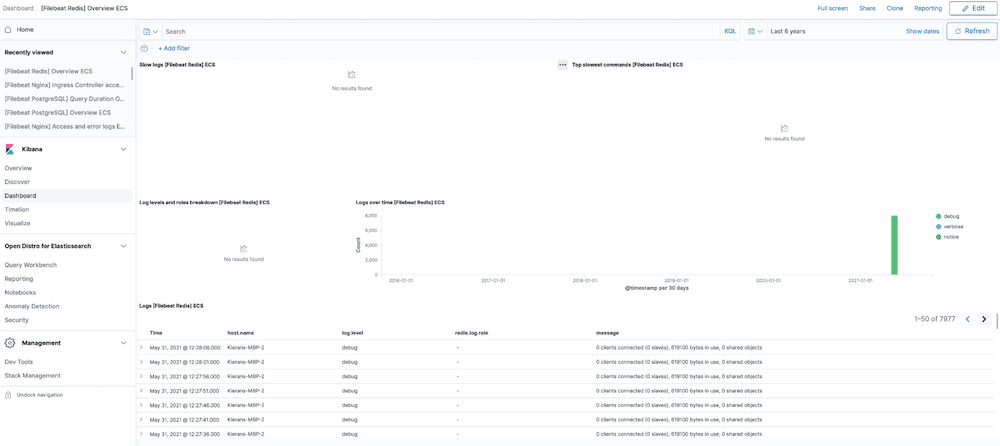
Redis Overview
Gain a comprehensive understanding of the streamlined process for transporting Redis application logs to Logstash by following the step-by-step instructions and leveraging the illustrative examples we have provided. This valuable resource will serve as your guiding light throughout the journey, guaranteeing a seamless and effective procedure for shipping data.