MySQL Logs
Ship logs from MySQL to Logstash
Follow the steps below to send your observability data to Logit.io
Logs
Configure Filebeat to ship logs from MySQL to Logstash and Elasticsearch.
Install Integration
Install Filebeat
To get started you will need to install filebeat. To do this you have two main options:
- Choose the filebeat (opens in a new tab) ZIP file (Windows ZIP x86_64) or
- Choose the Microsoft Software Installer MSI (opens in a new tab) file (Windows MSI x86_64 (beta))
To successfully install filebeat and set up the required Windows service you will need to have administrator access.
If you have chosen to download the zip file:
- Extract the contents of the zip file into C:\Program Files.
- Rename the extracted folder to filebeat
- Open a PowerShell prompt as an Administrator (right-click the PowerShell icon and select Run As Administrator).
- From the PowerShell prompt, run the following commands to install filebeat as a Windows service:
cd 'C:\Program Files\filebeat'.\install-service-filebeat.ps1If script execution is disabled on your system, you need to set the execution policy for the current session to allow the script to run. For example:
PowerShell.exe -ExecutionPolicy UnRestricted -File .\install-service-filebeat.ps1For more information about Powershell execution policies see here (opens in a new tab).
If you have chosen to download the filebeat.msi file:
- double-click on it and the relevant files will be downloaded.
At the end of the installation process you'll be given the option to open the folder where filebeat has been installed.
- Open a PowerShell prompt as an Administrator (right-click the PowerShell icon and select Run As Administrator).
- From the PowerShell prompt, change directory to the location where filebeat was installed and run the following command to install filebeat as a Windows service:
.\install-service-filebeat.ps1If script execution is disabled on your system, you need to set the execution policy for the current session to allow the script to run. For example:
PowerShell.exe -ExecutionPolicy UnRestricted -File .\install-service-filebeat.ps1For more information about Powershell execution policies see here (opens in a new tab).
The default configuration file is located at:
C:\Program Files\filebeat\filebeat.yml
Enable the MySQL module
There are several built in filebeat modules you can use. You will need to enable the mysql module:
.\filebeat.exe modules list
.\filebeat.exe modules enable mysql
The default configured paths for MySQL logs are as follows:
c:\programdata\MySQL\MySQL Server*\error.log*
c:\programdata\MySQL\MySQL Server*\mysql-slow.log*
In the module config under modules.d, change the module settings to match your environment. You must enable at least one fileset in the module.
Filesets are disabled by default.
Copy the snippet below and replace the contents of the mysql.yml module file:
# Module: mysql
# Docs: https://www.elastic.co/guide/en/beats/filebeat/8.12/filebeat-module-mysql.html

- module: mysql
  # Error logs
  error:
    enabled: true

  # Set custom paths for the log files. If left empty,
  # Filebeat will choose the paths depending on your OS.
  #var.paths:

  # Slow logs
  slowlog:
    enabled: true

  # Set custom paths for the log files. If left empty,
  # Filebeat will choose the paths depending on your OS.
  #var.paths:
Update Your Configuration File
The configuration file below is pre-configured to send data to your Logit.io Stack via Logstash.
Copy the configuration file below and overwrite the contents of filebeat.yml.
# ============================== Filebeat modules ==============================
filebeat.config.modules:
  path: ${path.config}/modules.d/*.yml
  reload.enabled: false
  #reload.period: 10s

# ================================== Outputs ===================================
# ------------------------------ Logstash Output -------------------------------
output.logstash:
  hosts: ["@logstash.host:@logstash.sslPort"]
  loadbalance: true
  ssl.enabled: true

# ================================= Processors =================================
processors:
  - add_host_metadata:
      when.not.contains.tags: forwarded
  - add_cloud_metadata: ~
  - add_docker_metadata: ~
  - add_kubernetes_metadata: ~
If you're running Filebeat 7 add this code block to the end. Otherwise, you can leave it out.
# ... For Filebeat 7 only ...
filebeat.registry.path: /var/lib/filebeat
If you're running Filebeat 6 add this code block to the end. Otherwise, you can leave it out.
# ... For Filebeat 6 only ...
registry_file: /var/lib/filebeat/registry
Validate your YAML
It's a good idea to run the configuration file through a YAML validator to rule out indentation errors, clean up extra characters, and check if your YAML file is valid. Yamllint.com (opens in a new tab) is a great choice.
Validate configuration
.\@beatname.exe test config -c @beatname.ymlIf the yml file is invalid, @beatname will print a description of the error. For example, if the
output.logstash section was missing, @beatname would print no outputs are defined, please define one under the output section
Start filebeat
To start Filebeat, run in Powershell:
Start-Service filebeatLaunch OpenSearch Dashboards to View Your Data
Launch OpenSearch DashboardsHow to diagnose no data in Stack
If you don't see data appearing in your stack after following this integration, take a look at the troubleshooting guide for steps to diagnose and resolve the problem or contact our support team and we'll be happy to assist.
Metrics
Configure Telegraf to ship MySQL Server metrics to your Logit.io stacks.
Install Integration
Install Telegraf
This integration allows you to configure a Telegraf agent to send your metrics to Logit.io.
Choose the installation method for your operating system:
When you paste the command below into Powershell it will download the Telegraf zip file.
Once that is complete, press Enter again and the zip file will be extracted into C:\Program Files\InfluxData\telegraf\telegraf-1.34.1.
wget https://dl.influxdata.com/telegraf/releases/telegraf-1.34.1_windows_amd64.zip -UseBasicParsing -OutFile telegraf-1.34.1_windows_amd64.zip
Expand-Archive .\telegraf-1.34.1_windows_amd64.zip -DestinationPath 'C:\Program Files\InfluxData\telegraf'
or in Powershell 7 use:
# Download the Telegraf ZIP file
Invoke-WebRequest -Uri "https://dl.influxdata.com/telegraf/releases/telegraf-1.34.1_windows_amd64.zip" `
                -OutFile "telegraf-1.34.1_windows_amd64.zip" `
                -UseBasicParsing

# Extract the contents of the ZIP file
Expand-Archive -Path ".\telegraf-1.34.1_windows_amd64.zip" `
            -DestinationPath "C:\Program Files\InfluxData\telegraf"
The default configuration file is location at:
C:\Program Files\InfluxData\telegraf\telegraf.conf
Configure Telegraf
The configuration file below is pre-configured to scrape the system metrics from your hosts, add the following code to the configuration file telegraf.conf from the previous step.
### Read metrics from one or many mysql servers
[[inputs.mysql]]
  ## specify servers via a url matching:
  ##  [username[:password]@][protocol[(address)]]/[?tls=[true|false|skip-verify|custom]]
  ##  see https://github.com/go-sql-driver/mysql#dsn-data-source-name
  ##  e.g.
  ##    servers = ["user:passwd@tcp(127.0.0.1:3306)/?tls=false"]
  ##    servers = ["user@tcp(127.0.0.1:3306)/?tls=false"]
  #
  ## If no servers are specified, then localhost is used as the host.
  servers = ["tcp(127.0.0.1:3306)/"]

  ## Selects the metric output format.
  ##
  ## This option exists to maintain backwards compatibility, if you have
  ## existing metrics do not set or change this value until you are ready to
  ## migrate to the new format.
  ##
  ## If you do not have existing metrics from this plugin set to the latest
  ## version.
  ##
  ## Telegraf >=1.6: metric_version = 2
  ##           <1.6: metric_version = 1 (or unset)
  metric_version = 2

  ## if the list is empty, then metrics are gathered from all database tables
  # table_schema_databases = []

  ## gather metrics from INFORMATION_SCHEMA.TABLES for databases provided
  ## in the list above
    gather_table_schema = true

  ## gather thread state counts from INFORMATION_SCHEMA.PROCESSLIST
    gather_process_list = true

  ## gather user statistics from INFORMATION_SCHEMA.USER_STATISTICS
    gather_user_statistics = true

  ## gather auto_increment columns and max values from information schema
    gather_info_schema_auto_inc = true

  ## gather metrics from INFORMATION_SCHEMA.INNODB_METRICS
    gather_innodb_metrics = true

  ## gather metrics from all channels from SHOW SLAVE STATUS command output
  # gather_all_slave_channels = false

  ## gather metrics from SHOW SLAVE STATUS command output
    gather_slave_status = true

  ## use SHOW ALL SLAVES STATUS command output for MariaDB
  # mariadb_dialect = false

  ## gather metrics from SHOW BINARY LOGS command output
    gather_binary_logs = true

  ## gather metrics from SHOW GLOBAL VARIABLES command output
    gather_global_variables = true

  ## gather metrics from PERFORMANCE_SCHEMA.TABLE_IO_WAITS_SUMMARY_BY_TABLE
    gather_table_io_waits = true

  ## gather metrics from PERFORMANCE_SCHEMA.TABLE_LOCK_WAITS
    gather_table_lock_waits = true

  ## gather metrics from PERFORMANCE_SCHEMA.TABLE_IO_WAITS_SUMMARY_BY_INDEX_USAGE
    gather_index_io_waits = true

  ## gather metrics from PERFORMANCE_SCHEMA.EVENT_WAITS
    gather_event_waits = true

  ## gather metrics from PERFORMANCE_SCHEMA.FILE_SUMMARY_BY_EVENT_NAME
    gather_file_events_stats = true

  ## gather metrics from PERFORMANCE_SCHEMA.EVENTS_STATEMENTS_SUMMARY_BY_DIGEST
  # gather_perf_events_statements = false
  #
  ## gather metrics from PERFORMANCE_SCHEMA.EVENTS_STATEMENTS_SUMMARY_BY_ACCOUNT_BY_EVENT_NAME
    gather_perf_sum_per_acc_per_event = true
  #
  ## list of events to be gathered for gather_perf_sum_per_acc_per_event
  ## in case of empty list all events will be gathered
  # perf_summary_events = []

  ## the limits for metrics form perf_events_statements
  # perf_events_statements_digest_text_limit = 120
  # perf_events_statements_limit = 250
  # perf_events_statements_time_limit = 86400

  ## Some queries we may want to run less often (such as SHOW GLOBAL VARIABLES)
  ##   example: interval_slow = "30m"
  # interval_slow = ""

  ## Optional TLS Config (used if tls=custom parameter specified in server uri)
  # tls_ca = "/etc/telegraf/ca.pem"
  # tls_cert = "/etc/telegraf/cert.pem"
  # tls_key = "/etc/telegraf/key.pem"
  ## Use TLS but skip chain & host verification
  # insecure_skip_verify = false

### System metrics
[[inputs.disk]]
[[inputs.net]]
[[inputs.mem]]
[[inputs.system]]
[[inputs.cpu]]
  percpu = false
  totalcpu = true
  collect_cpu_time = true
  report_active = true

### Output
[[outputs.http]]
  url = "https://@metricsUsername:@metricsPassword@@metrics_id-vm.logit.io:@vmAgentPort/api/v1/write"
  data_format = "prometheusremotewrite"

  [outputs.http.headers]
    Content-Type = "application/x-protobuf"
    Content-Encoding = "snappy"
Read more about how to configure data scraping and configuration options for MySQL (opens in a new tab)
Start Telegraf
From the location where Telegraf was installed (C:\Program Files\InfluxData\telegraf\telegraf-1.34.1) run the program
providing the chosen configuration file as a parameter:
.\telegraf.exe --config telegraf.confOnce Telegraf is running you should see output similar to the following, which confirms the inputs, output and basic configuration the application has been started with:

Launch Grafana to View Your Data
Launch GrafanaHow to diagnose no data in Stack
If you don't see data appearing in your stack after following this integration, take a look at the troubleshooting guide for steps to diagnose and resolve the problem or contact our support team and we'll be happy to assist.
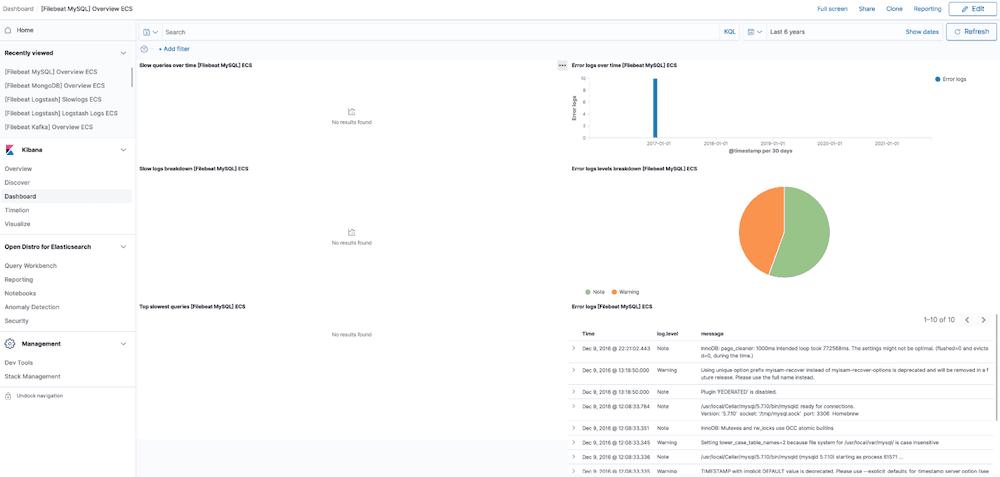
MySQL Dashboard
The MySQL module comes with predefined Kibana dashboards. To view your dashboards for any of your Logit.io stacks, launch Logs and choose Dashboards.
MySQL Logging Overview
MySQL is an open source relational database management system created by Michael Widenius in 1995, this relational database runs across the majority of operating systems & is closely associated with its usage for web applications.
MySQL powers some of the world's highest traffic sites, including Facebook, YouTube & Pinterest.
MySQL is able to work within an operating system to organise data into multiple data tables and show which data types may be related to each other. This helps the user to easily structure their data.
When used in this way, relational databases can be used to test database integrity, manage users and create backups of vital data.
MySQL Servers create numerous logs that you can use for troubleshooting and analysis, the most important ones include: Slow query logs, General query logs & error logs.
These logs default to a text file format, which can quickly become tedious to parse and process quickly to spot functional problems, opportunities to improve performance and identify security issues.
Our built in HA (high availability) MySQL log file analyser (opens in a new tab) can be used to centralise your data & set up alerts to monitor your log data in real-time as well as deliver metrics for Kibana visualisations & reports with easily.