HAProxy
Ship logs from HAProxy to Logstash
Follow the steps below to send your observability data to Logit.io
Logs
Configure Filebeat to ship logs from HAProxy to Logstash and Elasticsearch.
Install Integration
Install Filebeat
To get started you will need to install filebeat. To do this you have two main options:
- Choose the AMD / Intel file (x86_64) or
- Choose the ARM file (aarch64)
You can tell if you have a PC with an ARM CPU architecture by opening the Terminal
application and running the arch command. If it displays arm64 you have ARM architecture.
To successfully install filebeat you will need to have root access.
If you have an x86_64 system download and install filebeat using the following commands:
curl -L -O https://artifacts.elastic.co/downloads/beats/filebeat/filebeat-8.15.2-amd64.deb
sudo dpkg -i filebeat-8.15.2-amd64.deb
If you have an aarch64 system download and install filebeat using the following commands:
curl -L -O https://artifacts.elastic.co/downloads/beats/filebeat/filebeat-8.15.2-arm64.deb
sudo dpkg -i filebeat-8.15.2-arm64.deb
The default configuration file is located at:
/etc/filebeat/filebeat.yml
Setup HAProxy Configuration
DEB (Debian/Ubuntu)
HAProxy generates logs in syslog format, on debian and ubuntu the haproxy package contains the required syslog configuration to generate a haproxy.log file which we will then monitor using filebeat. Confirm the existence of /etc/rsyslog.d/49-haproxy.conf and /var/log/haproxy.log If you've recently installed haproxy you may need to restart rsyslog to get additional haproxy config file loaded.
RPM (Centos/RHEL)
The RPM haproxy default configuration sends it's logs to a syslog daemon listening on localhost via UDP. We need to configure rsyslog to listen on localhost and write a haproxy.log file which we will then monitor using filebeat. Run the following lines of command and then restart rsyslog.
echo '#Rsyslog configuration to listen on localhost for HAProxy log messages
#and write them to /var/log/haproxy.log
$ModLoad imudp
$UDPServerRun 514
$UDPServerAddress 127.0.0.1
local2.*    /var/log/haproxy.log' | sudo tee /etc/rsyslog.d/haproxy.conf

sudo systemctl restart rsyslog
Enable the Haproxy module
sudo filebeat modules list
sudo filebeat modules enable haproxy
In the module config under modules.d, change the module settings to match your environment. You must enable at least one fileset in the module.
Filesets are disabled by default.
Copy the snippet below and replace the contents of the haproxy.yml module file:
# Module: haproxy
# Docs: https://www.elastic.co/guide/en/beats/filebeat/8.12/filebeat-module-haproxy.html

- module: haproxy
  # All logs
  log:
    enabled: true

    # Set which input to use between syslog (default) or file.
    var.input: file

    # Set custom paths for the log files. If left empty,
    # Filebeat will choose the paths depending on your OS.
    #var.paths:
Update Your Configuration File
The configuration file below is pre-configured to send data to your Logit.io Stack via Logstash.
Copy the configuration file below and overwrite the contents of filebeat.yml.
###################### Logit.io Filebeat Configuration ########################
# ============================== Filebeat inputs ==============================

# ============================== Filebeat modules ==============================
filebeat.config.modules:
  path: ${path.config}/modules.d/*.yml
  reload.enabled: false
  #reload.period: 10s

# ================================= Processors =================================
processors:
  - add_host_metadata:
      when.not.contains.tags: forwarded
  - add_cloud_metadata: ~
  - add_docker_metadata: ~
  - add_kubernetes_metadata: ~

# ================================== Outputs ===================================
# ------------------------------ Logstash Output -------------------------------
output.logstash:
  hosts: ["@logstash.host:@logstash.sslPort"]
  loadbalance: true
  ssl.enabled: true
Validate Configuration
sudo @beatname test config -c /etc/@beatname/@beatname.ymlIf the yml file is invalid, @beatname will print a description of the error. For example, if the
output.logstash section was missing, @beatname would print no outputs are defined, please define one under the output section
Start filebeat
To start Filebeat, run:
sudo systemctl start filebeatLaunch OpenSearch Dashboards to View Your Data
Launch OpenSearch DashboardsHow to diagnose no data in Stack
If you don't see data appearing in your stack after following this integration, take a look at the troubleshooting guide for steps to diagnose and resolve the problem or contact our support team and we'll be happy to assist.
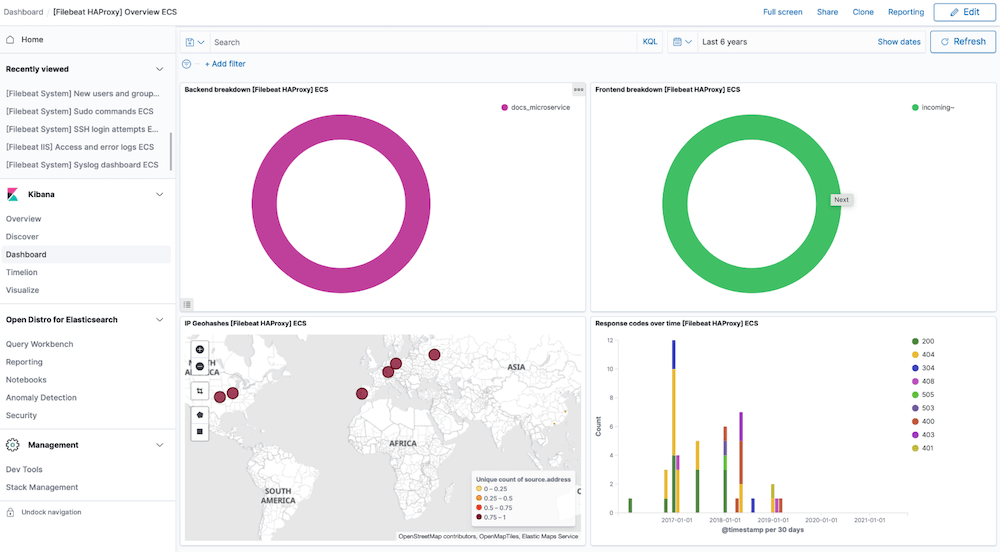
HAProxy dashboard
Metrics
Configure Telegraf to ship HAproxy metrics to your Logit.io stacks.
Install Integration
Install Telegraf
This integration allows you to configure a Telegraf agent to send your metrics to Logit.io.
Choose the installation method for your operating system:
Debian and Ubuntu users can install the latest stable version of Telegraf using the apt package manager.
The command line below will:
- Download and install repository signing key
- Configure the influxdata repository
- Install telegraf
curl --silent --location -O \
https://repos.influxdata.com/influxdata-archive.key \
&& echo "943666881a1b8d9b849b74caebf02d3465d6beb716510d86a39f6c8e8dac7515  influxdata-archive.key" \
| sha256sum -c - && cat influxdata-archive.key \
| gpg --dearmor \
| sudo tee /etc/apt/trusted.gpg.d/influxdata-archive.gpg > /dev/null \
&& echo 'deb [signed-by=/etc/apt/trusted.gpg.d/influxdata-archive.gpg] https://repos.influxdata.com/debian stable main' \
| sudo tee /etc/apt/sources.list.d/influxdata.list
sudo apt-get update && sudo apt-get install telegraf
The default configuration file is location at:
/etc/telegraf/telegraf.conf
Configure Telegraf
The configuration file below is pre-configured to scrape the system metrics from your hosts, add the following code to the configuration file telegraf.conf from the previous step.
### Read metrics of HAProxy, via stats socket or http endpoints
[[inputs.haproxy]]
  ## List of stats endpoints. Metrics can be collected from both http and socket
  ## endpoints. Examples of valid endpoints:
  ##   - http://myhaproxy.com:1936/haproxy?stats
  ##   - https://myhaproxy.com:8000/stats
  ##   - socket:/run/haproxy/admin.sock
  ##   - /run/haproxy/*.sock
  ##   - tcp://127.0.0.1:1936
  ##
  ## Server addresses not starting with 'http://', 'https://', 'tcp://' will be
  ## treated as possible sockets. When specifying local socket, glob patterns are
  ## supported.
  servers = ["http://myhaproxy.com:1936/haproxy?stats"]

  ## By default, some of the fields are renamed from what haproxy calls them.
  ## Setting this option to true results in the plugin keeping the original
  ## field names.
  # keep_field_names = false

  ## Optional TLS Config
  # tls_ca = "/etc/telegraf/ca.pem"
  # tls_cert = "/etc/telegraf/cert.pem"
  # tls_key = "/etc/telegraf/key.pem"
  ## Use TLS but skip chain & host verification
  # insecure_skip_verify = false

### System metrics
[[inputs.disk]]
[[inputs.net]]
[[inputs.mem]]
[[inputs.system]]
[[inputs.cpu]]
  percpu = false
  totalcpu = true
  collect_cpu_time = true
  report_active = true

### Output
[[outputs.http]]
  url = "https://@metricsUsername:@metricsPassword@@metrics_id-vm.logit.io:@vmAgentPort/api/v1/write"
  data_format = "prometheusremotewrite"

  [outputs.http.headers]
    Content-Type = "application/x-protobuf"
    Content-Encoding = "snappy"
Read more about how to configure data scraping and configuration options for HAproxy (opens in a new tab)
Start Telegraf
For systemd installations use systemctl to start telegraf
sudo systemctl start telegrafLaunch Grafana to View Your Data
Launch GrafanaHow to diagnose no data in Stack
If you don't see data appearing in your stack after following this integration, take a look at the troubleshooting guide for steps to diagnose and resolve the problem or contact our support team and we'll be happy to assist.
HAProxy Logs Overview
HAProxy (High Availability Proxy) is an open-source software load balancer for proxying HTTP & TCP based applications. As the tool offers high availability by default it is well suited for high traffic websites. HAProxy is the de-facto proxy server powering many of the web's most popular sites & is often the default deployment in most cloud platforms.
For most Linux distributions it is the reference load-balancer recommended for container orchestration (E.G Kubernetes). HAProxy logs hold data on HTTP queries, error codes & how long the request took to send, if it was queued and how long for, how long the TCP connection took to establish, as well as information on response size and cookies, among other valuable insights for reporting & security. These logs can be difficult to process for analysis at scale & so a log analyser will likely be required to process HAProxy logs efficiently.
Requests & traffic for HTTP & TCP based applications are spread across multiple servers when HAProxy is used. The proxy is well known for its flexibility & the tool's logs can be used in a log management solution such as Logit.io for easy identification of critical issues within an application. The Logit.io platform offers a complete solution for centralising your log files from multiple applications and servers and provides a HAProxy log analyser as standard. You can also use our Kibana integrations to visualise key server metrics from both frontend and backend applications for fast error resolution & troubleshooting. Followed our HAProxy log configuration guide and are still encountering issues? We're here to help you get started. Feel free to reach out by contacting our support team by visiting our dedicated Help Centre or via live chat & we'll be happy to assist.