MongoDB
Ship MongoDB logs to Logstash
Follow the steps below to send your observability data to Logit.io
Logs
Discover the process of transmitting MongoDB logs to your Logstash instance through our illustrative configuration examples.
Install Integration
Install Filebeat
To get started you will need to install filebeat. To do this you have two main options:
- Choose the filebeat (opens in a new tab) ZIP file (Windows ZIP x86_64) or
- Choose the Microsoft Software Installer MSI (opens in a new tab) file (Windows MSI x86_64 (beta))
To successfully install filebeat and set up the required Windows service you will need to have administrator access.
If you have chosen to download the zip file:
- Extract the contents of the zip file into C:\Program Files.
- Rename the extracted folder to filebeat
- Open a PowerShell prompt as an Administrator (right-click the PowerShell icon and select Run As Administrator).
- From the PowerShell prompt, run the following commands to install filebeat as a Windows service:
cd 'C:\Program Files\filebeat'.\install-service-filebeat.ps1If script execution is disabled on your system, you need to set the execution policy for the current session to allow the script to run. For example:
PowerShell.exe -ExecutionPolicy UnRestricted -File .\install-service-filebeat.ps1For more information about Powershell execution policies see here (opens in a new tab).
If you have chosen to download the filebeat.msi file:
- double-click on it and the relevant files will be downloaded.
At the end of the installation process you'll be given the option to open the folder where filebeat has been installed.
- Open a PowerShell prompt as an Administrator (right-click the PowerShell icon and select Run As Administrator).
- From the PowerShell prompt, change directory to the location where filebeat was installed and run the following command to install filebeat as a Windows service:
.\install-service-filebeat.ps1If script execution is disabled on your system, you need to set the execution policy for the current session to allow the script to run. For example:
PowerShell.exe -ExecutionPolicy UnRestricted -File .\install-service-filebeat.ps1For more information about Powershell execution policies see here (opens in a new tab).
The default configuration file is located at:
C:\Program Files\filebeat\filebeat.yml
Enable the MongoDB module
There are several built in filebeat modules you can use. You will need to enable the mongodb module:
.\filebeat.exe modules list
.\filebeat.exe modules enable mongodb
In the module config under modules.d, change the module settings to match your environment. You must enable at least one fileset in the module.
Filesets are disabled by default.
Copy the snippet below and replace the contents of the mongodb.yml module file:
# Module: mongodb
# Docs: https://www.elastic.co/guide/en/beats/filebeat/8.12/filebeat-module-mongodb.html

- module: mongodb
  # All logs
  log:
    enabled: true

    # Set custom paths for the log files. If left empty,
    # Filebeat will choose the paths depending on your OS.
    #var.paths:
Update Your Configuration File
The configuration file below is pre-configured to send data to your Logit.io Stack via Logstash.
Copy the configuration file below and overwrite the contents of filebeat.yml.
# ============================== Filebeat modules ==============================
filebeat.config.modules:
  path: ${path.config}/modules.d/*.yml
  reload.enabled: false
  #reload.period: 10s

# ================================== Outputs ===================================
# ------------------------------ Logstash Output -------------------------------
output.logstash:
  hosts: ["@logstash.host:@logstash.sslPort"]
  loadbalance: true
  ssl.enabled: true

# ================================= Processors =================================
processors:
  - add_host_metadata:
      when.not.contains.tags: forwarded
  - add_cloud_metadata: ~
  - add_docker_metadata: ~
  - add_kubernetes_metadata: ~
If you're running Filebeat 7 add this code block to the end. Otherwise, you can leave it out.
# ... For Filebeat 7 only ...
filebeat.registry.path: /var/lib/filebeat
If you're running Filebeat 6 add this code block to the end. Otherwise, you can leave it out.
# ... For Filebeat 6 only ...
registry_file: /var/lib/filebeat/registry
Validate your YAML
It's a good idea to run the configuration file through a YAML validator to rule out indentation errors, clean up extra characters, and check if your YAML file is valid. Yamllint.com (opens in a new tab) is a great choice.
Validate configuration
.\@beatname.exe test config -c @beatname.ymlIf the yml file is invalid, @beatname will print a description of the error. For example, if the
output.logstash section was missing, @beatname would print no outputs are defined, please define one under the output section
Start filebeat
To start Filebeat, run in Powershell:
Start-Service filebeatLaunch OpenSearch Dashboards to View Your Data
Launch OpenSearch DashboardsHow to diagnose no data in Stack
If you don't see data appearing in your stack after following this integration, take a look at the troubleshooting guide for steps to diagnose and resolve the problem or contact our support team and we'll be happy to assist.
Metrics
Configure Telegraf to ship MongoDB Server metrics to your Logit.io stacks.
Install Integration
Install Telegraf
This integration allows you to configure a Telegraf agent to send your metrics to Logit.io.
Choose the installation method for your operating system:
When you paste the command below into Powershell it will download the Telegraf zip file.
Once that is complete, press Enter again and the zip file will be extracted into C:\Program Files\InfluxData\telegraf\telegraf-1.34.1.
wget https://dl.influxdata.com/telegraf/releases/telegraf-1.34.1_windows_amd64.zip -UseBasicParsing -OutFile telegraf-1.34.1_windows_amd64.zip
Expand-Archive .\telegraf-1.34.1_windows_amd64.zip -DestinationPath 'C:\Program Files\InfluxData\telegraf'
or in Powershell 7 use:
# Download the Telegraf ZIP file
Invoke-WebRequest -Uri "https://dl.influxdata.com/telegraf/releases/telegraf-1.34.1_windows_amd64.zip" `
                -OutFile "telegraf-1.34.1_windows_amd64.zip" `
                -UseBasicParsing

# Extract the contents of the ZIP file
Expand-Archive -Path ".\telegraf-1.34.1_windows_amd64.zip" `
            -DestinationPath "C:\Program Files\InfluxData\telegraf"
The default configuration file is location at:
C:\Program Files\InfluxData\telegraf\telegraf.conf
Configure Telegraf
The configuration file below is pre-configured to scrape the system metrics from your hosts, add the following code to the configuration file telegraf.conf from the previous step.
### Read metrics from one or many MongoDB servers
[[inputs.mongodb]]
  ## An array of URLs of the form:
  ##   "mongodb://" [user ":" pass "@"] host [ ":" port]
  ## For example:
  ##   mongodb://user:[email protected]:27017,
  ##   mongodb://10.10.3.33:18832,
  ##
  ## If connecting to a cluster, users must include the "?connect=direct" in
  ## the URL to ensure that the connection goes directly to the specified node
  ## and not have all connections passed to the master node.
  servers = ["mongodb://127.0.0.1:27017/?connect=direct"]

  ## When true, collect cluster status.
  ## Note that the query that counts jumbo chunks triggers a COLLSCAN, which
  ## may have an impact on performance.
    gather_cluster_status = true

  ## When true, collect per database stats
    gather_perdb_stats = true

  ## When true, collect per collection stats
    gather_col_stats = true

  ## When true, collect usage statistics for each collection
  ## (insert, update, queries, remove, getmore, commands etc...).
  # gather_top_stat = false

  ## List of db where collections stats are collected
  ## If empty, all db are concerned
  # col_stats_dbs = ["local"]

  ## Optional TLS Config
  # tls_ca = "/etc/telegraf/ca.pem"
  # tls_cert = "/etc/telegraf/cert.pem"
  # tls_key = "/etc/telegraf/key.pem"
  ## Use TLS but skip chain & host verification
  # insecure_skip_verify = false

  ## Specifies plugin behavior regarding disconnected servers
  ## Available choices :
  ##   - error: telegraf will return an error on startup if one the servers is unreachable
  ##   - skip: telegraf will skip unreachable servers on both startup and gather
  # disconnected_servers_behavior = "error"

### System metrics
[[inputs.disk]]
[[inputs.net]]
[[inputs.mem]]
[[inputs.system]]
[[inputs.cpu]]
  percpu = false
  totalcpu = true
  collect_cpu_time = true
  report_active = true

### Output
[[outputs.http]]
  url = "https://@metricsUsername:@metricsPassword@@metrics_id-vm.logit.io:@vmAgentPort/api/v1/write"
  data_format = "prometheusremotewrite"

  [outputs.http.headers]
    Content-Type = "application/x-protobuf"
    Content-Encoding = "snappy"
Read more about how to configure data scraping and configuration options for MongoDB (opens in a new tab)
Start Telegraf
From the location where Telegraf was installed (C:\Program Files\InfluxData\telegraf\telegraf-1.34.1) run the program
providing the chosen configuration file as a parameter:
.\telegraf.exe --config telegraf.confOnce Telegraf is running you should see output similar to the following, which confirms the inputs, output and basic configuration the application has been started with:

Launch Grafana to View Your Data
Launch GrafanaHow to diagnose no data in Stack
If you don't see data appearing in your stack after following this integration, take a look at the troubleshooting guide for steps to diagnose and resolve the problem or contact our support team and we'll be happy to assist.
MongoDB dashboard
The MongoDB module comes with predefined Kibana dashboards. To view your dashboards for any of your Logit.io stacks, launch Logs and choose Dashboards.
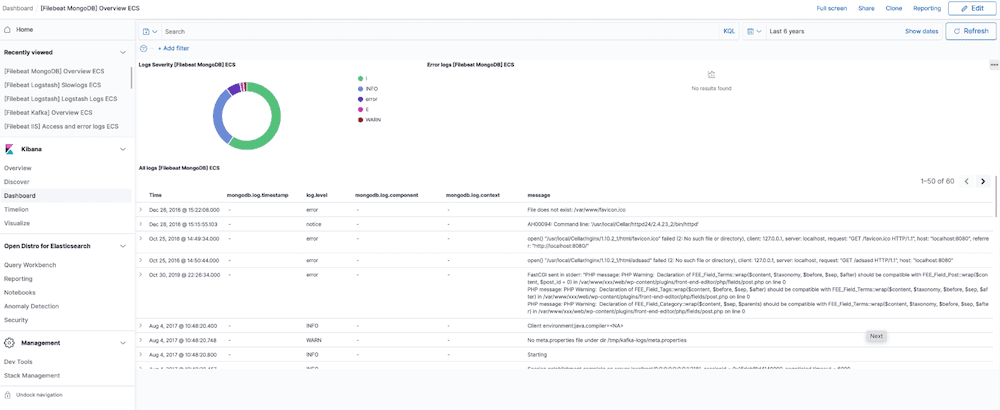
MongoDB Overview
Comprehensively understand how to efficiently transport MongoDB data to Logstash by following these detailed steps and utilizing the illustrative examples we've provided. This resource will guide you through the process, ensuring a smooth and effective data shipping procedure.