
Resources
10 min read
Last updated:
If you are trying to compare all of the best solutions for application performance monitoring and management you may have found that it can be highly complicated to compare all of the available observability tools whilst also trying to keep within a reasonable budget.
With many APM vendors increasingly concealing the cost of their service behind forms and sales calls, we wanted to bring you a detailed list of some of the best proprietary and open-source tools to help you make an informed decision on where to process your application data.
Contents
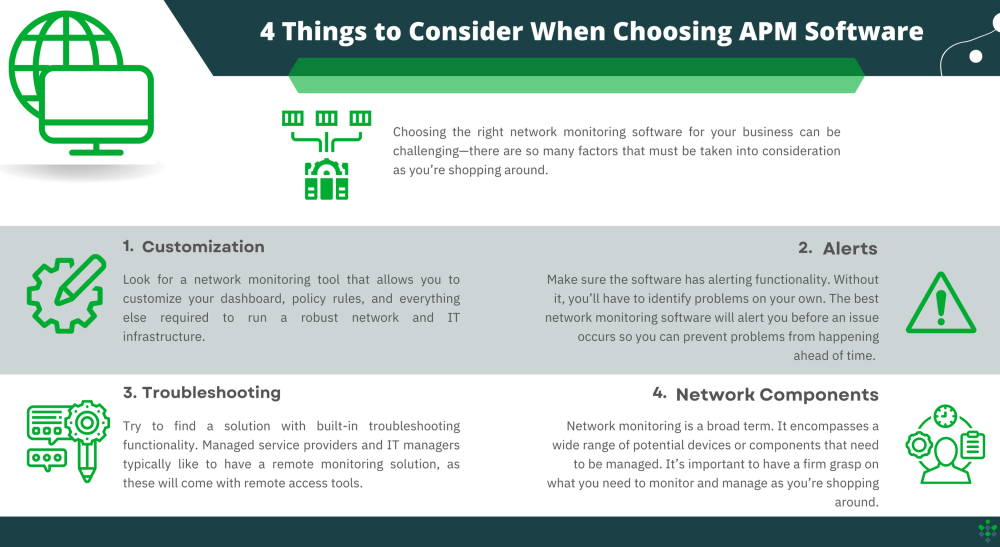
Graphic provided by Crazy Egg.
1. Logit.io
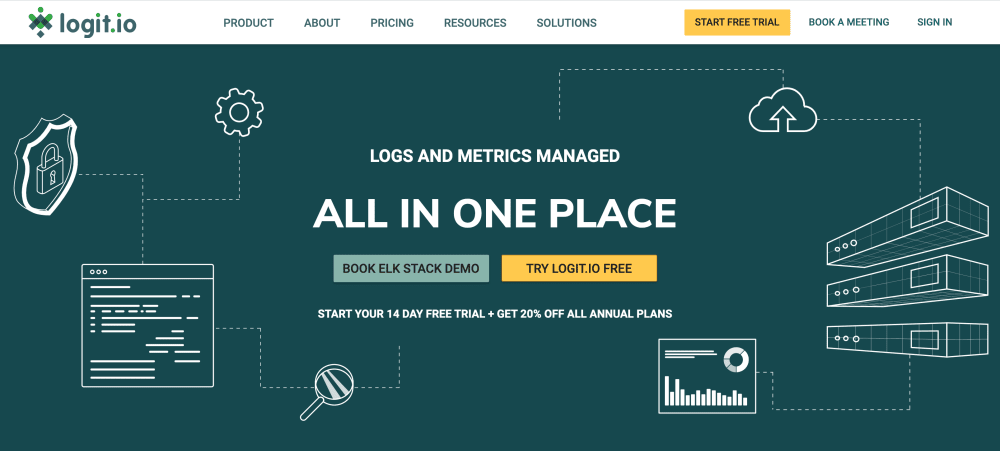 Logit.io’s application performance monitoring platform ensures that engineers and developers have complete visibility of their application’s performance. The Logit.io APM solution is also built with high scalability in mind and enables its users to configure real-time alerts from custom scripts and ready to launch templates.
The platform offers full support and hosting for Elasticsearch, Logstash and Kibana as well as Grafana and OpenSearch which in turn allows for many dashboard configurations and additional reporting options.
Alongside its comprehensive application monitoring features, the platform is suitable for a variety of additional use cases including but not limited to log management, container monitoring, infrastructure monitoring, SIEM, & deep metrics analysis.
Logit.io is also rated 5/5 stars on Capterra, Software Advice and Gartner.
Key Features:
- Unlimited users
- 100's of Integrations
- Custom dashboards
- Overusage protection
- Alerting and Notifications
- Autoscaling open platform
- Two-factor authentication (2FA)
- Monitor unlimited endpoints and devices
- Enterprise uptime SLAs available to 99.999%
- Slowest application endpoints & database queries
- Highly available data centres in EU, UK and US regions
- Hot, warm, cold architecture with automated Elastic index management
- Authentication options including SSO, SAML, Google, Azure, Github, Email and more
2. Dynatrace
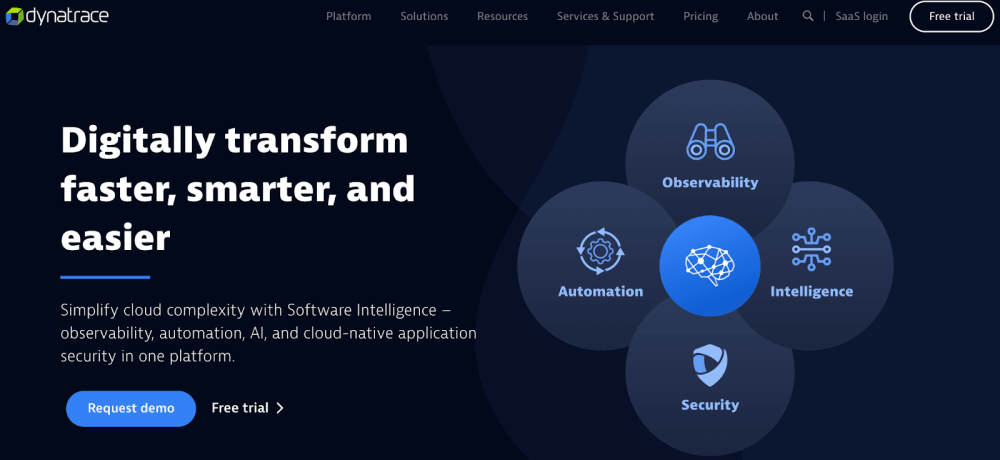 Dynatrace is an application monitoring tool that aims to simplify cloud complexity so that organisations can move towards digital transformation faster.
Many system administrators agree that there is quite a significant learning curve with getting onboard with Dynatrace due to the amount of documentation required to learn in order to make the most out of the platform.
As many of Dynatrace's competitors offer a simpler onboarding journey, it may be worth benchmarking this tool against other services to see how fast it is to begin monitoring your applications in full from the point of registration.
Key Features:
- Distributed traces
- Metrics, logs & traces in context
- Complete dependency mapping
- Automatic continuous instrumentation
3. Raygun
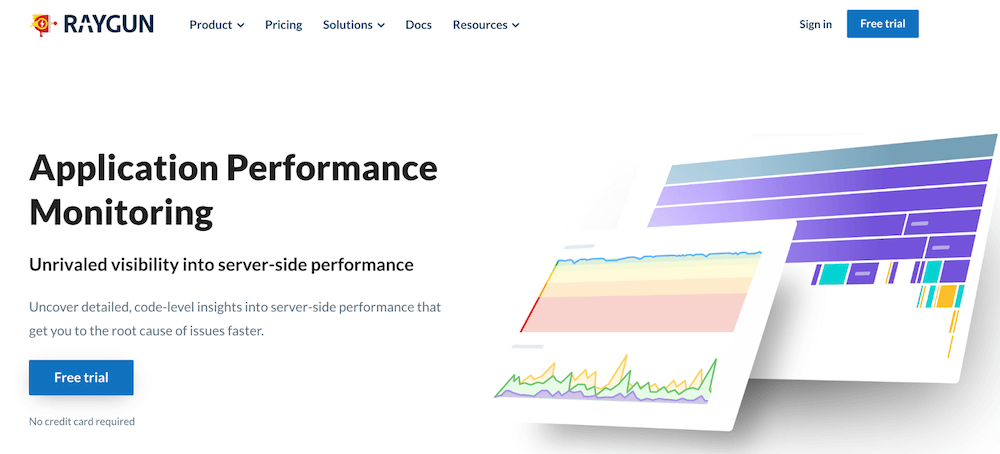 Raygun offers a suite of tools that allow users to observe their server performance and identify issues with heightened support for .Net, Ruby and Node.js. This APM solution also boasts the features necessary to offer its users world-class support for both insight gathering and custom control of data sampling
Key Features:
- Unlimited users
- Unlimited hosts
- Single sign-on (SSO)
- Email and chat support
- Two-factor authentication (2FA)
4. Scout
 Scout APM is a well established APM solution provider that was established all the way back in 2008. For larger organisations that generate a large number of errors, Scout is well suited for analysis of up to 5,000 errors generated monthly.
Key Features:
- Alerting
- Github integration
- Daily digest emails
- Background job monitoring
- Detailed transaction traces
5. Instabug
 Instabug seeks to dispel confusion in their platform users by focusing on a single performance metric that encompasses all of the major application KPIs which are normally split across a distributed reporting dashboard.
Key Features:
- Custom traces
- UI hang detection
- Custom app traces
- Network performance monitoring
6. Splunk
 Splunk’s APM solution is well known among DevOps and Developers alike for its extensive feature set. Splunk acquired Signal FX (another application performance monitoring tool) back in 2019 which resulted in them expanding their observability capabilities even further.
The platform is used by a number of notable organisations including Zillow and Care.com. One major drawback of the platform lies primarily in their pricing as they are not very transparent and many previous users note that the ability to scale is often limited due to the cost of the platform.
Key Features:
- Tag spotlight
- Service mapping
- Business workflows
- Smart dynamic alerting
- Trace ingestion and retention
7. Datadog
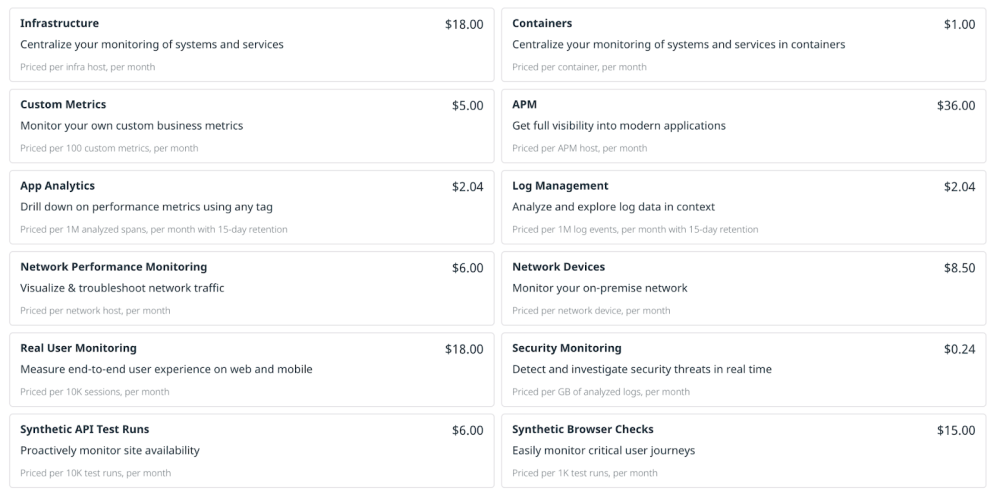 If you require an application performance monitoring platform that is able to provide end to end distributed tracing then Datadog may be the right tool to fulfil this particular use case.
Datadog’s APM platform is said to have twice as many features as New Relic so may provide users with more value if they need extensive configuration and additional monitoring features.
In recent years users have noted that the feature gap between Datadog and competitors such as Instana, Dynatrace & Appdynamics is quickly closing so you may wish to trial a few APM platforms side by side to see which service performs the best for your particular use case.
Key Features:
- Search and analyse
- Deployment tracking
- Tag-based retention filters.
- Auto-retention of error traces
- Service dependency visualisations
8. New Relic
 New Relic’s APM solution offers support for a number of leading programming languages including Python, C SDK, Ruby and PHP among a number of other popular frameworks.
The majority of New Relic’s closest competitors are included in this list already but a few more that haven’t previously been mentioned include Microsoft Azure Application Insights, Nexthink and Aternity APM.
Key Features:
- Unlimited alerts
- Anomaly detection
- Unlimited incident events
9. Loupe
 If you require an APM solution specifically for Java & .NET monitoring, then look no further than Loupe. The Loupe platform was created back in 2009 by Gibraltar Software Inc. In addition to APM, Loupe also offers a centralised logging platform that supports both real-time remote log viewing and active directory integration.
Key Features:
- Unlimited users
- Unlimited errors
- Unlimited applications
10. Appoptics
 Solarwinds backed solution Appoptics provides users with the ability to monitor not only applications but also infrastructure and server monitoring in one centralised platform. Appoptics has been the APM tool of choice by companies such as Traxco and TechValidate according to their recent case studies.
Key Features:
- Distributed tracing
- Exception tracking
- Root cause summary
11. Scouter
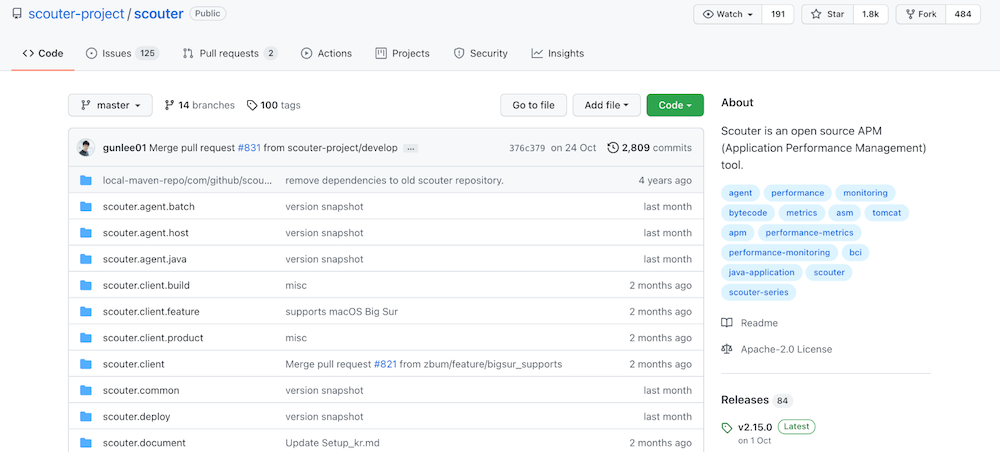 Scouter’s application performance management tool provides an open-source alternative to proprietary services such as Appdynamics and New Relic. Open source tools can offer a more affordable alternative to using closed source platforms and these also benefit the user additionally by often offering more community support as well as simplified license management.
12. AppDynamics
 AppDynamics offers a performance monitoring tool that is well suited for alleviating silos in visibility by offering full-stack observability. It is worth bearing in mind that Appdymanics has previously received criticism based on their support or lack thereof, as well as the high cost associated with the deployment and configuration of their tool. This is yet another tool that is highly rated for its extensive amount of third-party integrations.
13. StageMonitor
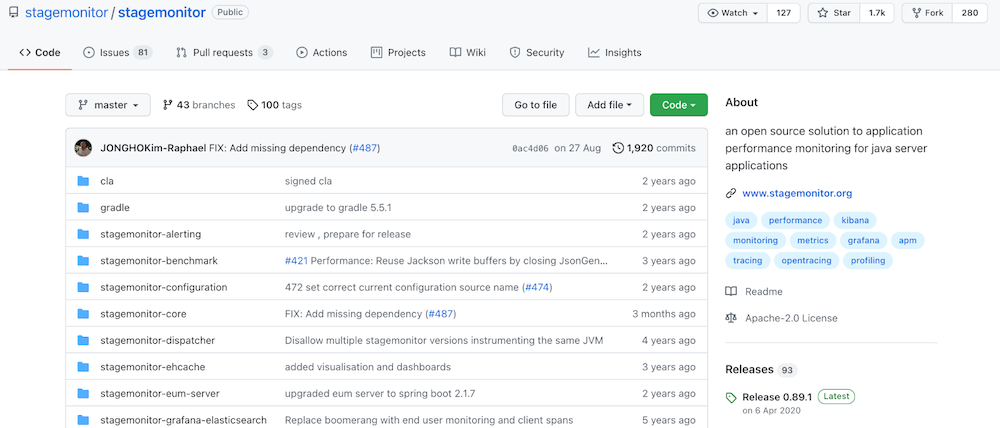 Stagemonitor’s open-source APM has been especially built with the monitoring of Java applications as its primary objective. As is the case with a number of tools in this roundup, Stagemonitor is often used in association with other open-source tools as part of a wider observability stack. This means that users of Stagemonitor may only use it for its APM capabilities and may decide to keep log aggregation confined to ELK (Elasticsearch, Logstash & Kibana).
Some users who wish to formulate a suitable alternative to New Relic may also add InfluxDB to this mix of different technologies. This setup will have overheads and costs associated with its upkeep due to the employees who are required to host, configure and maintain this stack.
14. ManageEngine
ManageEngine’s applications manager gives users the opportunity to improve their application performance and troubleshoot with ease. Unfortunately, the platform has faced criticism based on its dated user interface and its lack of ability to offer seamless platform upgrades.
Examples of companies that have made ManageEngine their choice for application performance monitoring include Great Lakes Energy, Telelogic and the Ohio Department of Education, most notably.
Key Features:
- Application discovery and dependency mapping
- End-user experience monitoring
- Synthetic transaction monitoring
- Custom dashboards
- Transaction tracing
15. Tideways
 Tideway's APM solution is built with PHP application performance monitoring in mind and provides a combination of features that takes attributes from monitoring, profiling and exception tracking to provide additional heightened performance insights.
Some of the most popular libraries and frameworks that Tideways offer APM support for include Magento, Shopware, Larvel, Symfony and Spryker.
Key Features:
- Separately track endpoints across environments
- Up to ten traces per minute
- Five days of data retention
- Unlimited PHP requests
16. Blackfire
 Blackfire offers application monitoring software suited for continuous performance testing and currently supports PHP and Python with support for Ruby being released soon.
Some of the key metrics this tool reports on include % slower and faster median response times, total number of requests, % of successful builds and slowest transactions as well as helpful performance tips and advice.
Key Features:
- Single user environment
- Public profiles sharing
- Unlimited machines
- 30 days retention
- Unlimited users
17. Apache Skywalking
 Apache Skywalking is an open-source application monitoring tool that sports framework support and core features that may satisfy many users' open-source APM requirements.
While the platform UI still leaves much to be desired, this is going to be more affordable as a solution than many proprietary platforms (such as Datadog or Splunk). It is noted by some users that Skywalking may be used in isolation or as part of a wider technology stack (with some users opting to manage logging in a separate ELK Stack).
Key Features:
- Support for Java, .Net Core, PHP, NodeJS and Golang agents
- Customizable dashboard
- Envoy service mesh support
- Trace and profile explorer
- Topology map
18. AppSignal
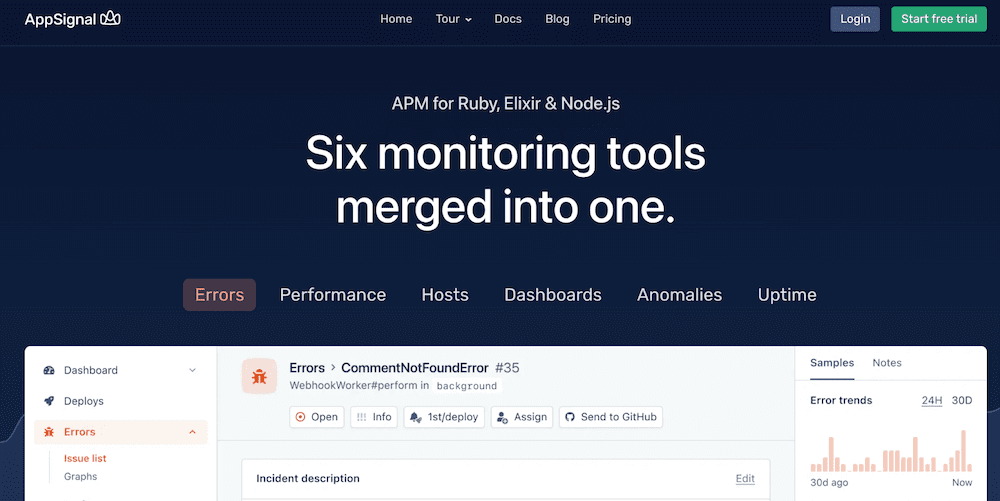 AppSignal is another application monitoring tool that grants users with the ability to monitor the performance of applications written in Ruby and Node.js. The platform also supports Elixr, Express & Ember in addition to this. AppSignal’s tool offers both a proprietary and open source version of their software, with the latter distribution being free to use.
Key Features:
- Change issue status
- Request details
- Event timeline
- Breakdowns
19. Instana
 Instana is an APM vendor that was acquired by IBM in December 2020. If full automation of APM is one of your key requirements then Instana will likely meet a number of your expectations. The platform's automation features extend to the discovery, mapping and configuration of cloud-native applications.
Key Features:
- Service dependency map
- Distributed tracing
- Custom metrics
- Analyzed traces
- No sampling
20. SigNoz
 SigNoz is an open-source application performance monitoring solution that was developed as an alternative to Datadog. The platform was initially built using Prometheus and Grafana but creator Pranay Prateek didn't believe that this was a comprehensive enough solution which inspired him to build his own end to end APM solution that was fully open source.
Unfortunately, when last checked SigNoz did not have real user monitoring on their planned features roadmap, this isn't to say that this won't be added in the future but users may have to express more interest before this feature is planned.
Due to its widespread adoption SigNoz benefits from offering a wealth of user stories from industry-leading organisations including its use as an APM solution by Netflix, Groupon and Uber Eats.
Key Features:
- Custom aggregates on filtered traces
- Slowest application endpoints
- Application overview metrics
- Slow database queries
- Exact request traces
21. PinPoint APM
 PinPoint is another open-source application performance monitoring tool that benefits its users by offering a solution that has minimal impact on resource usage and performance.
Some users of Pinpoint have stated that they seem to only be able to view a portion of the JMS messages and HTTP requests being created by their services. A solution to this problem is to simply increase the sampling rate in order to trace every event that is being generated.
Key Features:
- Cross compatible with numerous APM Agents
- Monitor your application in Real-Time
- View application topology
- Gain code-level visibility
Cost: Free
We hope that you enjoyed this list of the best application monitoring tools available today, think we’ve missed a tool that you use for APM? Then feel free to send your feedback to [email protected]
If you enjoyed this article then why not check out our guide covering what is canary deployment?