
Resources
8 min read
Last updated:
Cloud application performance monitoring tools are utilized to gather an extensive range of metrics and logs from cloud resources and services. Some commonly monitored metrics include CPU utilization, memory usage, network traffic, disk I/O, latency, and response time. By monitoring these metrics, among others, it becomes possible to gain insights into resource utilization, identify performance bottlenecks, and ensure that the infrastructure operates according to expectations. An application's performance may be degraded if CPU utilization consistently exceeds a certain threshold, for example. The monitoring of metrics helps administrators identify such issues and take appropriate action, such as provisioning additional resources or optimizing application code.
Monitoring cloud service logs is also crucial to understanding the behaviour and health of cloud-based systems. A system log often contains valuable information regarding system events, errors, warnings, and security-related activities. Monitoring logs enables the detection and investigation of anomalies, issue resolution, and identification of root causes. By analyzing application logs, it is possible to identify specific errors encountered by users or uncover patterns that may indicate potential performance or security weaknesses. This allows for a proactive approach to addressing and resolving problems.
In general, cloud monitoring provides organizations with visibility, insights, and control over their cloud infrastructure and applications. By proactively monitoring and analyzing metrics, logs, and security events, organizations can ensure optimal performance, address issues promptly, protect cloud workloads, and enhance the overall reliability and security of their cloud environment.
Throughout this article, we will examine the most commonly used tools for cloud monitoring.
Contents
1. Prometheus
Among cloud-native environments, Prometheus is widely used for monitoring and alerting. A pull-based model is employed to scrape metrics from applications, services, and infrastructure components. Metrics collected by Prometheus are stored in a time-series database, making querying and analysis efficient.
The Prometheus query language, PromQL, allows flexible and advanced querying of metrics. It supports functions, operators, and aggregations to perform complex data analysis. Furthermore, Prometheus provides built-in alerting capabilities based on metric thresholds or patterns. Whenever an alert is triggered, Prometheus can send notifications to external systems like email, PagerDuty, or Slack.
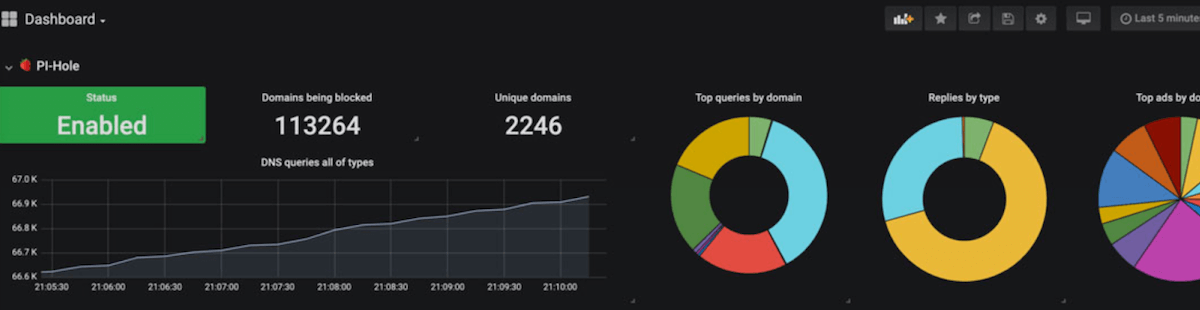
2. Grafana
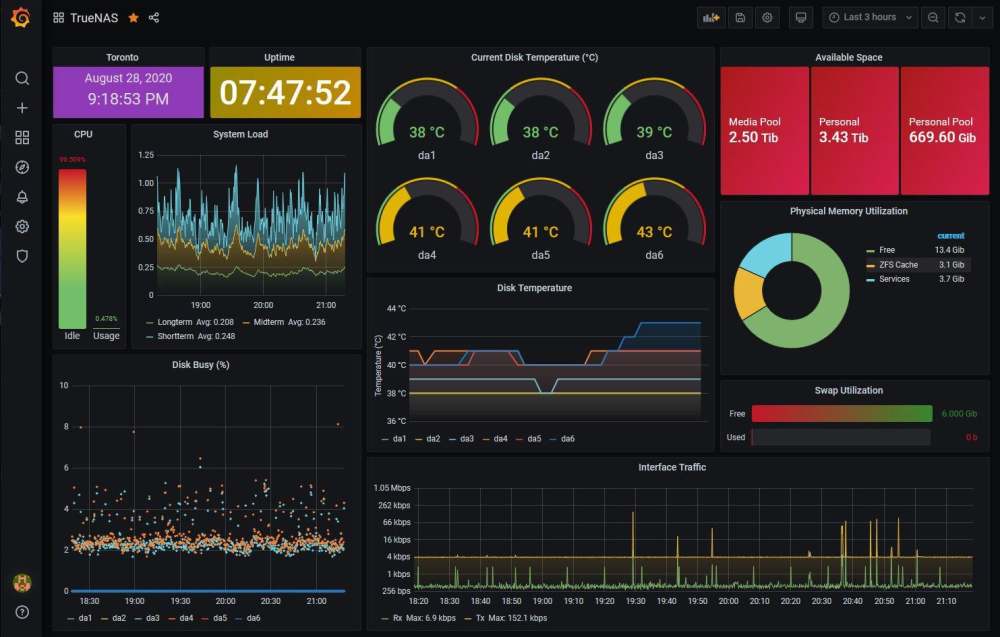
Grafana is an open-source data visualization and monitoring tool that integrates with Prometheus among other sources. Users can create rich, interactive dashboards and visualize monitoring data using the user-friendly and customizable interface. With Grafana, users can create graphs, charts, and maps that visually present metrics and logs. In addition to real-time streaming, annotations, and templating, it supports a wide range of visualization options. As part of Grafana's proactive monitoring capabilities, users can also create alert rules and define alert notifications.
3. Zabbix
Zabbix is a robust open-source monitoring solution that monitors networks, servers, virtual machines, applications, and more. Agent-based and agentless monitoring methods are available, allowing for flexibility in collecting data. Zabbix provides centralized monitoring data storage and retrieval. Numerous types of data can be stored, including numeric, character, and text data. Among the features offered by Zabbix are auto-discovery, triggers, notifications, and reporting. Triggers can be defined based on thresholds or patterns and notifications can be sent via email, SMS, or other methods.
4. Nagios
Among open-source monitoring systems, Nagios is widely used. The software monitors hosts, services, and network devices in a variety of environments. Both active and passive monitoring methods are supported by Nagios. In active monitoring, resources are monitored actively via probes or agents, while in passive monitoring data is gathered from external sources such as log files or SNMP traps. Plugins in Nagios allow integration with different technologies and systems to monitor diverse metrics. With Nagios, users can set thresholds, escalation procedures, and notification preferences.
5. Icinga
Icinga is an open-source monitoring platform forked from Nagios. It builds upon the Nagios core while introducing new features and improvements. For large environments, Icinga offers a scalable and distributed architecture. Cloud resources, network devices, host services, and network devices can all be monitored. Icinga supports both agent-based and agentless data collection methods. Metrics can be collected and processed from a variety of sources with the help of plugins. Using Icinga, users can define checks, notifications, and dependencies according to their needs.
These previously named open-source cloud monitoring tools provide organizations with powerful and flexible options for monitoring their cloud infrastructure, applications, and services. As we move forward, we will discuss the leading SaaS solutions for cloud monitoring.
6. Logit.io
With Logit.io, teams can create unlimited stacks for monitoring and reporting that scale with business needs to provide a unified view of infrastructure, applications, logs, and more. Logit.io allows you to monitor cloud services cost-effectively in real-time to ensure the best possible performance as well as anomaly detection. In addition, Logit.io's platform provides observability across containers and infrastructure, enabling your engineers to investigate, identify trends, and diagnose issues more quickly. For users who wish to export their logs to complementary third-party services, Logit.io also supports open data transference. This means that customers do not have to pay egress fees like many other cloud monitoring providers, nor do they have to worry about vendor lock-in. Furthermore, Logit.io offers business transaction monitoring, so organizations can understand how application performance impacts business metrics.
7. Datadog
 Datadog is a popular cloud monitoring and observability platform. It supports monitoring of cloud environments including Amazon Web Services (AWS), Microsoft Azure, and Google Cloud Platform (GCP). Among its features are powerful analytics and visualization capabilities, as well as the ability to collect metrics, traces, and logs from various sources. Users can create interactive dashboards to monitor and analyze real-time data with Datadog. In addition, it enables seamless data collection and correlation with a wide range of technologies and services.
8. New Relic
The New Relic monitoring tool provides full-stack observability for modern cloud environments. Application, infrastructure, and user experience monitoring and troubleshooting are all supported. Various sources of performance data are collected by New Relic's agents, including servers, containers, databases, and APIs. Users can monitor key metrics, track trends, and identify performance bottlenecks using real-time visualizations provided by New Relic.
9. Dynatrace
Dynatrace provides automatic and intelligent observability for cloud-native and hybrid environments using AI. Dynatrace provides real-time insights into application performance, infrastructure, and user experience using artificial intelligence and machine learning algorithms. The Dynatrace application ecosystem also provides a holistic view of the application ecosystem by automatically discovering and mapping the dependencies between different components.
10. AppDynamics
 AppDynamics is a tool for monitoring the performance and availability of applications and services. This solution provides end-to-end visibility into application transactions, infrastructure, and user experiences. AppDynamics provides code-level diagnostics, allowing users to identify and troubleshoot performance issues in application code. In order to detect anomalies, automatic baselines as well as dynamic baselines are provided.
11. Azure Monitor
The Azure Monitor SaaS monitoring solution is an inherent part of Microsoft Azure. Besides monitoring Azure resources and services, it offers extensive reporting capabilities. With Azure Monitor, you can access and analyze metric, log, and diagnostic data from a wide range of Azure services. It allows you to gather application, virtual machine, container, and database metrics and logs, enabling effective monitoring of applications hosted on Azure
12. Google Cloud Monitoring
The Google Cloud Monitoring solution is provided by the Google Cloud Platform (GCP). Using it, organizations can monitor the performance and health of their GCP resources and services. With Google Cloud Monitoring, you can monitor GCP services, virtual machines, containers, and applications using metrics, logs, and uptime checks. This solution integrates with Google Cloud Logging to provide centralized log management and analysis. Alerts can be configured in Google Cloud Monitoring to notify users when thresholds or conditions are reached. In addition, it offers integration with other Google Cloud services, such as Stackdriver Trace and Error Reporting.
13. Observu
Observu is a monitoring dashboard that collects data from your websites, API, server, and applications. The dashboard enables you to view your system state quickly, without having to view numerous pages to find each part of your operation seperately. The Observu Monitoring Agent is adaptable, enabling automatic addition of new monitors for newly introduced servers, making it well-suited for efficiently scaling server groups, for instance, on Amazon EC2. As well as this, deploying the solution is simple with configuration management tools like Opscode Chef.
14. Metricsbird
Metricsbird has not currently been launched, however, developers are able to gain early access to a preview. Metricsbird is a rapid console for Amazon CloudWatch. With this solution you can utilize the full power of Amazon CloudWatch, such as Logs Insights, Metric Streams, X-Ray traces, as well as the complete suite of monitoring resources provided by AWS. Metricsbird is SQL-compatible, enabling you to write queries, visualize data, and share findings with your team.
15. Chronosphere
Chronosphere is a cloud-native observability solution. The platform aims to empower observability teams with complete control over their observability costs. Chronosphere offers you the ability to cut through the noise to promptly locate, comprehend and remediate issues before they impact customers, all while keeping cost and value in balance. The solution also supports distributed tracing, query acceleration, and its Chronosphere Collector is open-source compatible.
16. Sensu
Sensu, supplied by Sumo Logic, is a free and open-source observability pipeline that delivers monitoring as code on any cloud. The tool requires Redis or RabbitMQ for installation and infrastructure component communications via Transport. With Sensu you can utilize auto-scaling with confidence and real-time visibility as the platfrom automates the registration and de-registration of servers, apps, services, containers, functions and connected devices.
17. Netdata Cloud
Netdata is a monitoring solution that streamlines the process of monitoring your cloud environment. The tool offers real-time data collection, visualization capabilities, proactive alerting system, and integrations with popular cloud services. Netdata also utilizes a distributed health engine to monitor the health of performance metrics. As well as this, the solution is able to utilize machine learning to predict the expected range of values in the next data collection.
If you enjoyed this article then why not read all about the leading alternatives to Splunk or open-source SIEM next?