
Resources
7 min read
Container monitoring refers to the process of monitoring and managing containers deployed within a containerization platform, such as Docker or Kubernetes. As containerization has become increasingly popular in software development and deployment, monitoring and managing containerized environments has become increasingly important.
Monitoring containers includes monitoring their resource utilization, such as CPU, memory, disk, and network usage, for optimal performance as well as checking their availability and overall health for any faults or anomalies. For engineers conducting container monitoring, log monitoring is also vital for tracking application behaviour, debugging issues, and detecting errors.
Monitoring options available for containers include open-source tools like Prometheus, Grafana, and OpenSearch, as well as commercially available monitoring platforms. With these tools, you can collect, aggregate, visualize, and analyze container metrics and logs in real-time, to gain insights into the performance and health of a containerized environment.
In this article, we will be discussing the leading tools that are best used for effective container monitoring.
Contents
Container Monitoring Solutions: Key Elements
In order to gain insight into container and application performance, various metrics are collected. There are a variety of metrics to track, such as network traffic, disk I/O, container uptime, response time, and request throughput. Container runtime metrics and metrics from the host system should both be able to be gathered by your chosen monitoring tool. Besides metrics, container monitoring captures container metadata such as names, IDs, labels, and tags. To manage and monitor containers more effectively, metadata is used to organize and filter containers.
Container monitoring tools also typically provide alerting capabilities for administrators and DevOps teams to be notified when critical events occur. Depending on predefined thresholds, errors, or patterns in metrics or logs, alerts can be triggered. A notification can be sent via email, chat platform, or integrated into an incident management system.
For your internal technical teams to understand monitoring data, it is essential that your container monitoring tool offers visualizations and dashboards. There are a variety of visualizations available, such as graphs, charts, heat maps, and summary statistics. Monitoring dashboards enables quick identification of issues and abnormalities in the containerized environment.
Last but not least, we will discuss security when it comes to container monitoring. Security monitoring for containers includes scanning the images of containers for vulnerabilities, monitoring the runtime behaviour of containers for security threats, and detecting unauthorized access. Organizations should also consider following other container security best practices such as using trusted base images, regularly updating and patching containers, enforcing least privilege access, and protecting container orchestration platforms. Monitoring containers effectively allows organizations to ensure smooth operations of containerized applications, troubleshoot problems quickly, optimize resource allocation, and maintain a safe and reliable container environment.
Logit.io
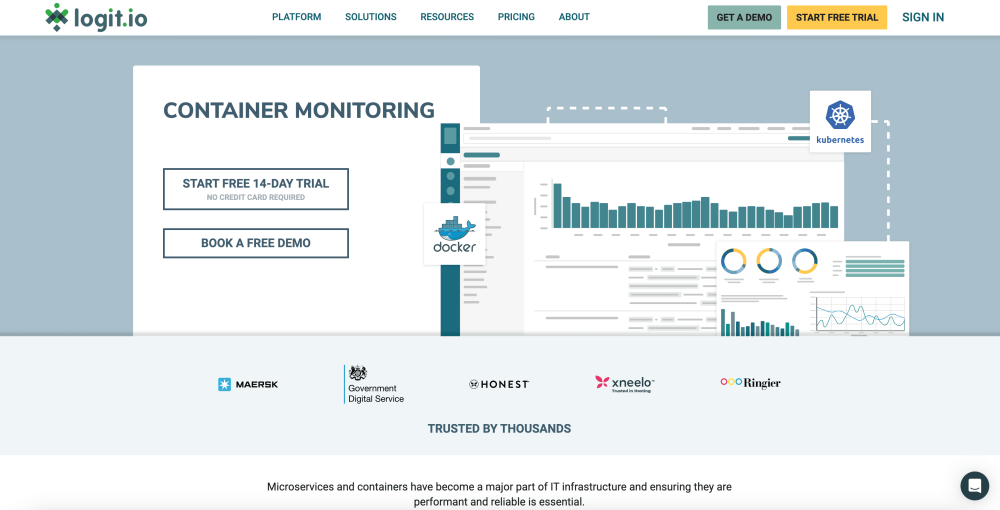 With integrations for popular container orchestration platforms such as Kubernetes and Docker, Logit.io offers a comprehensive container monitoring solution. In addition, Logit.io's platform provides observability via infrastructure monitoring as a service, allowing engineers to investigate, identify trends, and diagnose issues more quickly. Logit.io also supports open data transfer for users who wish to export their logs to third-party services. Therefore, customers are not obligated to pay egress fees like many other container monitoring providers, nor do they have to deal with vendor lock-in. Logit.io offers a free trial to new users for the first 14 days and is notably more affordable than many of the other container monitoring providers on the market.
Datadog
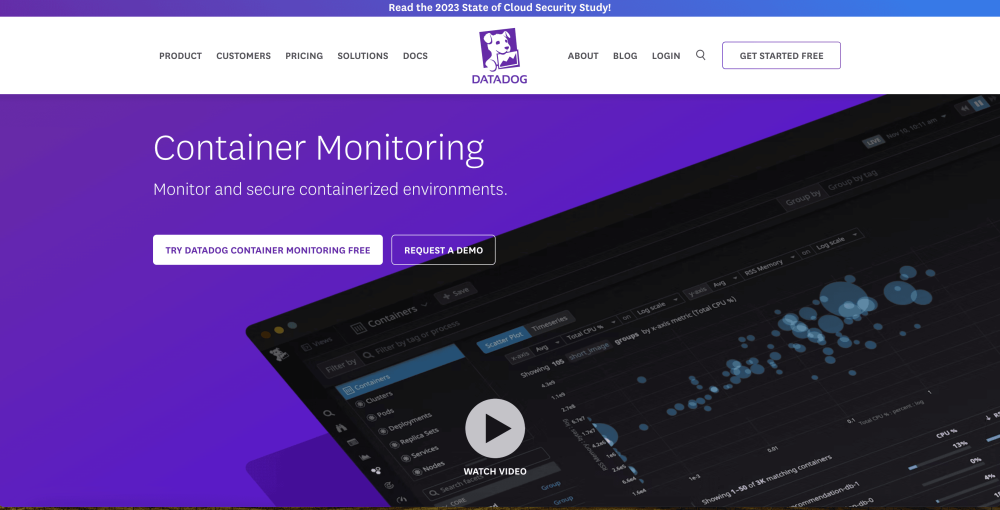 Datadog provides real-time visibility into container performance, resource utilization, and health metrics such as CPU usage, memory, network, and disk usage. Among Datadog's container monitoring features are auto-discovery, automatic correlation of metrics with applications and services, and tagging for flexible organization and filtering. Users can also drill down to specific containers or clusters using pre-built dashboards and customizable visualizations.
New Relic
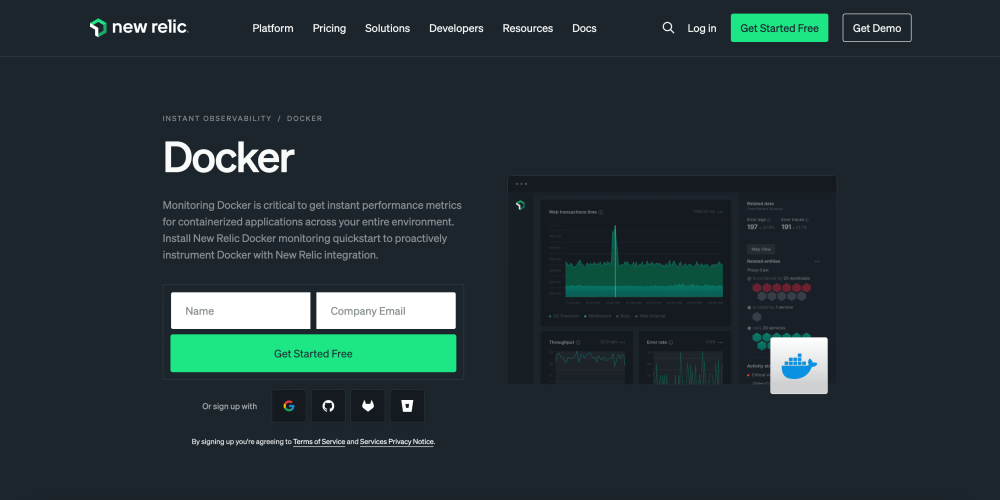 With New Relic, you can monitor containers from a cloud-based platform. Using its container monitoring solution, you can keep track of container performance, health, and resource utilization in real-time. New Relic provides container-centric dashboards and visualizations for tracking key metrics like CPU usage, memory consumption, and network traffic. As a result, bottlenecks in performance can be identified by looking at containerized application dependencies, such as services, APIs, and databases. In addition to supporting auto-discovery of containers and dynamic infrastructure changes,
Sysdig
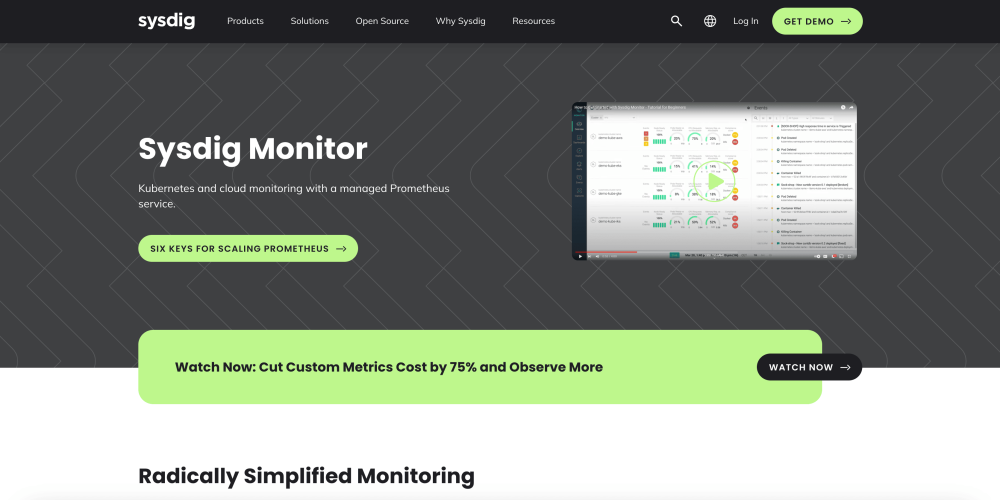 Sysdig is a SaaS container monitoring solution that provides hightened visibility into containerized environments. By providing detailed insight into container performance metrics, including CPU, memory, I/O, and network activity, Sysdig allows resource utilization and optimization to be carried out more efficiently and effectively. To ensure the security of containerized applications, the platform also offers scanning of container images and vulnerability management tools. For efficient troubleshooting and incident response, Sysdig's monitoring platform includes dynamic topology maps, anomaly detection, and policy-based alerting.
Dynatrace
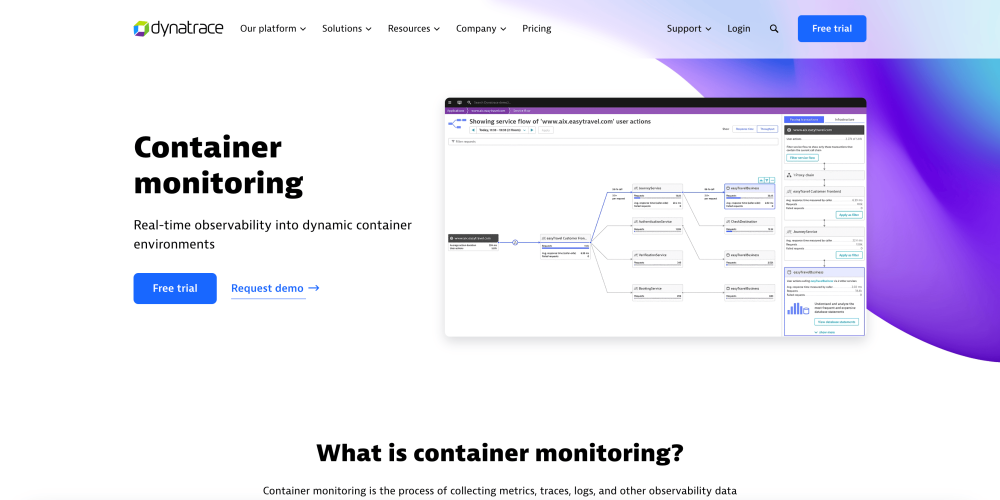 The Dynatrace observability platform offers container monitoring as part of its AI-powered monitoring platform. To identify performance issues and optimize containerized environments, it uses automated anomaly detection and artificial intelligence. For a holistic view of the containerized ecosystem, Dynatrace's platform includes features such as distributed tracing, real-time user monitoring, and cloud infrastructure monitoring. In addition, it offers auto-scaling recommendations, continuous delivery insights, and deep application code-level diagnostics.
AppDynamics
 AppDynamics, now a Cisco company, offers container monitoring as part of its performance monitoring platform. Among the features of the platform are code-level diagnostics, performance baselines, and business transaction monitoring. To facilitate proactive monitoring and troubleshooting in containerized environments, it provides real-time dashboards, alerts, and automated anomaly detection. With AppDynamics, you can integrate applications into popular container orchestration systems and map dynamically in dynamic container environments.
Alluvio
 Alluvio by Riverbeds application performance monitoring solution supports cloud-native apps, allowing you to attain application visibility into containers and microservices. Their lighweight, non-intrusive instrumeentation automatically discovers application components, and their relationships. The solution provides full operational visibility into containers running on modern cloud-based application infrastructure like Docker and Kubernetees.
OpsRamp
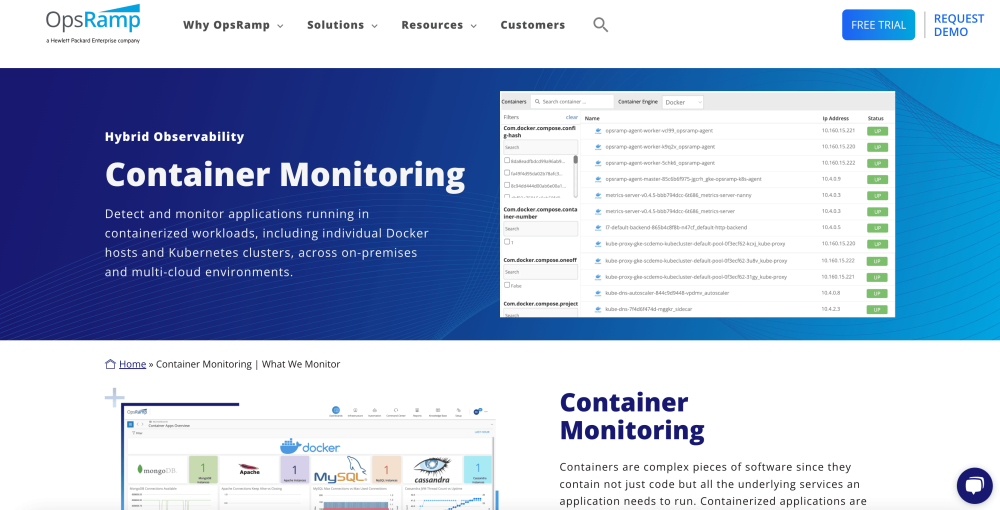 OpsRamp, a Hewlett Packard Enterprise company, offers a container monitoring solution via their hybrid observability. With OpsRamp you can identify and monitor applications operating in containerized workloads, including individual Docker hosts and Kubernetes clusters, via on-premises and multi-cloud environments. With this solution you can prevent outages by identifying issues before a container goes into production, locate issues across clusters of different containers, guarantee that containers run the same in different cloud environments.
Circonus
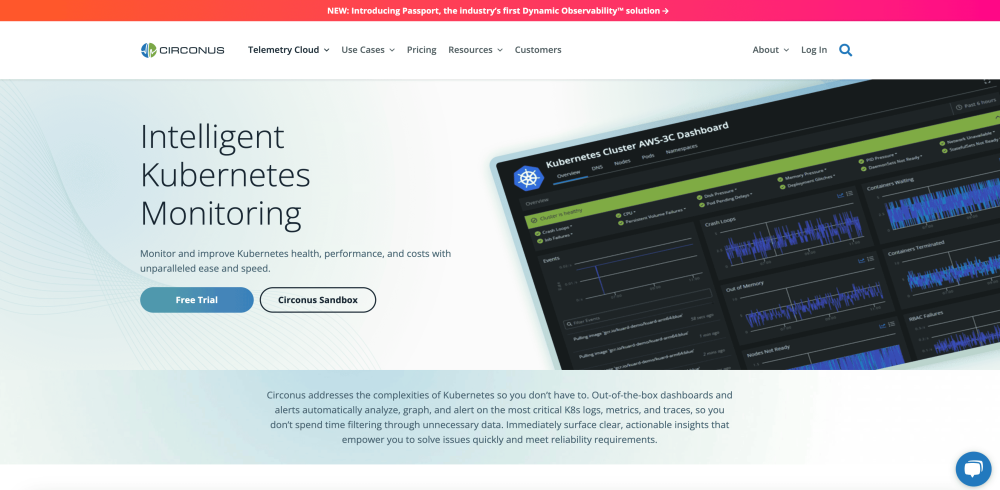 Circonus supplies an intelligent Kubernetes monitoring solution. Circonus aims to addresses the complexities of Kubernetes so you don’t have to. They provide out-of-the-box dashboards and alerts to automatically examine, graph, and alert on the most vital K8s logs, metrics, and traces, so you don’t spend time filtering through unnecessary data. Their real-time operational and health dashboards visualize node and pod resource data for simple to understand insights. As well as this, the solution offers unlimited scalabilty to guarantee the colllection of the large volume of high-cardinality data.
Darklens
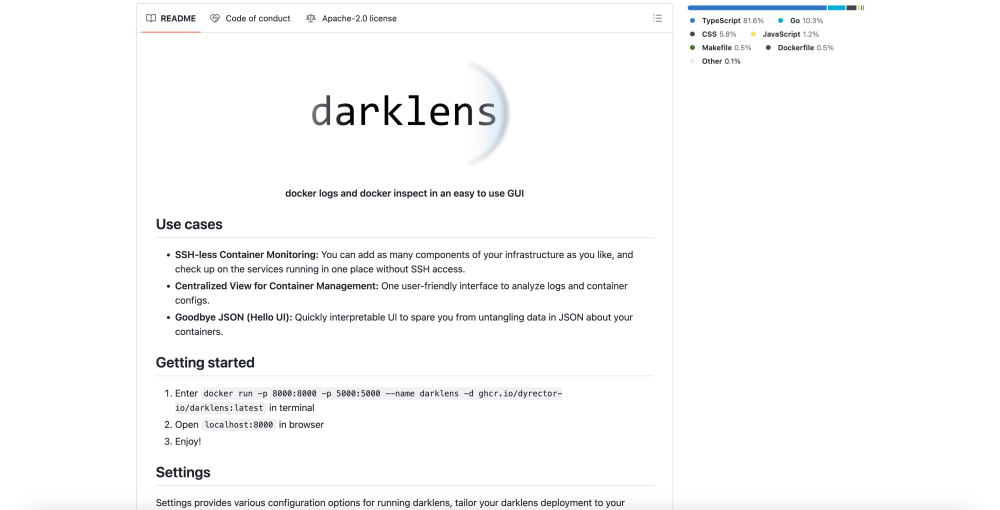 Darklens is a lightweight container viewer that enables you to monitor docker logs and docker inspect in an easy to use GUI. With this solution you can add as many components of your infrastructure as you wish, and check up on the services running in one place without SSH access. Also, the centralized user-friendly interface makes it simple to analyze logs and container configurations. As well as this, the UI is quickly interpretable to relieve you from untangling your data relating to your containers in JSON.
KubeSphere
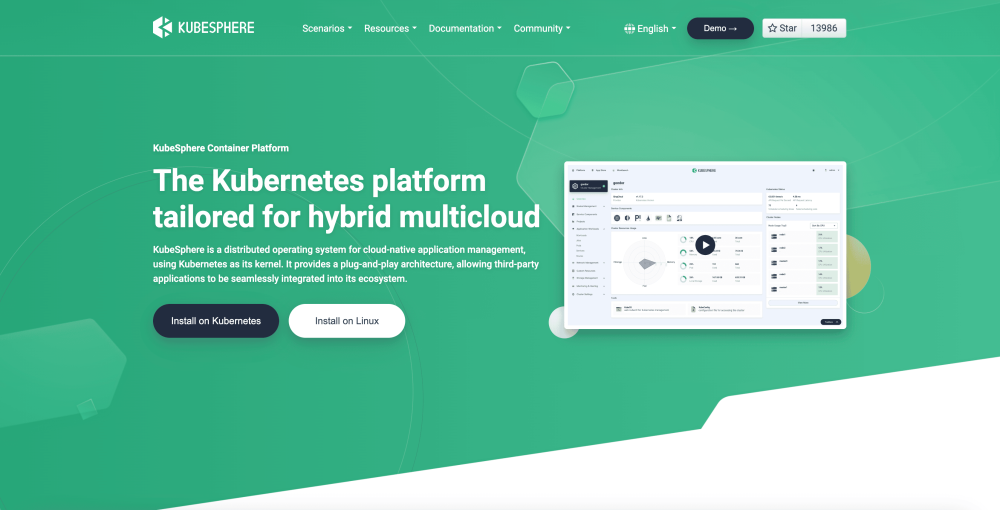 KubeSphere offers a container platform, a distributed operating system for cloud-native application management, utilizing Kubernetes as its kernel. It supplies a developer-friendly wizard web UI, assisiting enterprises in building out a more robust and feature-rich Kubernetes platform. The platform is CNCF-certified and 100% open-source, built and improved by the community. The solution is particularly simple to run and can be delpoyed on an existing cluster or Linux machines. It possess' a modular and plugable architecture enabling to select your features according to your business needs.
SignalFx
Now part of Splunk, SignalFx is a cloud-native monitoring platform that supports container monitoring. Monitoring, dashboards, and alerts are provided for monitoring containerized applications and infrastructure. Suitable for containerized environments, SignalFx monitors distributed microservices architectures. A number of features are included within the platform, including automatic discovery of containers, dynamic service dependency mapping, and adaptive analytics for containers and related infrastructure components.
These leading SaaS container monitoring tools provide organizations with robust capabilities to monitor and manage containerized environments, ensuring optimal performance, security, and scalability.
If you enjoyed this article then why not read Datadog competitors or Kubectl cheat sheet next?