Resources
6 min read
ELK, which stands for Elasticsearch, Logstash, and Kibana, is a popular open-source software stack used for log and data analytics. The ELK stack offers a powerful platform for centralized logging, monitoring, and analytics and excels at presenting data with dashboards for effective analysis.
ELK dashboards are visual representations of data and analytics designed using the Kibana component of the ELK stack. These interactive dashboards offer users an extensive view of their data, allowing them to track, analyze, and attain insights into multiple aspects of their systems and applications. Kibana enables users to design a substantial range of dashboards. So, to help you see the full capabilities of ELK (and by extension Kibana) dashboards, in this article, we will highlight the leading examples.
Contents
- Postfix
- Elasticsearch Performance Troubleshooting Kit
- Resource Optimization
- Ingest Pipeline Monitoring
- Log Analysis and Analytics
- Google Cloud Monitoring
- Crawler
- Threat Detection
- Osquery Performance
- Watcher History
- Observability
- Detection Engine Alerts Overview
- RUM Extension
- Elastic Stack Monitoring
- Elastic Cloud Monitoring
Postfix
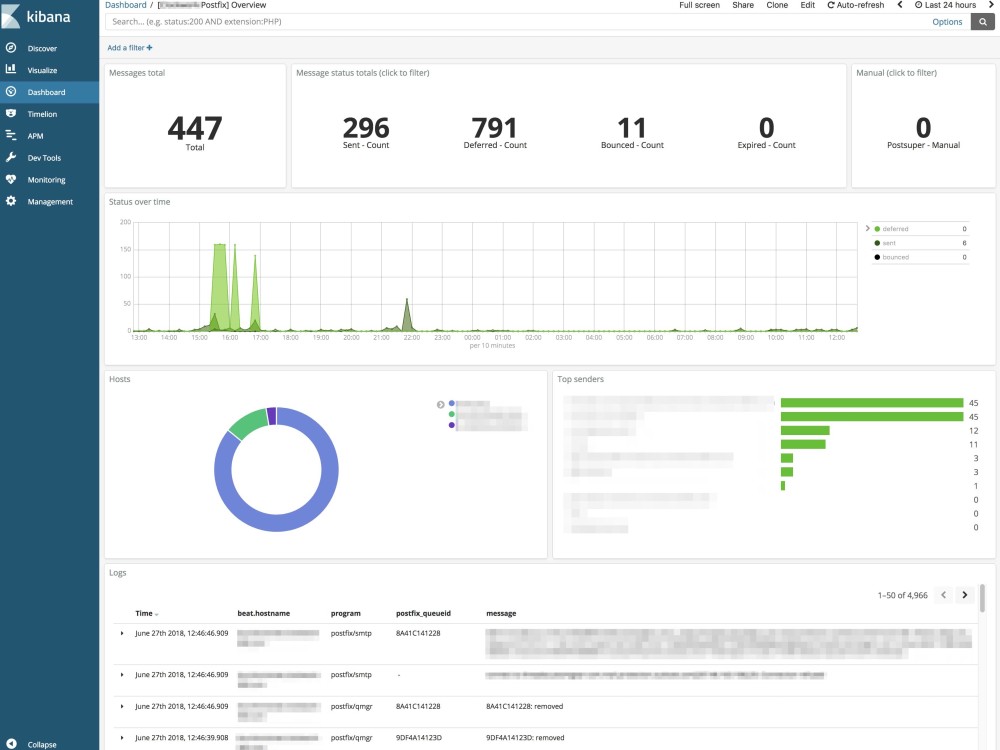
The first Kibana dashboard included in our list of the leading ELK dashboards is Postfix. With this dashboard, you can visualize a Postfix dashboard based on data stored in Elasticsearch. Two import methods are supported, Kibana Management UI and Kibana Dashboard API. This dashboard allows you to view a range of metrics including total messages, status over time, and hosts.
Elasticsearch Performance Troubleshooting Kit
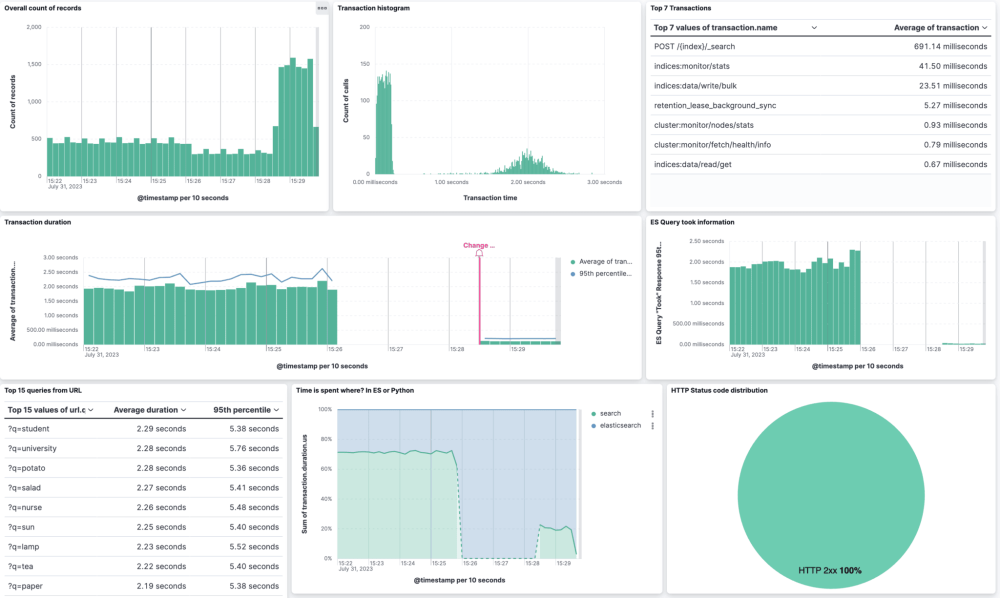
This ELK dashboard example helps you optimize the speed and efficiency of your Elasticsearch queries with the Elasticsearch Performance Troubleshooting Kit. The purpose of this toolkit is to assist in recognizing and addressing the underlying factors contributing to slow query performance within Elasticsearch. Through a thorough examination of query execution, this kit empowers you to isolate performance limitations and apply impactful solutions. With this dashboard, you can view metrics like transaction duration and HTTP status code distribution.
Resource Optimization
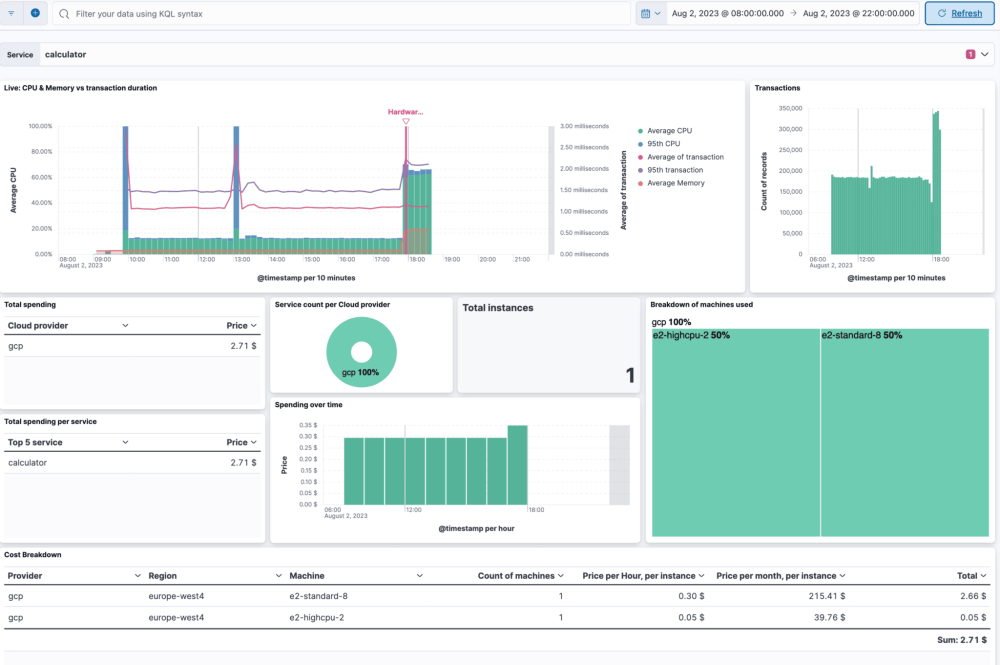
This dashboard integrates Application Performance Monitoring (APM) metadata with cloud resource metrics to offer a holistic perspective on both the performance and cost of your cloud infrastructure. Using the Elastic Resource Optimization Dashboard enables you to enhance your cloud operations, ensure efficient resource utilization, and synchronize operational metrics with business objectives. This leading ELK dashboard presents a range of metrics including service count per cloud provider, total spending, and breakdown of machines used.
Ingest Pipeline Monitoring
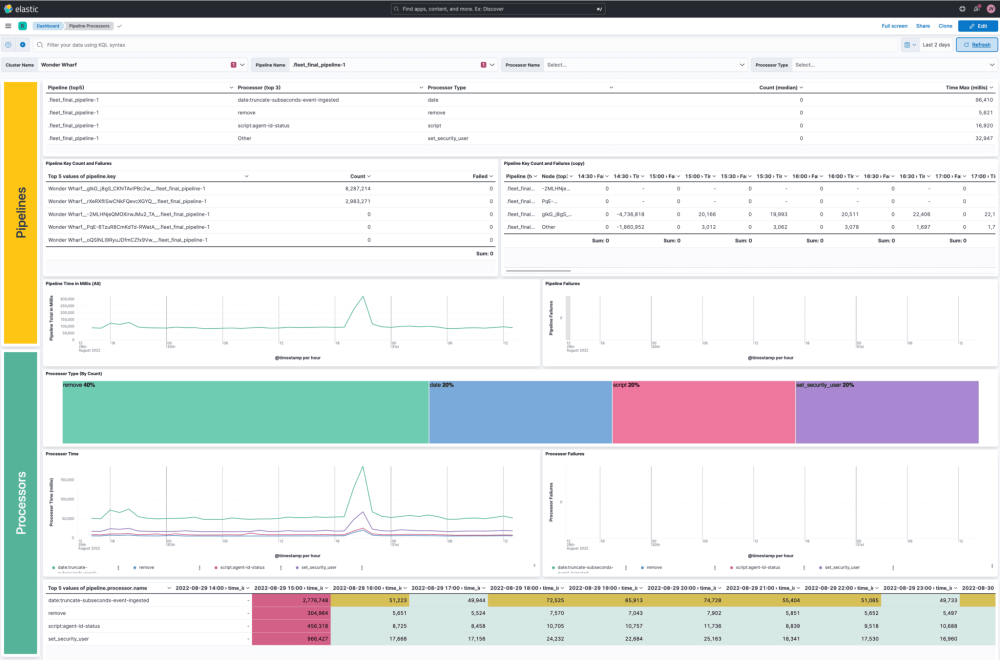
The next leading ELK dashboard presents data relating to ingest pipeline monitoring. Ingest pipelines allow you to conduct standard data transformations prior to indexing. Monitoring these pipelines is vital to guarantee the smooth operation of your Elastic Observability use case. With this dashboard, you can view numerous metrics such as pipeline failures, processor type, and processor time.
Log Analysis and Analytics
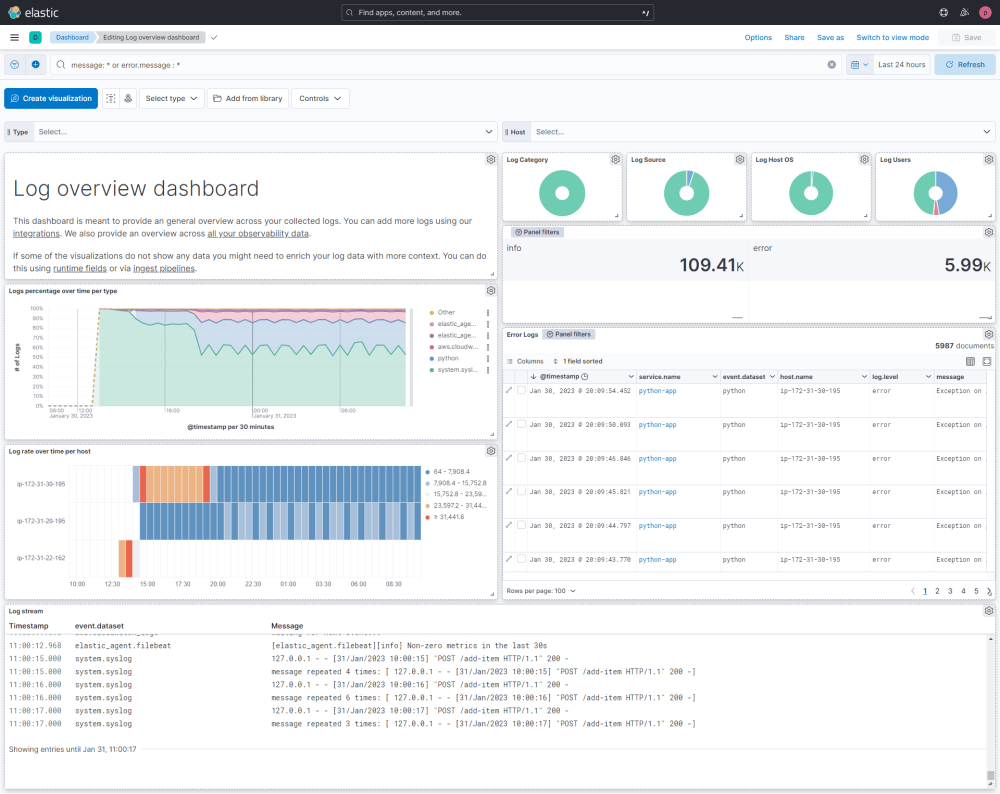
Another leading ELK dashboard that highlights the versatility of these dashboards is log analysis and analytics. This dashboard serves as a broad overview of your logs, offering a consolidated perspective across all aspects. Logs within Elasticsearch can be gathered through Filebeat, Elastic Agent, or directly via Logstash and other data streaming tools. For this the log analysis and analytics dashboard you can view metrics like log source, log stream, and log users.
Google Cloud Monitoring
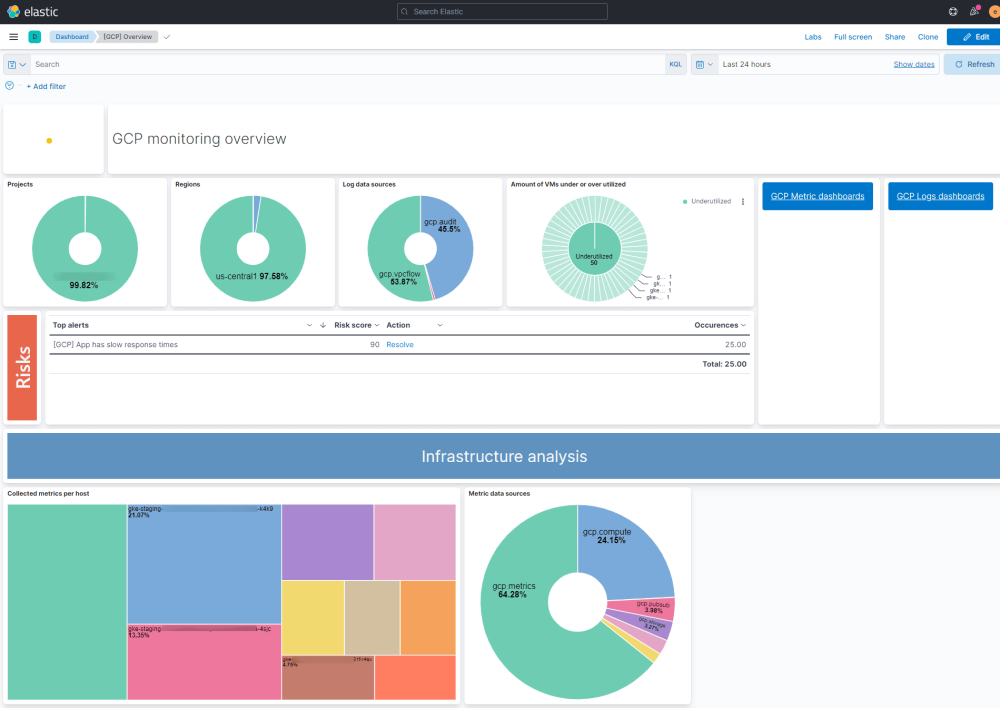
This dashboard utilizes Elastic integrations to pull and present data relating to Google Cloud to offer observability. Monitoring Google Cloud with Elastic is a commonly adopted use case, especially when combined with monitoring other cloud providers. The advantage lies in accessing all essential monitoring data via a single dashboard, removing the need for numerous tools. This leading ELK dashboard highlights metrics such as projects, log data sources, and collected metrics per host.
Crawler
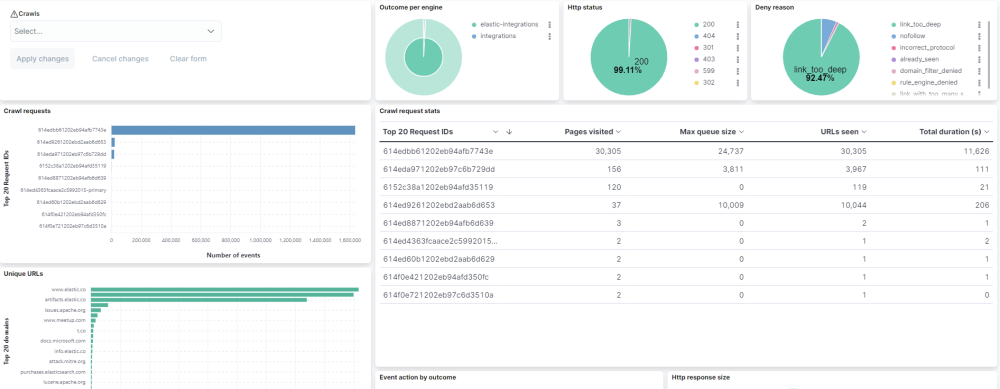
This is an example of a Kibana dashboard that presents the results of the crawler from Elastic Enterprise Search. The crawler job may require some time to complete and it executes multiple tasks behind the scenes. It stores all details and logs in an internal index. With this leading ELK dashboard you can visualize a range of metrics, including but not limited to outcome per engine, HTTP status, and crawl requests.
Threat Detection
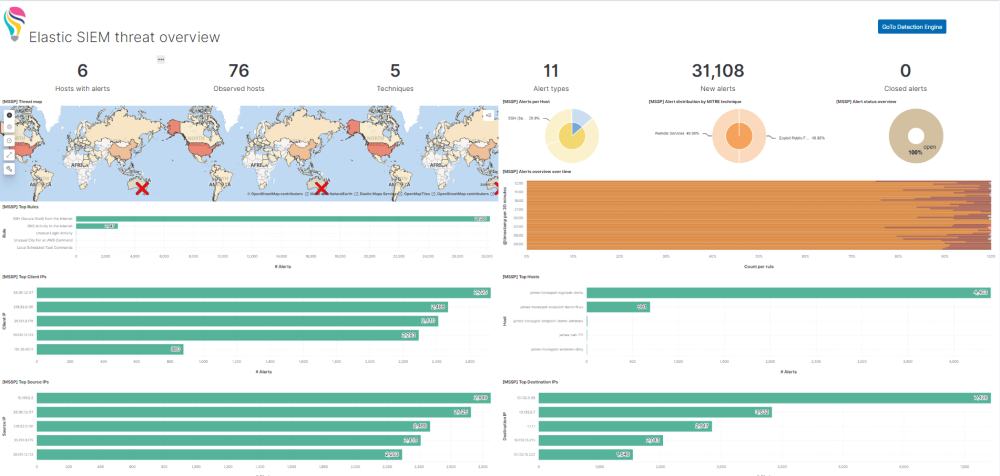
Continuing with our list of the leading ELK dashboards the next example we’ve included is a threat detection dashboard. For this example, the results of the Elastic SIEM detection engine are displayed. The Elastic SIEM detection engine offers a useful method for analyzing all cybersecurity-related data stored within your Elastic Security setup. It can be utilized for both SIEM and Elastic Endpoint data analysis purposes. This dashboard presents metrics such as observed hosts, top source IPs, and new alerts.
Osquery Performance
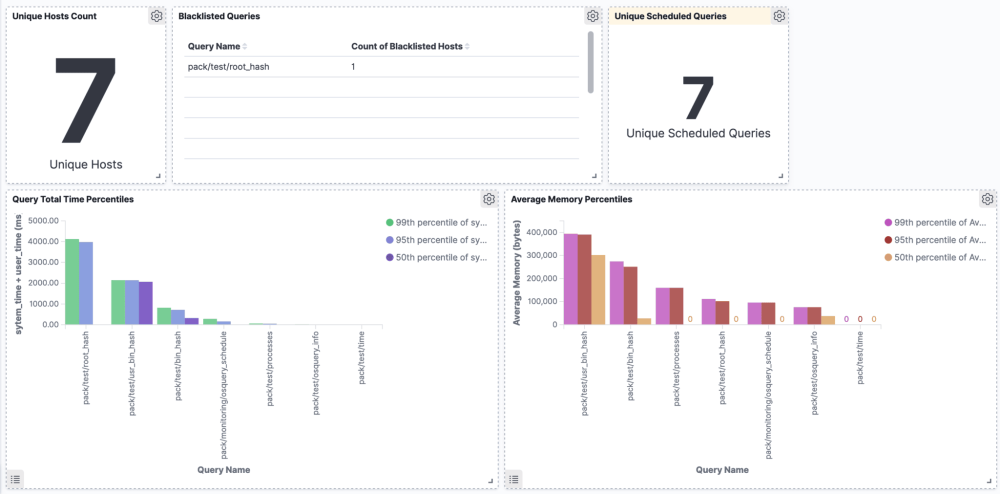
This Kibana dashboard offers visualizations of the performance metrics of Osquery. Osquery is an operating system instrumentation framework for Windows, OS X (macOS), and Linux. It is recommended that to pull Osquery data into Elasticsearch you should utilize the Filebeat module. This dashboard presents a variety of metrics including but not limited to unique host count, blacklisted queries, and average memory percentiles.
Watcher History
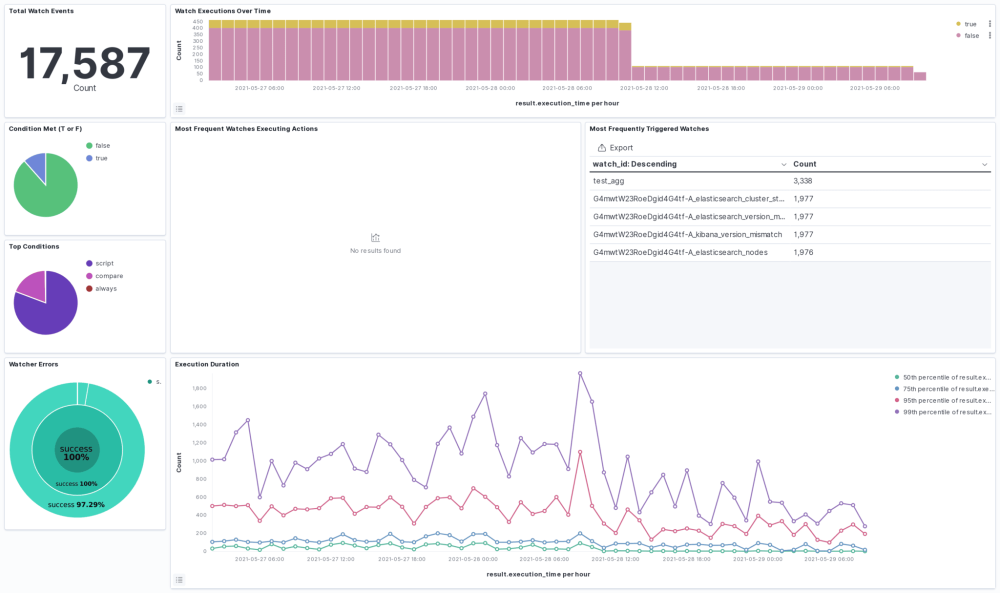
The Watcher History Dashboard displays the complete history of configured watcher jobs within your Elasticsearch deployment. It operates by extracting data from the system watcher history index, which is automatically generated when utilizing watchers. This dashboard visualizes numerous metrics including but not limited to total watch events, watch executions over time, and top conditions.
Observability
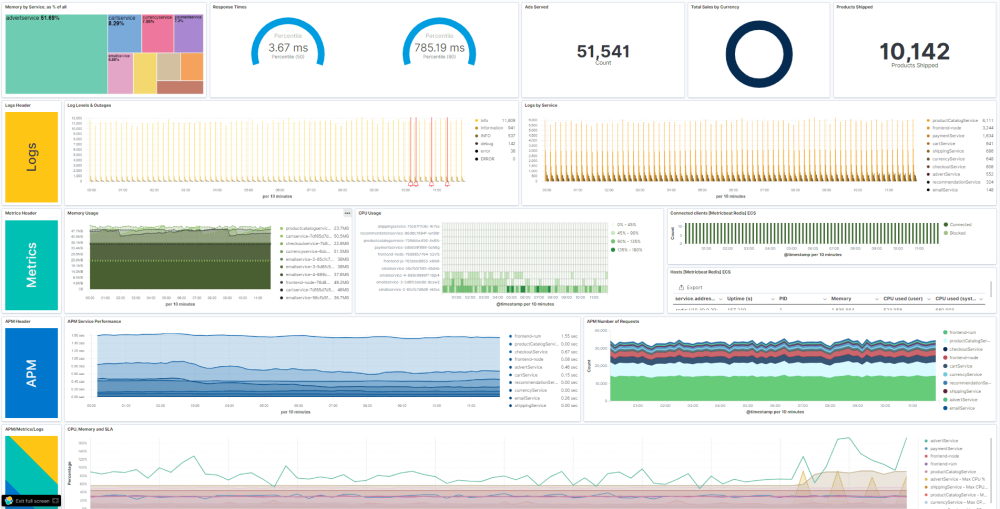
This example pulls together logs, metrics, APM data, uptime information, and business KPIs into a single dashboard. This is a good method to attain a high-level view of all pillars of Observability. This dashboard presents an extensive variety of metrics such as response times, products shipped, and log levels and outages.
Detection Engine Alerts Overview
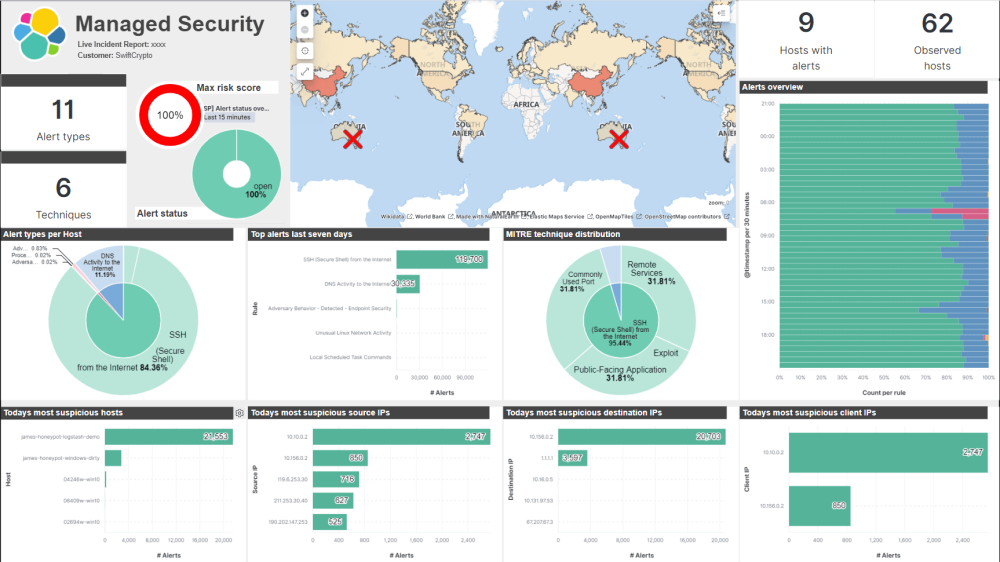
The next example in our list is the detection engine alerts overview dashboard. It consolidates data from the Detection Engine included in Elastic Security. The Detection Engine within Elastic Security detects suspicious behavior using the MITRE ATTACK Framework. It is a particularly effective tool for highlighting security threats within data gathered from the Elastic Stack. This dashboard example highlights metrics like alert types, observed hosts, and max risk score.
RUM Extension
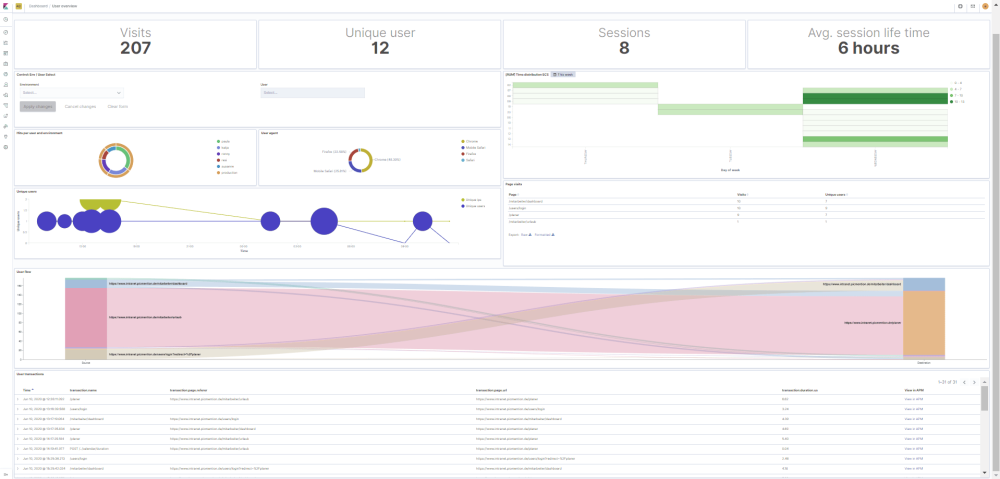
This dashboard aims to improve your visibility into your RUM data gathered by the real user monitoring agent of Elastic. This dashboard offers comprehensive user metrics and insights into user journeys with little manual intervention required. Utilize this real user monitoring Kibana dashboard to attain a deeper comprehension of user activities within your web application. With this ELK dashboard example you can view metrics like visits, unique users, and sessions.
Elastic Stack Monitoring
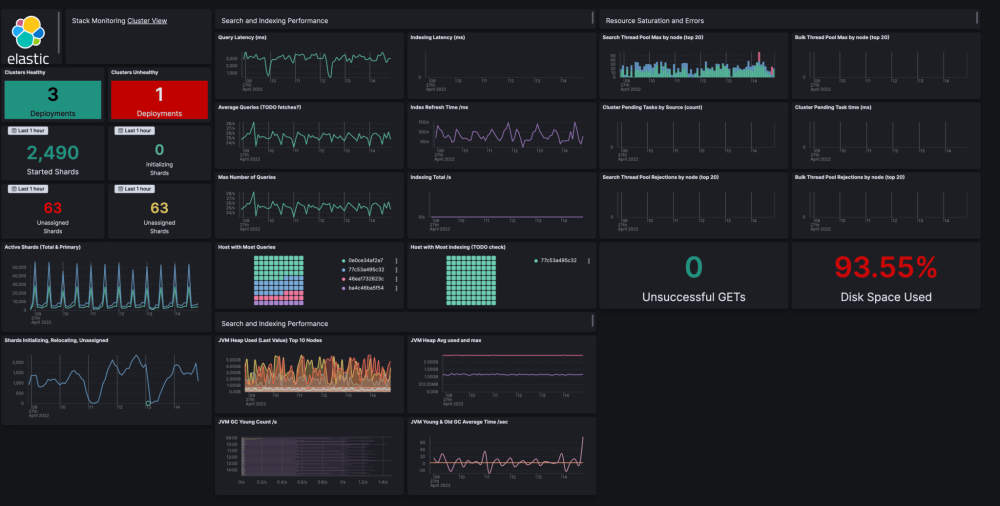
The penultimate dashboard example included in our article is this ELK stack monitoring example. Leveraging the built-in monitoring application can be quite advantageous. However, if a user already maintains a separate cluster to monitor the production cluster, it's logical to utilize all available capabilities for that purpose as well. This is why this Elasticsearch Monitoring dashboard has been created as an extension to the usual functionality. This dashboard enables you to view various metrics such as indexing latency, hosts with the most queries, and active shards.
Elastic Cloud Monitoring
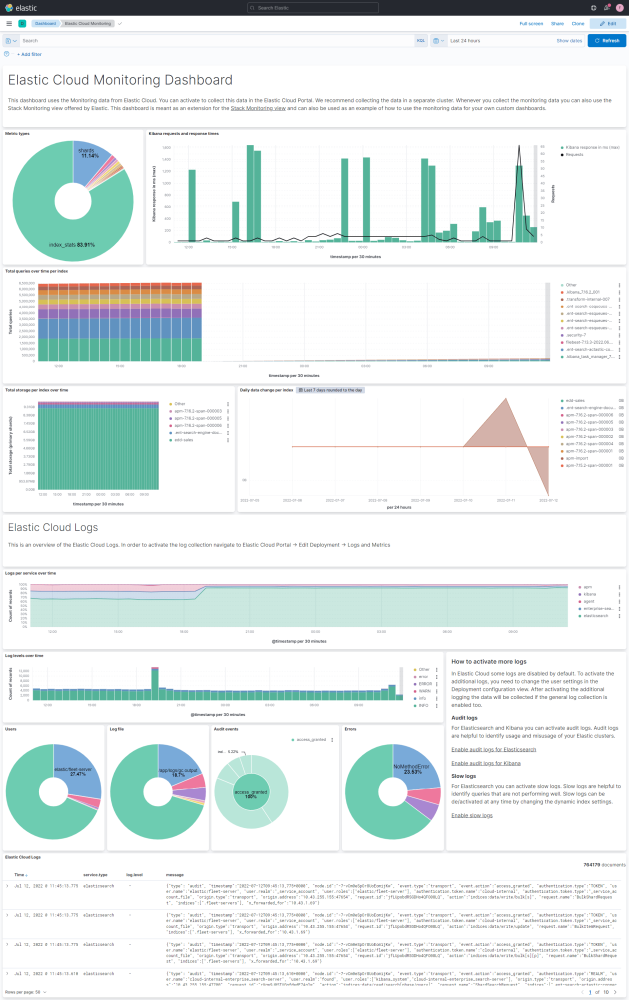
The final dashboard in this list is the Elastic Cloud monitoring example. It utilizes the monitoring data that could be collected for every cluster that is operating in Elastic Cloud. This dashboard primarily focuses on analyzing logs and provides a basic set of metrics. This Elastic Cloud dashboard provides a range of metrics including but not limited to total queries over time per index, logs per service over time, and the number of users.
Want to get started with creating your own ELK dashboards? Then why not learn more about how ELK as a Service can help your organisation grow?
If you've enjoyed this article why not read The Top 25 Kibana Dashboard Examples or OpenSearch Dashboards vs Kibana next?
