ELK, Getting Started, Resources
12 min read
Last updated:
This comprehensive guide to the best Kibana dashboard examples will demonstrate some of the most innovative and effective ways that Kibana can be used within your organization. The powerful visualization capability in Kibana helps teams centralize and make sense of data and metrics from every corner of the organization, turning raw information into actionable insights.
Whether you're a technical lead who is monitoring system health and performance, a business intelligence specialist integrating sales data and financial performance indicators, or a marketer tracking campaign effectiveness and website traffic patterns, Kibana allows you to do it all.
It also supports operations teams in monitoring supply chain efficiency and compliance, HR professionals in analyzing employee performance and recruitment metrics, and finance teams in tracking financial performance and budget adherence.
Kibana's user-friendly interface, powerful visualization options, and perfect integration with Elasticsearch make it one of the best tools for the construction of highly customizable dashboards. This guide will go a long way in showing you how this leading data visualization tool can unlock the full power of your data.
Contents
- What is a Kibana dashboard?
- How can Kibana dashboards help in responding to urgent issues, degradations, and outages?
- Hosted Kibana
- 1. Tracking The Number Of COVID-19 Cases
- 2. SIEM Dashboard
- 3. Measuring Votes By Region
- 4. Monitoring Website Uptime
- 5. Visualising IMDB Movie Data
- 6. Tracking Twitter Tweets + Word Cloud Creation
- 7. Linux Logs Monitoring
- 8. Measuring Sales Performance For An eCommerce Retailer
- 9. Understanding User Behaviour
- 10. Automated Test Tracking
- 11. Tracking Sign-Ups By Referrer Visualisation
- 12. Centralized Analytics for COBOL Microservices
- 13. Data Streaming Dashboard
- 14. Kubernetes Monitoring
- 15. Airline Flight Metrics Dashboard
- 16. Visitors by State & Country
- 17. Jenkins Application Monitoring
- 18. Saving The Planet By Allocating Resources More Efficiently
- 19. Vulnerability Scanning
- 20. Recovering Data For Over 6000 Users
- 21. Server Monitoring
- 22. Firewall Monitoring Dashboard
- 23. Netflow Traffic Dashboard
- 24. SSH Security Dashboard
- 25. EXIF Data Dashboard
What is a Kibana dashboard?
A Kibana dashboard provides a way of relaying data in the form of visualisations and saved searches. Kibana provides a wealth of options for those that want to display data in a wide variety of formats including line and pie charts, heat maps, data tables, line graphs, gauges, coordinate maps and tag clouds.
To show you just what Kibana dashboards can be used for we’ve collected the top twenty four Kibana visualisation examples you can get started with today!
How can Kibana dashboards help in responding to urgent issues, degradations, and outages?
Kibana facilitates rapid response via it's integrated IT workflows. By linking dashboard analytics directly to your IT ticketing systems, Kibana enables users with the ability to address urgent issues without ever needing to leave the monitoring platform itself. This allows users to act upon insights almost instantly, and during a system outage or degradation, this is of prime importance.
Kibana dashboards provide not only full monitoring capabilities but also integrated response features to help you to solve issues quickly and efficiently. This makes the solution very valuable in the maintenance of system integrity and in keeping downtime to a minimum.
Hosted Kibana
Creating a dashboard in Kibana is particularly simple, but the initial configuration of Kibana can be complex. However, this complexity can be completely removed by opting for a hosted solution such as hosted Kibana from Logit.io. With our solution, you gain all the best features of Kibana but without all the time-consuming and challenging configuration and maintenance, as this will be handled by us. If you’re interested in finding out more about hosted Kibana from Logit.io, don’t hesitate to reach out or begin exploring the platform for yourself with a 14-day free trial.
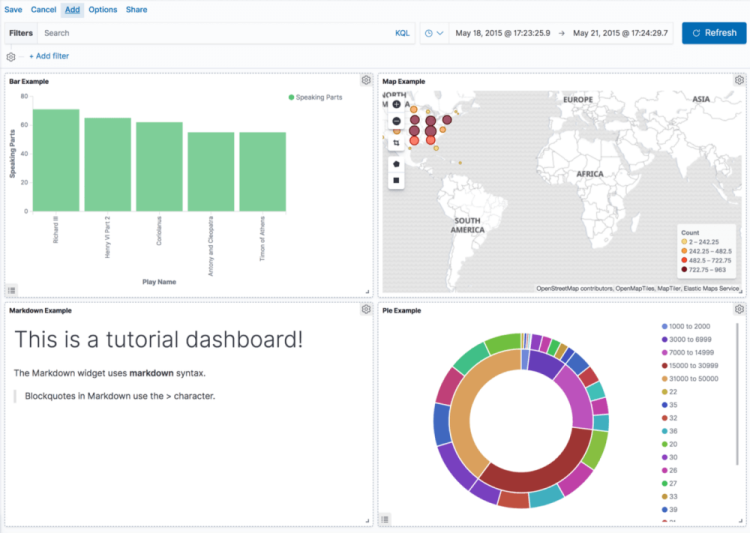
We’ve outlined an article in our documentation that outlines how to create a dashboard in Kibana. The process is particularly simple, just follow the steps listed in the guide and begin visualizing your data in stunning dashboards.
Unlock complete visibility with hosted ELK, Grafana, and Prometheus-backed Observability
Start Free Trial1. Tracking The Number Of COVID-19 Cases
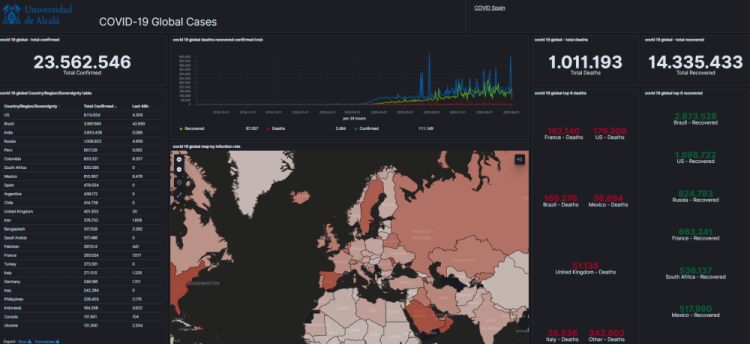 Credit: @CarlosCilleruelo
Easily the biggest news of last year was the global COVID-19 pandemic that swept across the globe.
With so many cases occurring each day, many notable organisations wished to be able to report internally on the cases by country alongside other key metrics (such as deaths overall and the total number of those that had recovered so far).
This dashboard uses ELK (Elasticsearch, Logstash & Kibana) as an alternative to ArcGIS to create a real time pandemic map.
This pandemic map displays cases by country alongside updated metrics captured in the previous 48 hours.
This dashboard also shows the top countries for recovered cases as well as the leading countries by the number of deaths. The world map is also configured to indicate the infection rate by the concentration of colour.
2. SIEM Dashboard
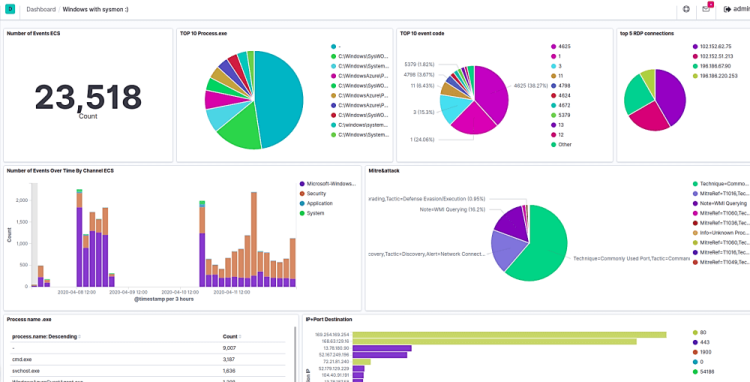 Credit: @Ibrahim.Ayadhi
Security analysts can use this Kibana example dashboard to start to implement SIEM as a Service to protect their organisation’s security and improve observability.
This dashboard can be configured to show what processes are currently running by name, the top processes by the event logs being generated as well as the event codes associated with the most common logs.
Unlock complete visibility with hosted ELK, Grafana, and Prometheus-backed Observability
Start Free Trial3. Measuring Votes By Region
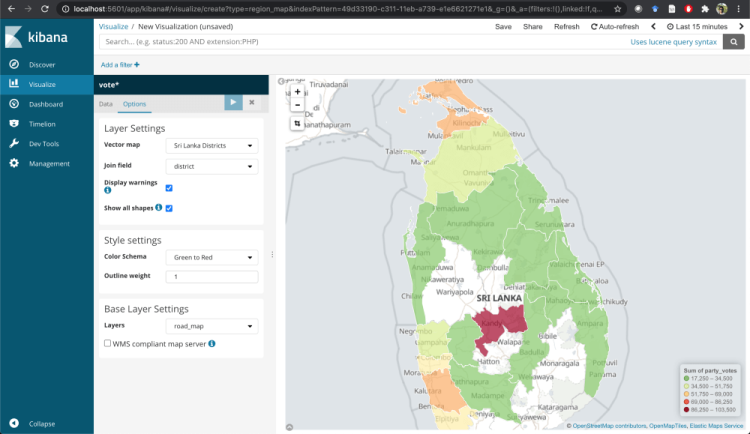 Credit: @itseranga
When the creator of this dashboard wished to monitor which districts of his country are contributing the most votes, they turned to Kibana & the ELK Stack to visualise these metrics using the map visualisation format to display colour coding to reflect voter density.
This visualisation type could easily be used to track these same metrics in other countries across the globe. In keeping with the spirit of open source, the original contributor of this dashboard welcomes collaboration on his original Gitlab repo.
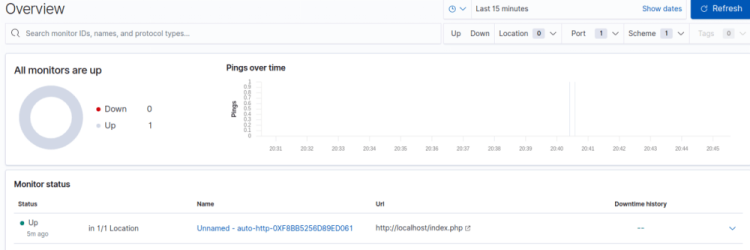
4. Monitoring Website Uptime
 Credit: @AnuragSrivastava
For organisations looking to reduce risk and minimise downtime, monitoring the uptime of your website is essential.
Too many websites still don’t have reliable uptime monitoring and may be in the process of comparing several solutions.
Thankfully Kibana makes affordable uptime monitoring possible for everyone in this tutorial on creating this highly useful alerting dashboard.
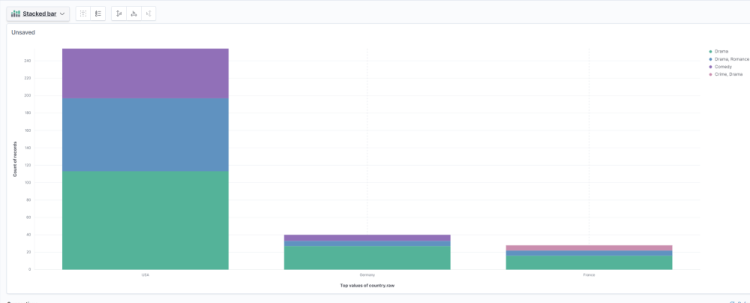
5. Visualising IMDB Movie Data
 Credit: @AnnapooraniK
The ELK Stack can also be used for more casual purposes outside of technical analysis in the workplace, as this dashboard comparing IMDB movie data shows.
This dashboard uses Kibana alongside Virtualbox and Ubuntu to access and import the IMDB dataset for parsing and processing within Logstash.
From here it is easy to discover who are the top three directors per year, which countries distribute the most movies and which genres are the most popular overall.
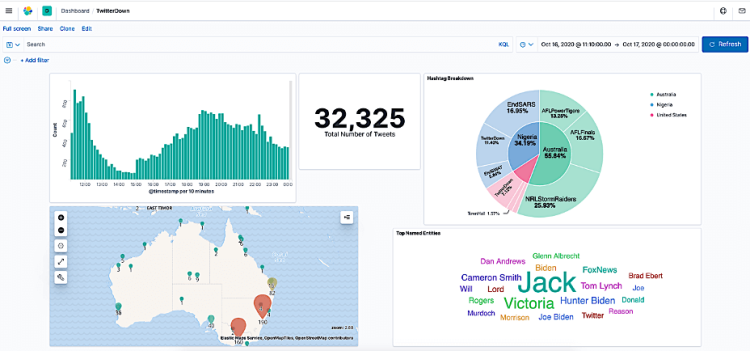
6. Tracking Twitter Tweets + Word Cloud Creation
 Credit: @ArezouSoltaniPanah
If you’ve discovered much like myself that online tools for generating Twitter word clouds can be lacking in their reliability and formatting then you’ll find this dashboard for displaying the most commonly mentioned keywords indispensable.
This Kibana based social media dashboard also displays the total number of tweets and allows you to choose from time graphs and time-series visualisation to display the number of tweets being published by the hour as well as a geographic map highlighting the most active regions tweets are being sent from.
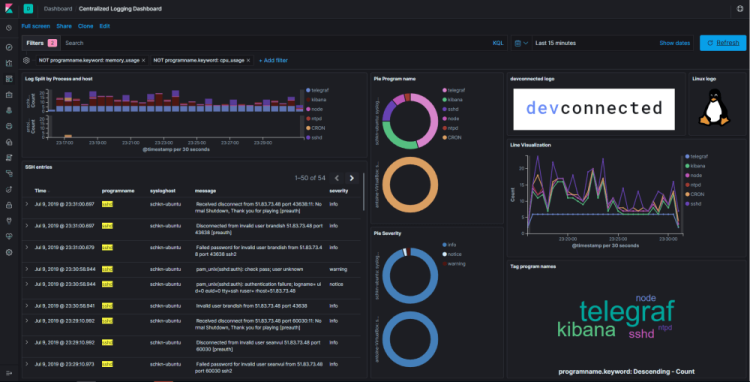
7. Linux Logs Monitoring
 Credit: @AntoineSolnichkin
This dashboard created to measure Linux log activity is vital for improving your awareness of network infrastructure to implement comprehensive infrastructure monitoring for your organisation.
Credit: @AntoineSolnichkin
This dashboard created to measure Linux log activity is vital for improving your awareness of network infrastructure to implement comprehensive infrastructure monitoring for your organisation.
Visualisations can be used to make the following Linux Logs more human-readable so that you and your wider team can make actionable changes seamlessly: generic log messages, authentication logs, rebooting data, failed login attempts as well as MySQL related logs.
8. Measuring Sales Performance For An eCommerce Retailer
 Credit: @KidongLee
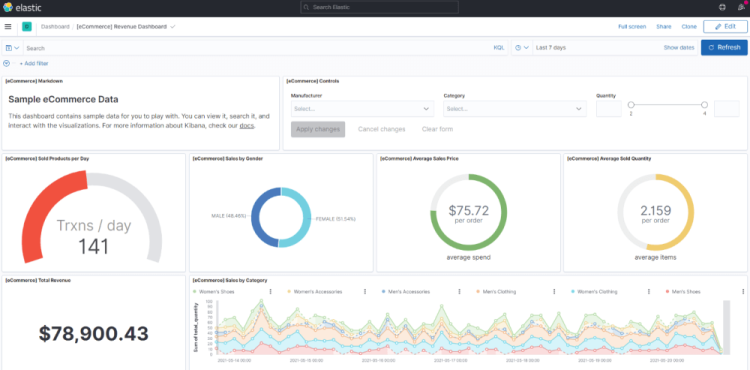
Every eCommerce store owner knows how vital it is to make sure that they have full visibility of which products are driving the most success for their store.
The Kibana dashboard shown here can be configured to display how many products are sold per day, product sales split by Gender of the purchaser, average sale price and quantity per order as well as which categories are performing most successfully.
9. Understanding User Behaviour
 Credit: @RuanBekker
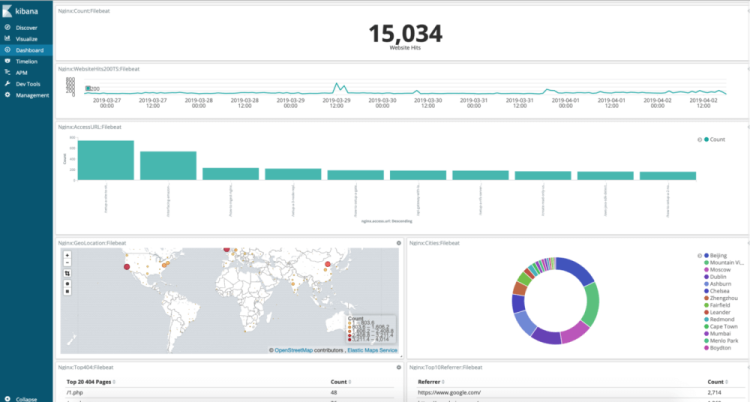
If you are in charge of measuring digital content performance for your organisation then you’ll need a reporting dashboard that measures the activity being taken by users on your website.
You’ll also need visibility of your top traffic referrers, 404 errors and the most popular pages being viewed.
This dashboard supports the display of all of these metrics and more and like all of the other examples in this list can be customised as flexibly as you need to display the metrics that matter most to you.
10. Automated Test Tracking
 Credit: @MesutGunes
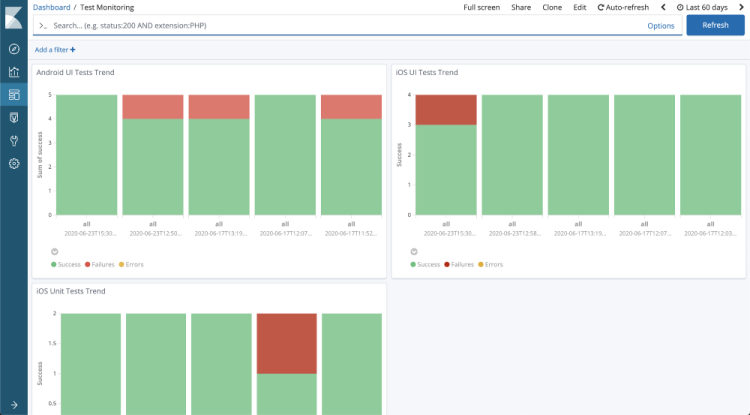
As a software developer running unit tests, you’ll know how vital is it to measure if they ran successfully.
A monitoring system for displaying the logs created from running automated tasks and unit tests uses the data being created by your system to make it far easier to monitor, debug and report on why tests aren't working as expected.
11. Tracking Sign-Ups By Referrer Visualisation
 Credit: @AmitRathi
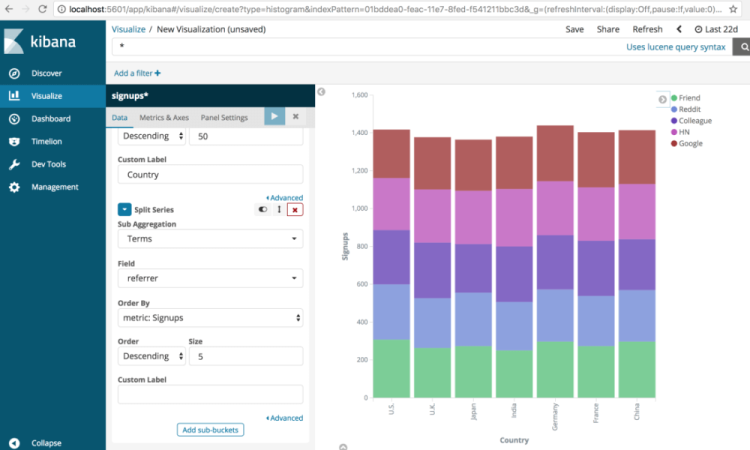
This Kibana example can be used alongside affiliate marketing software or general marketing dashboard as this visualisation provides valuable insights to the user by showing the traffic sources behind an increase in successful sign-ups.
12. Centralized Analytics for COBOL Microservices
 Credit: @OlegKunitsyn
Even though COBOL is one of the oldest programming languages around, this still doesn’t mean that it has died out of usage, on the contrary, roles requiring programmers with COBOL as part of their skillset experienced a massive surge in demand in 2020.
These new hires were especially required by Government agencies whose legacy systems were crashing at the time COVID-19 first hit.
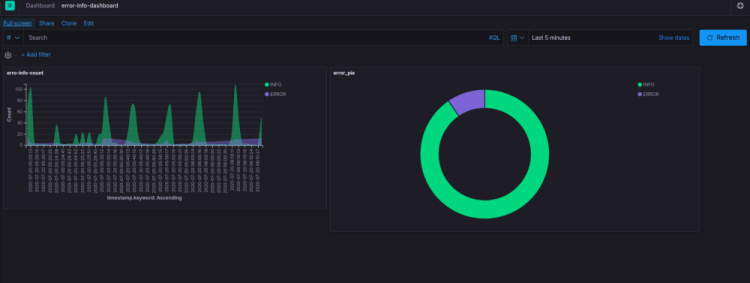
This dashboard is used by those creating COBOL microservice to display when filesystem errors occurred, when microservices start or are unable to handle a request and when computing errors arise.
13. Data Streaming Dashboard
 Credit: @AbhishekBose
This powerful dashboard consists of not only Kibana but also uses Python and Apache Kafka alongside to power this highly robust data streaming pipeline.
14. Kubernetes Monitoring
 __Credit: __@ArunKumarSingh
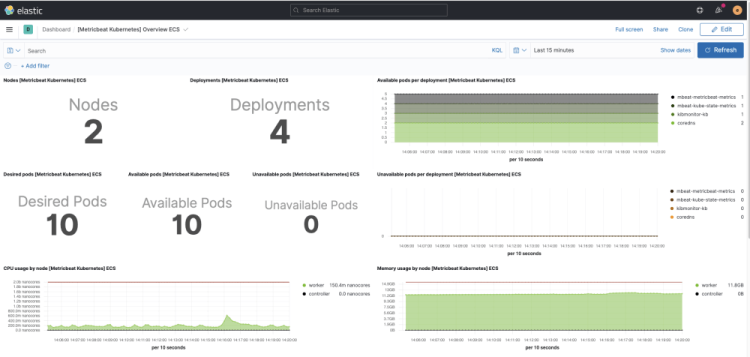
One commonly known feature of Kibana is its use as a monitoring tool for Kubernetes. For this Kubernetes cluster manager example, Metricbeat is used to collect metrics from operating systems, services and data sources before you use Logstash to parse and enrich your data before it is forwarded to Elasticsearch and Kibana.
15. Airline Flight Metrics Dashboard
 Credit: @AndyKwan
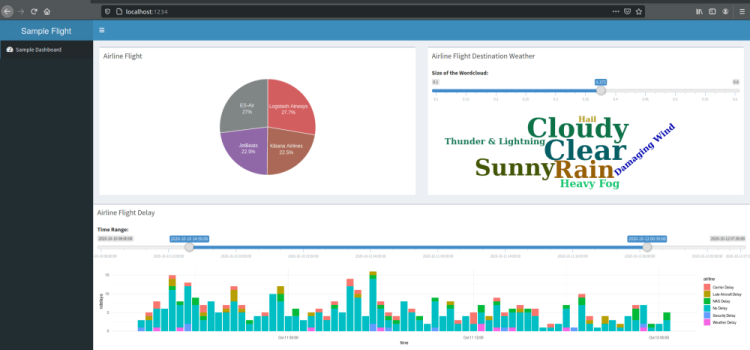
One of the more common use cases of Elasticsearch and Kibana that you may have previously heard of is the airline flight reporting dashboard.
This dashboard aggregates the flight destination’s weather forecast as a word cloud to surface which weather is the most prevalent currently.
This particular dashboard also tracks flight delays and which airline companies are most active.
16. Visitors by State & Country
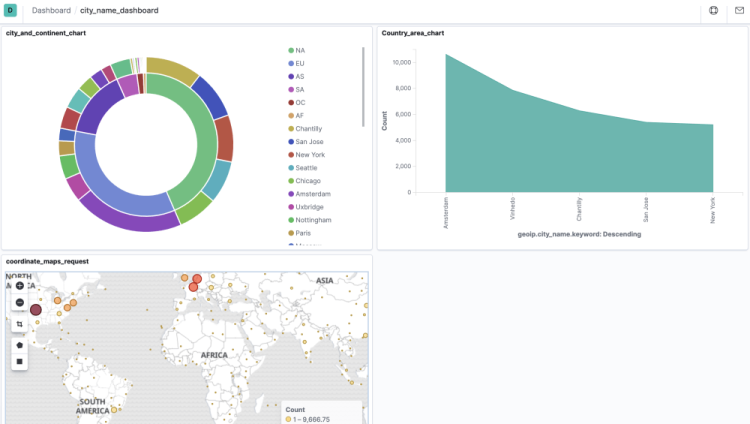 Credit: @Chestermo
If you are a marketing professional then it is likely that you are already familiar with the Google Analytics report for showing website visitors by geographic region.
If you are looking for a visualisation tool to use as an alternative to Google Analytics (especially in light of their recent push to GA 4) then you’ll love using this Kibana dashboard.
Visualise the same visitor geographic data more intuitively within an open-source based dashboard that isn’t pushing for limiting the way you can view or customisation the filters that you can apply to your data.
17. Jenkins Application Monitoring
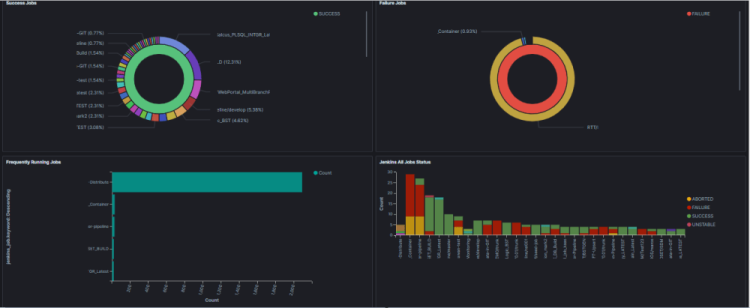 Credit: @SouravAtta
Users of the popular software deployment tool Jenkins often wish to view which deployment jobs ran successfully, failed or were launched unstably as well as jobs that are running frequently in the background, this Kibana & Elasticsearch dashboard captures all of these insights to be shared with your wider development and DevOps team members.
18. Saving The Planet By Allocating Resources More Efficiently
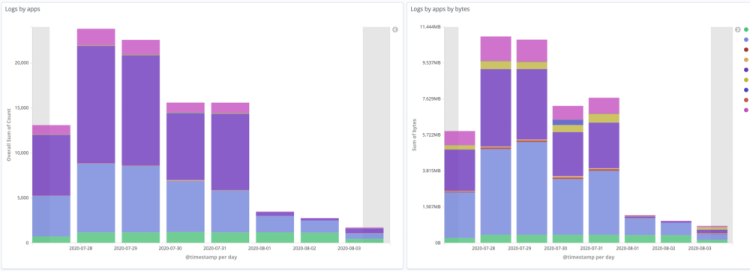 Credit: @CharlesGerber
The author of this post does a brilliant job of explaining how they used the ability to visualise their most busy apps to reduce their overall energy consumption costs by 75%, saving their organisation from producing 3 tons of C02 per year!
We can all agree that when analysis leads to reducing your organisation’s overall carbon footprint then this is something we should all be doing more often to prevent climate change.
19. Vulnerability Scanning
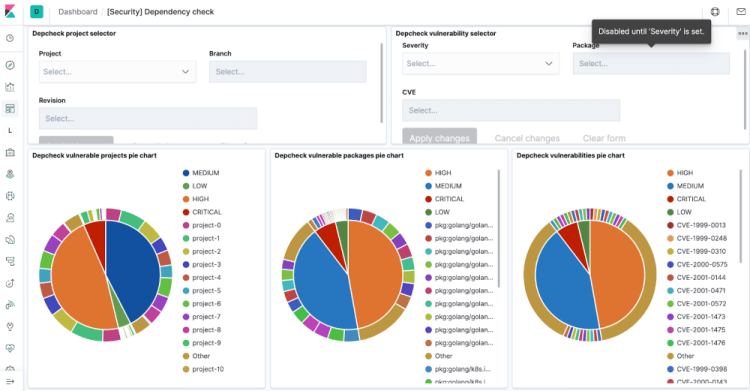 Credit: @FilipPytloun
For DevOps & cybersecurity professionals looking for a highly customisable way to conduct vulnerability scanning, we hope that this example shows that Kibana is a more than suitable alternative to using more costly out of the box security solutions.
In this Medium post, the original creator of this dashboard details how when they were looking for a PCI and SOC-2 compliant security solution for scanning their Kubernetes based microservices that the author initially tried to use a commercial tool and found that there wasn't enough support for several tools they already used.
At the end of their evaluation, they found that it was well worth using Kibana to build out their dashboards to implement comprehensive vulnerability scanning built using open-source technology.
20. Recovering Data For Over 6000 Users
 Credit: @GaetanoPiazzolla
The writer behind this Medium post details how after launching an ill-fated code release they suffered a huge loss of user data, this example may not be a reporting dashboard, but nevertheless provides a fascinating use case for the Elastic Stack!
After the initial disaster, they found that they were able to recapture the user data that would have otherwise been permanently lost as they still had access to the data stored in Elasticsearch & Kibana.
As a result of using the ELK Stack alongside some measures to automate the recovery process, they were able to successfully recover over 95% of the data they were in danger of losing originally.
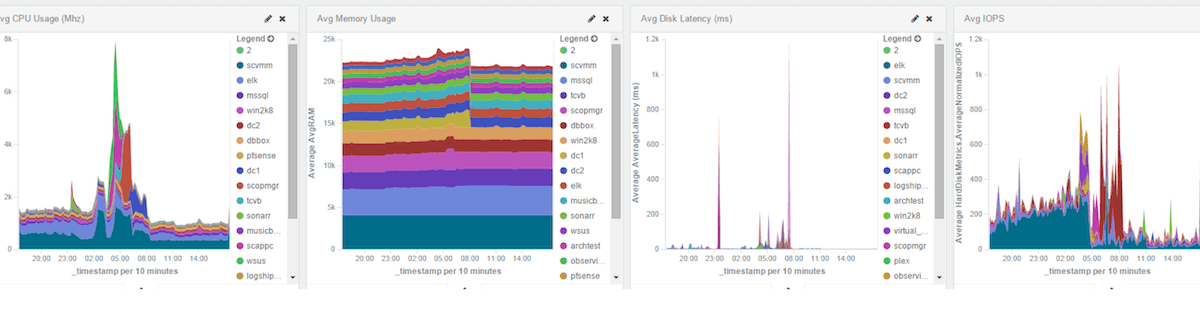
21. Server Monitoring
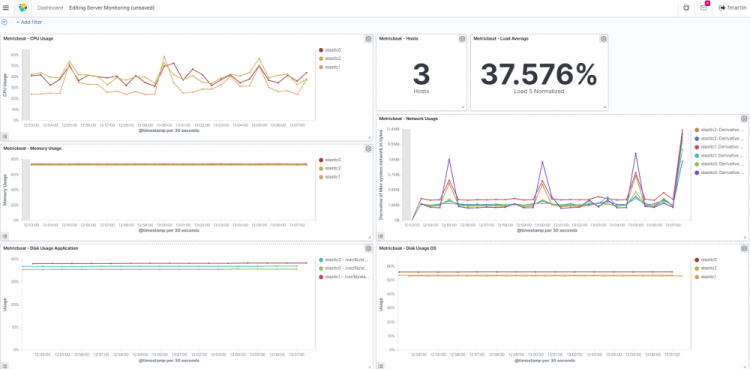 Credit: @FrancoMartin
This example of a Kibana dashboard displays all of the most essential attributes of a server monitoring system.
Server monitoring is an essential service often required by solutions architects and system administrators to view how their servers are using resources such as CPU & disk usage, memory consumption, I/0 & other closely related processes.
22. Firewall Monitoring Dashboard
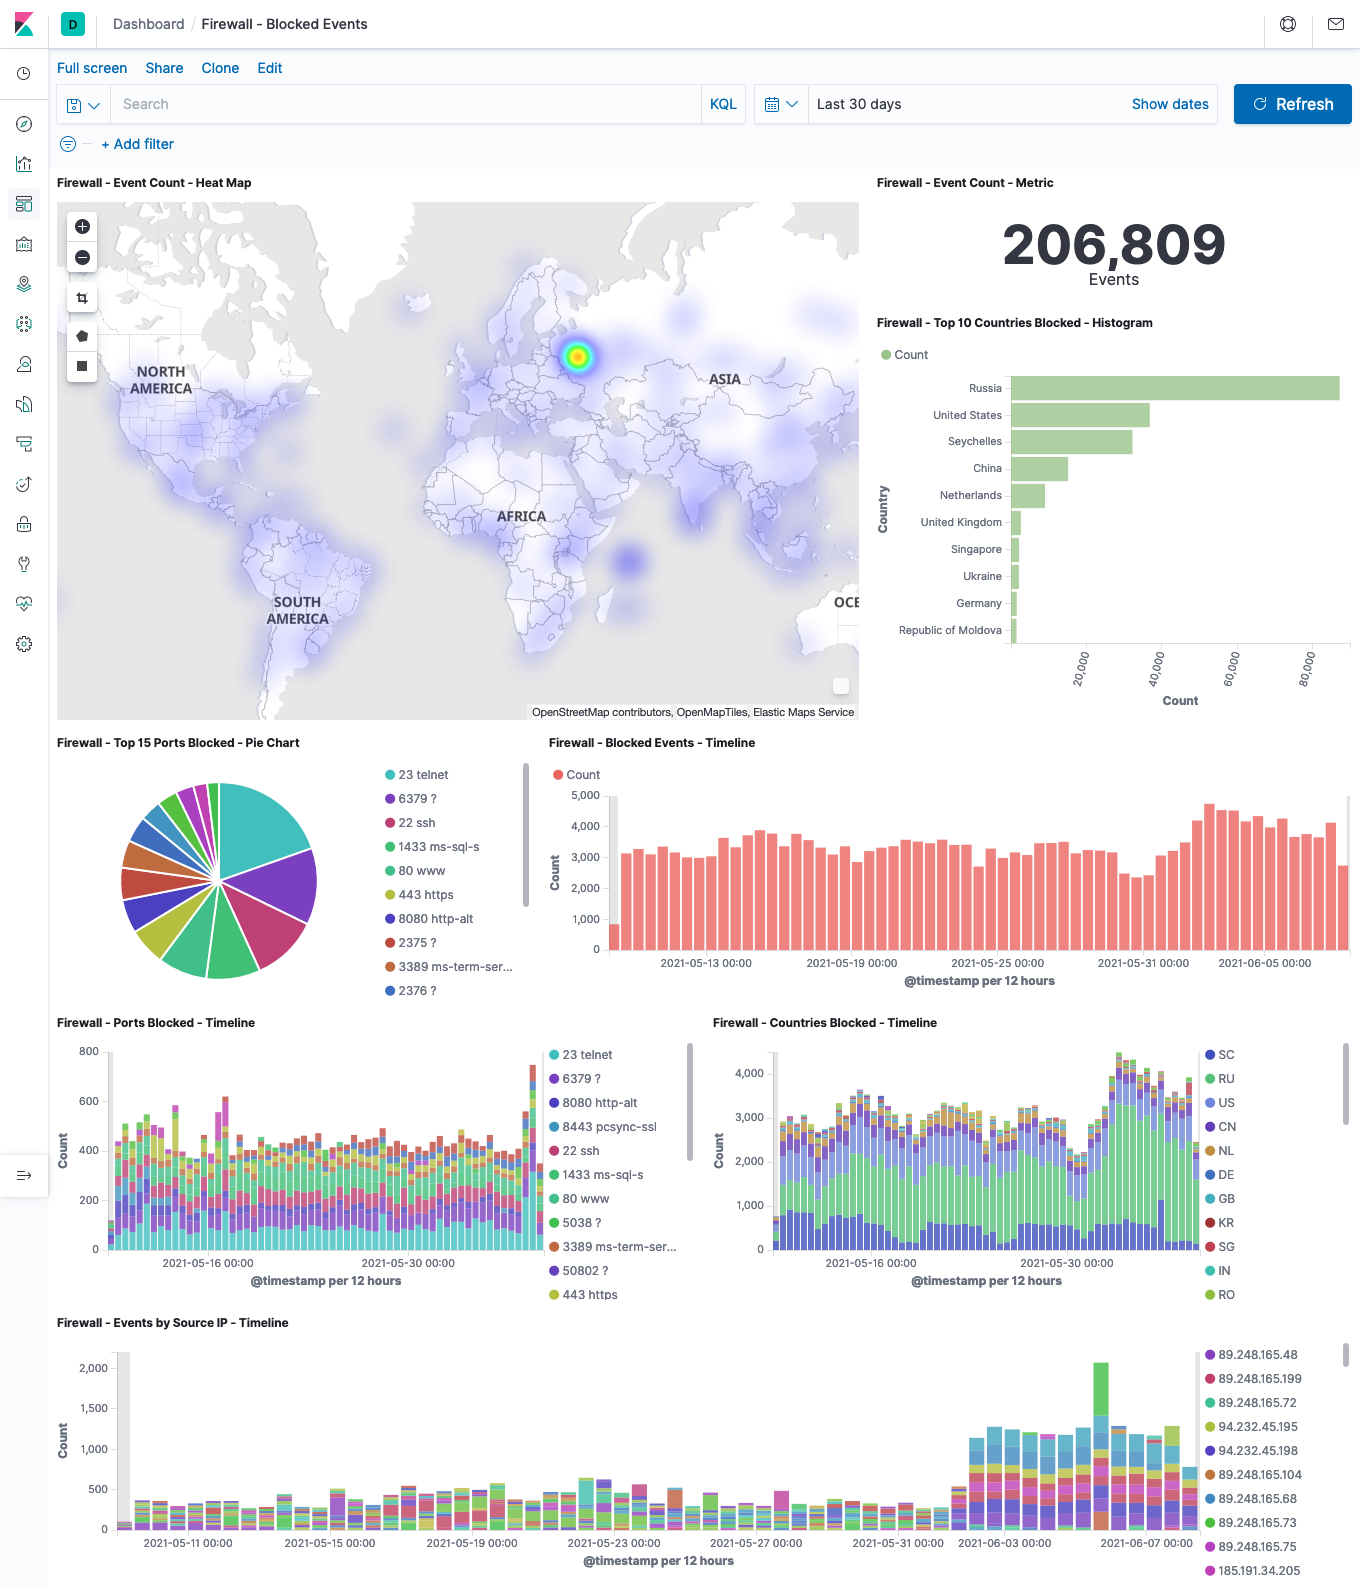 Credit: @JoeB-
Monitoring key firewall metrics can have a direct impact on how efficient you are at protecting your network. By identifying potential security threats and events as they spike you can take steps to be proactive in tightening system security.
This Firewall monitoring dashboard can be configured to display blocked events by region, total blocked event count, events blocked by country, top 15 blocked ports and an overall timeline of blocked events as well as a variety of other key charts.
23. Netflow Traffic Dashboard
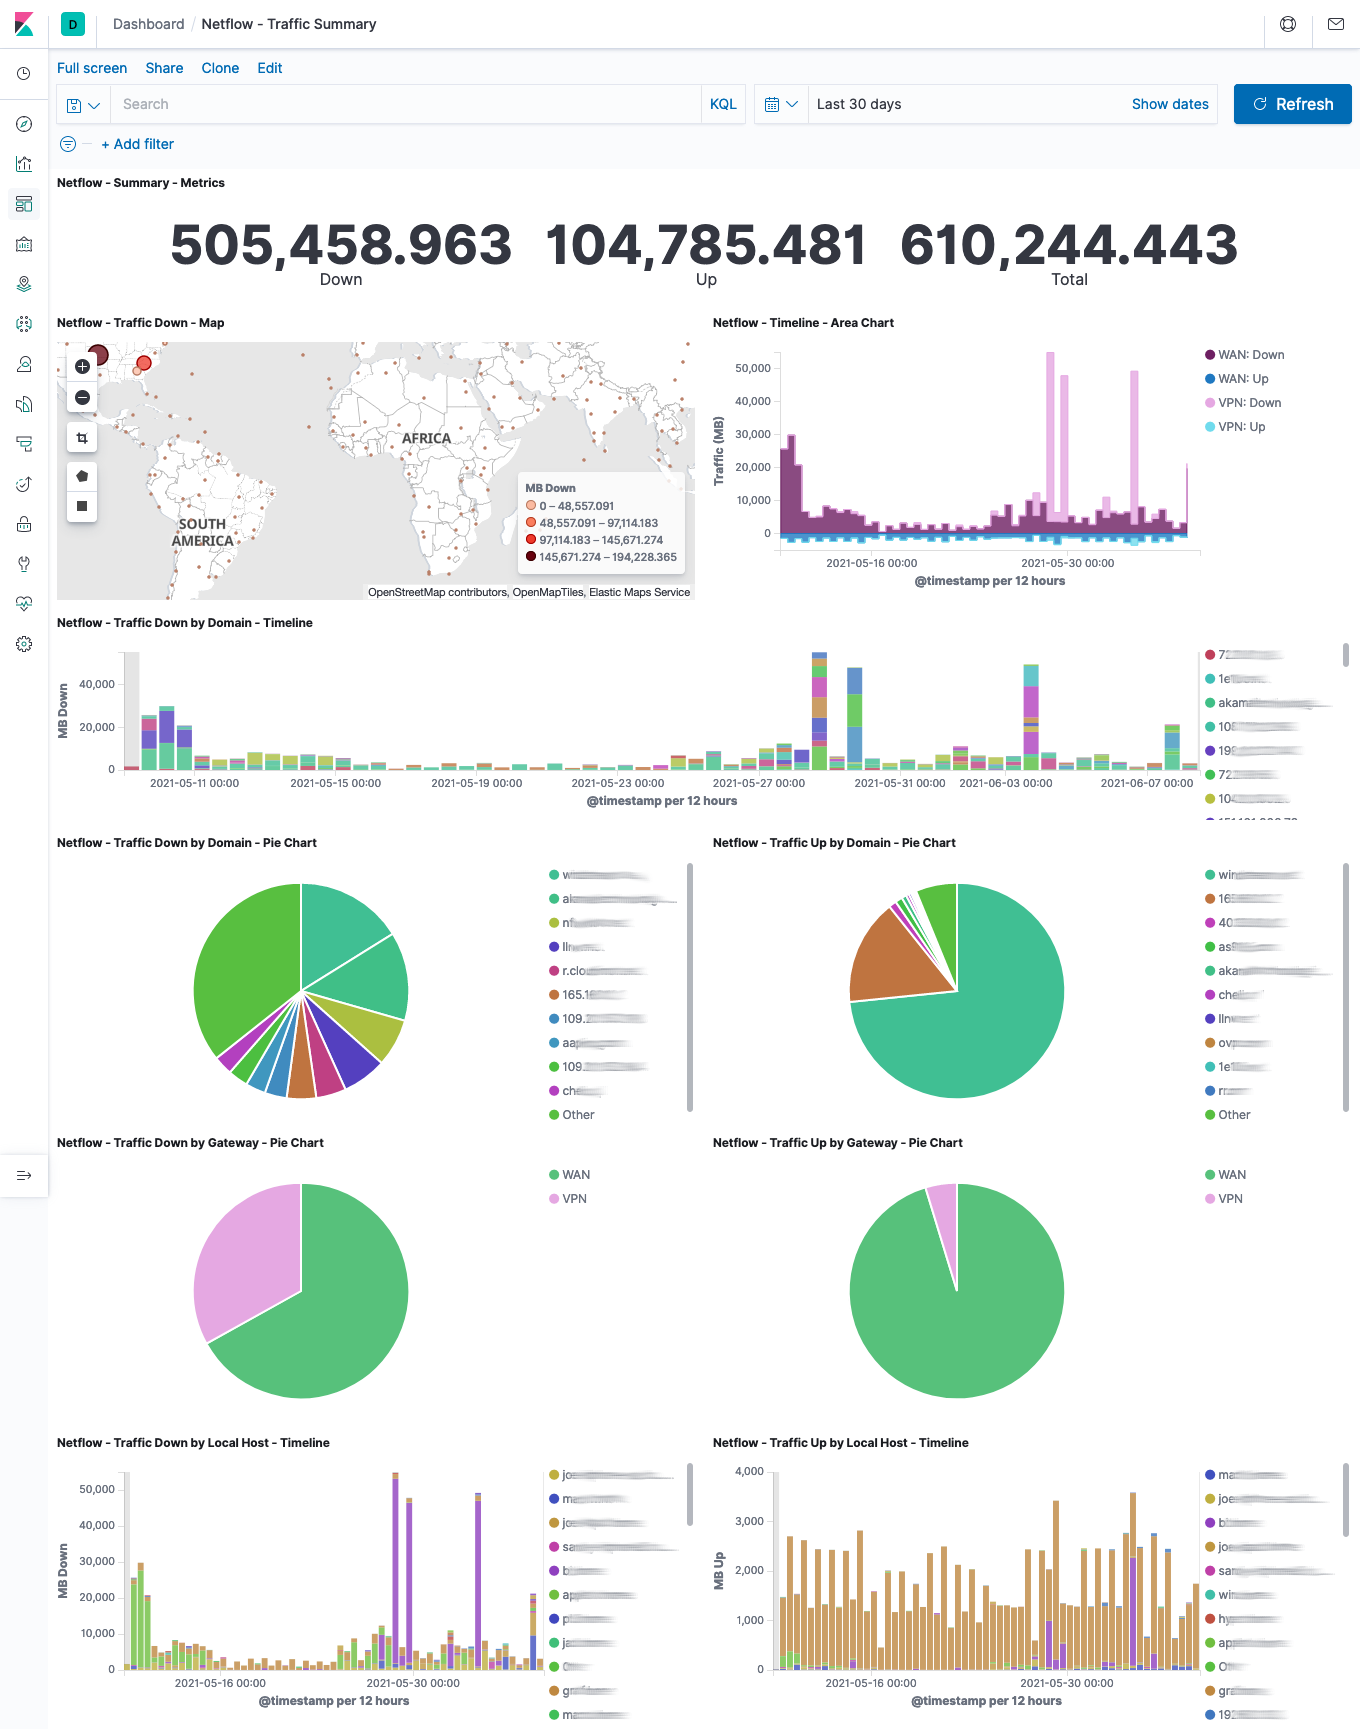 Credit: @JoeB-
NetFlow is a popular network protocol used to collect IP traffic. As this is a one-way technology, it can be difficult to monitor Netflow without the use of a specialised analytics dashboard. This Netflow monitoring dashboard provides visibility so that anyone managing Netflow can resolve conditions such as congestion and over-usage.
In this Kibana dashboard we can configure charts to display the following metrics from Netflow; traffic down by region, timeline area chart, traffic down by domain, traffic down by local host as well as traffic up by local host.
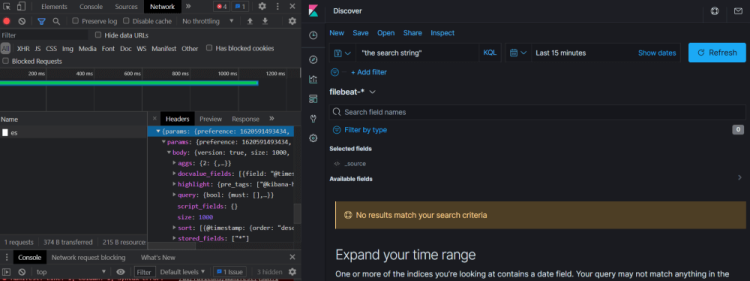
24. SSH Security Dashboard
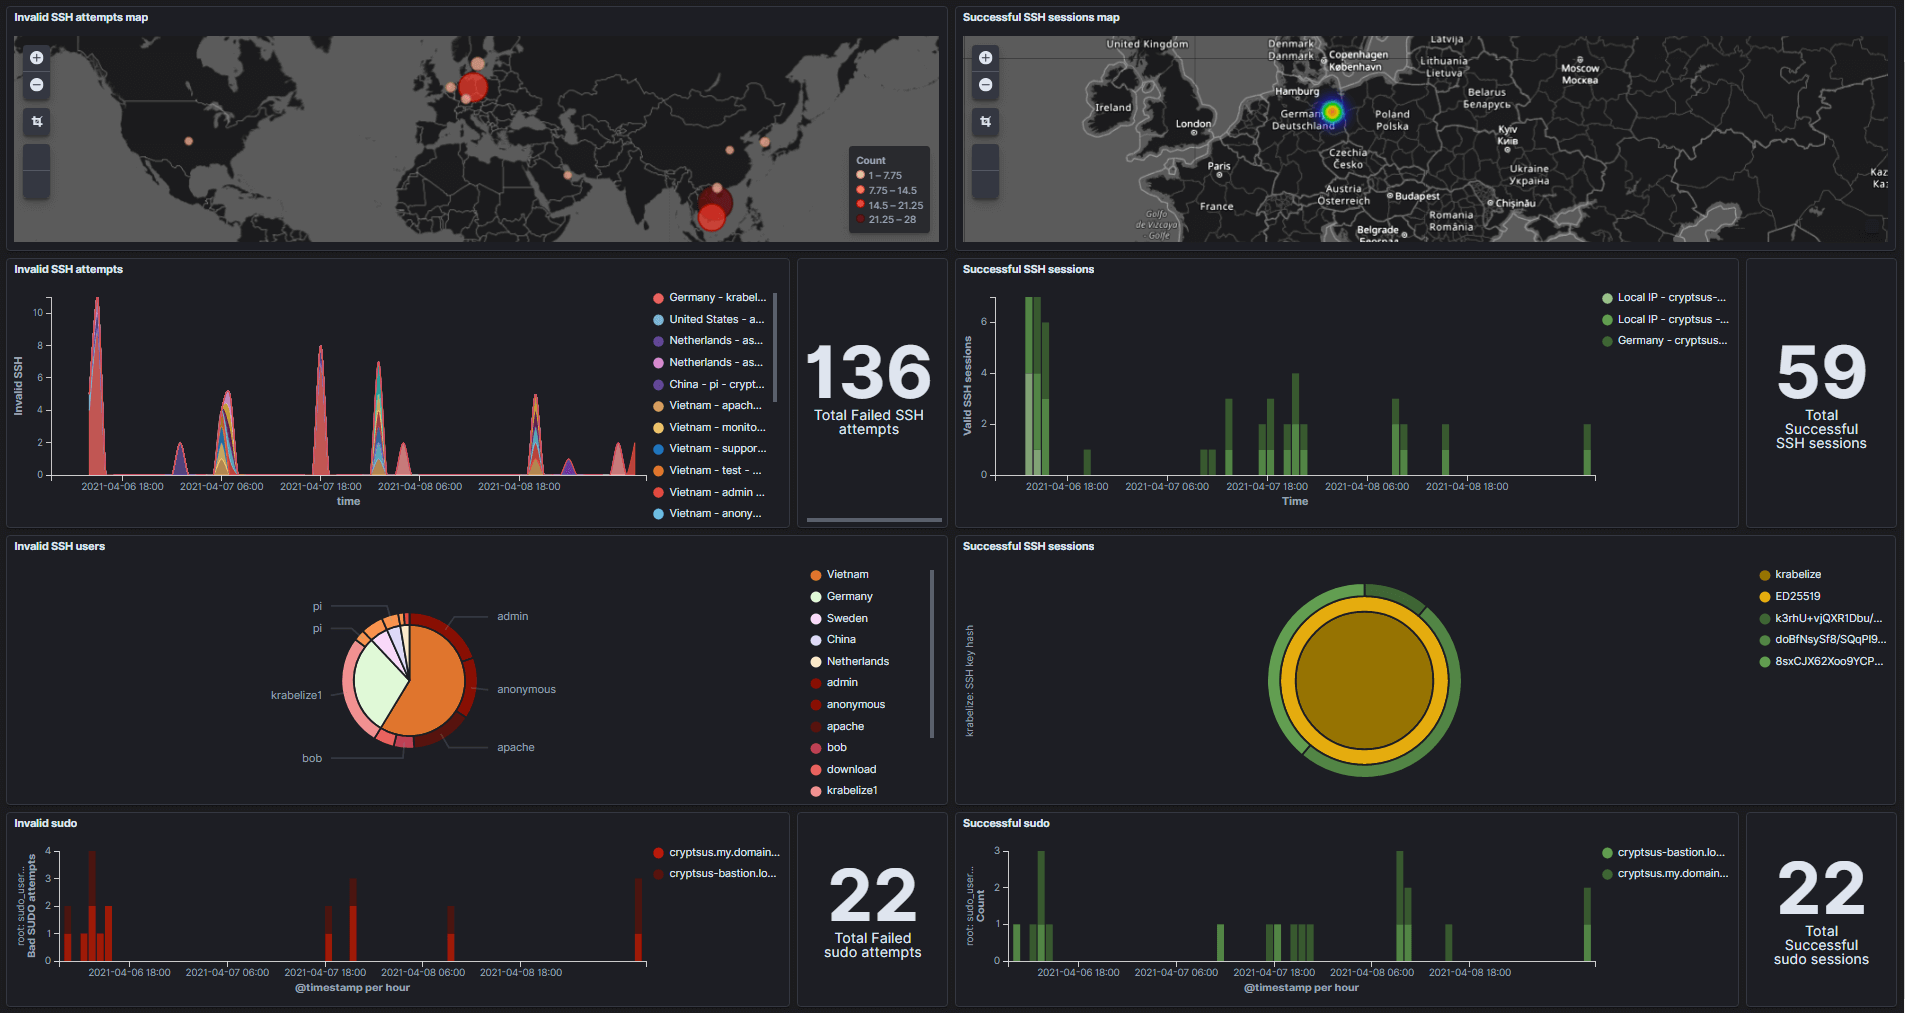 Credit: @Jeroen van Kessel
25. EXIF Data Dashboard

While Kibana supports various data types, including structured and unstructured data, it doesn't have built-in support for visualizing EXIF (Exchangeable Image File Format) data directly. However, users can still use Kibana to visualize EXIF data by extracting and transforming the relevant information into a format that Kibana can handle.
Want to get started with creating your own Kibana dashboards? Then why not learn more about how Kibana as a Service can help your organisation grow?
If you enjoyed this post then why not check out our guide to Kibana query syntax or our article on how to configure an index pattern in Kibana?