Resources
4 min read
End-to-end monitoring refers to the comprehensive assessment of the whole IT environment to understand the overall state of the IT infrastructure and how it impacts user experience. Traditional monitoring techniques have differed from end-to-end monitoring in that they view the IT environment from a more holistic and user-centric perspective than other traditional ways of monitoring.
Traditional monitoring typically involves observing certain components or parts of an infrastructure, such as the performance of a server, network traffic, or application health. It gives details about single views but usually lacks context on how the different individual elements interact and affect system performance.
Moreover, end-to-end monitoring comprises the absolute IT ecosystem, all the way from the user's perspective to back-end systems. It traces the flow of data and the interaction among all components to ensure that each part works harmoniously to achieve a seamless user experience. This approach pinpoints issues not only within individual components but also within the interactions between the components.
By providing a birds-eye view into system health and what it means for the end user, end-to-end monitoring empowers a team to identify and rapidly resolve the problems that could negatively impact user satisfaction and business outcomes.
Highlighting the advantages of end-to-end monitoring shows the benefits organizations can gain from the practice. However, to get the most out of the process and conduct it efficiently end-to-end monitoring tools should be used but with the extensive range of these tools available, it can be difficult to know which is the most appropriate solution for your organization. So to help you with this, this article will outline the leading end-to-end monitoring tools.
Contents
How Does End-to-End Monitoring Work?
- Data Collection: Performance metrics and event data can be gathered directly from applications, servers, networks, and databases by deploying relevant sensors and agents.
- Data Integration: Data sources are all aggregated into a central monitoring platform, which allows bringing together all the sources to have one, across-the-board view of the system.
- Correlation and Analysis: The monitoring platform analyzes the integrated data, and correlates events and performance metrics in search of patterns and possible problems. This includes understanding how different components interact and how their performance affects overall system health.
- User Experience Tracking: Specific metrics on user interaction, such as response times and error rates, indicate the quality of the user experience.
- Alerting and Reporting: In case of performance degradation or anomalies, the system sends alerts so IT teams can respond quickly. Detailed reports provide insights about system health and performance trends.
- Automated Responses: Some end-to-end monitoring solutions also provide automated remediation that offers predefined actions to resolve common issues without human interaction.
End-to-End Monitoring Tools
Dynatrace
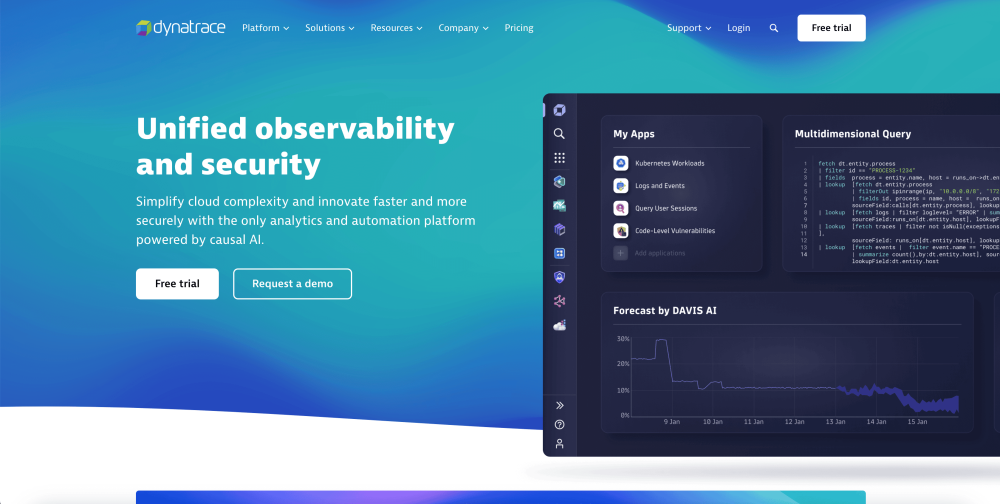
Dynatrace is an advanced end-to-end monitoring tool that brings full-stack visibility into applications, infrastructure, and user experiences. It detects and diagnoses problems in the entire IT environment using artificial intelligence, providing real-time insights and detailed performance metrics. The monitoring of both real user interactions and synthetic transactions, assures optimum performance and fast issue resolution, two critical enablers of good health and efficiency for any complex IT system.
Kentik
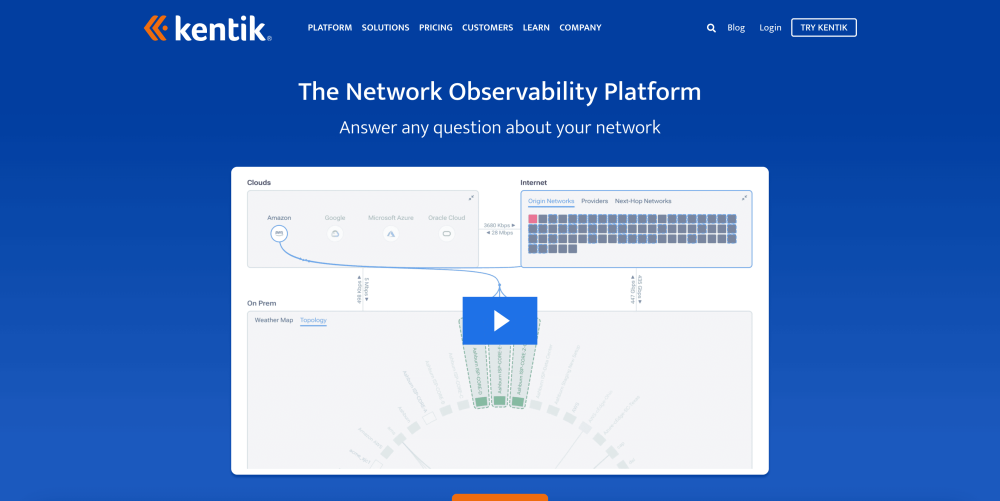
The first tool included in our list of end-to-end monitoring tools is Kentik, a network observability platform. The solution enables you to monitor and attain insights into the performance of your network infrastructure. Kentik offers assistance to further enhance your ability to conduct troubleshooting quickly. Lastly, you can identify faulty network devices with the continuous monitoring and alerts required.
Logit.io
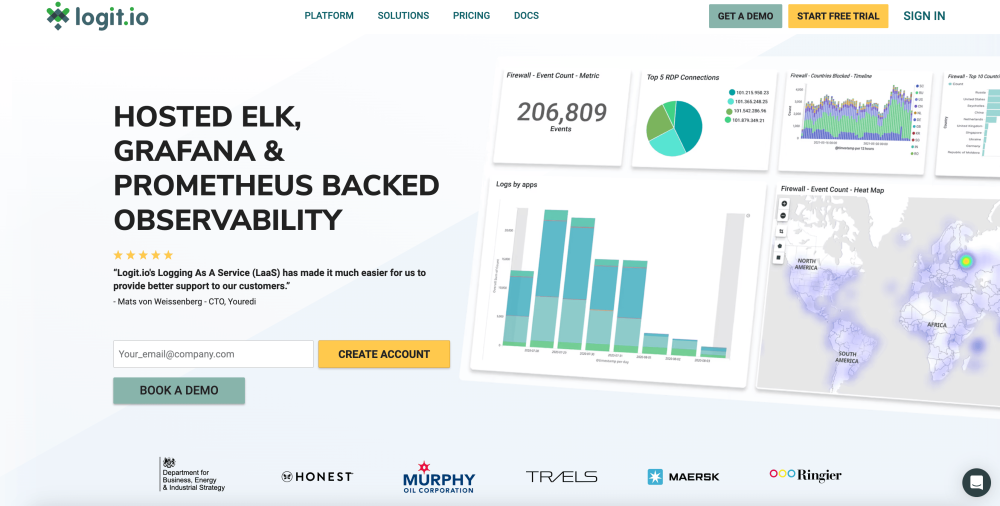
Logit.io is a powerful and cost-effective observability platform, built on leading open source tools, offered as hosted solutions, including Hosted ELK, Grafana, and Prometheus. Logit.io is combined with OpenTelemetry (OTel) which makes end-to-end observability easy. By using OpenTelemetry your engineers can essentially standardize any data coming from any source.
Also, it provides unified analysis and complete centralization of any kind of telemetry data. With Logit.io you can utilize a variety of monitoring solutions such as APM, metrics as a service, and log management. If you’re interested in finding out more about the Logit.io platform, feel free to get in touch or begin exploring the platform for yourself with a 14-day free trial.
PRTG Network Monitor
PRTG Network Monitor is a simple-to-use network monitoring solution offering end-to-end monitoring capabilities. It supports flow monitoring, enabling users to examine traffic flow and attain insights into the end-to-end performance of data across the network. Also, PRTG Network Monitor offers preconfigured monitoring and device templates for numerous of the most popular vendors.
LogicMonitor
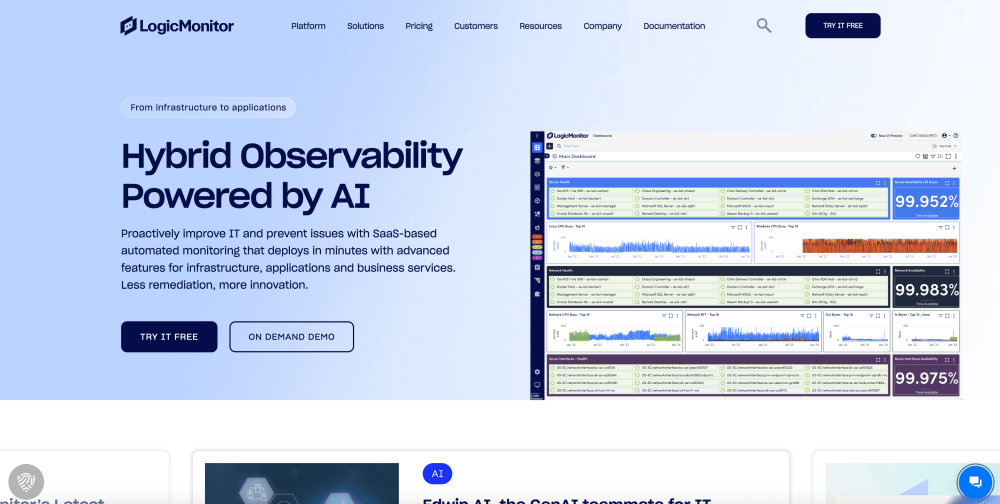
LogicMonitor is a cloud observability platform with integrated AI that offers automated discovery, configuration, and performance monitoring. The solution enables users to identify issues and minimize Mean Time to Repair (MTTR) with root cause analysis and dynamic thresholds for real-time anomaly detection. As well as this with LogicMonitor your team can focus on the most important monitoring metrics, covering services, applications, and infrastructure.
SolarWinds Network Performance Monitor
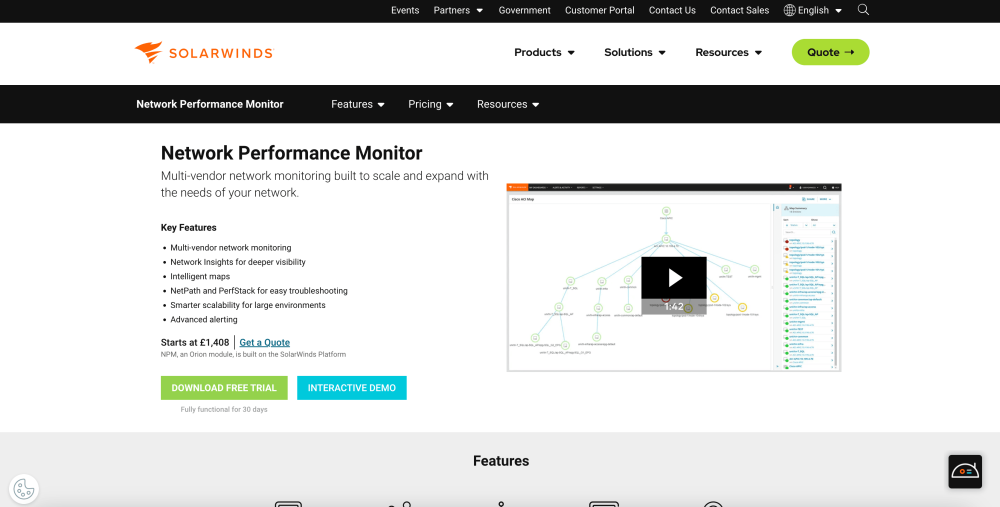
SolarWinds Network Performance Monitor is an integrated end-to-end monitoring solution that provides real-time visibility into network performance. It can trace, in-depth, the health and status of the entire network infrastructure, from devices down to complete network paths. Due to these advanced features, SolarWinds NPM provides real-time monitoring with detailed performance analysis for proactive resolution, ensuring the smooth running of all the network components consistent with performance.
AppDynamics
AppDynamics enables users to identify the root causes of application issues in real time, from third-party APIs down to code-level problems, allowing IT teams to quickly determine what is most impacting key business metrics. This solution also lets you visualize the digital interaction between your users and your business, ensuring a seamless and hassle-free experience at every touchpoint.
Nagios
Nagios is an efficient, flexible monitoring tool designed to oversee the entire IT infrastructure, including networks, servers, applications, and services. The system provides full monitoring capacity, warning the user of any problems that may arise and ensuring minimal operational impact. The wide array of available plugins, customizable notifications, and strong reporting allows IT teams to use Nagios to monitor optimal system performance and fix problems before impacting the reliability and productivity of the IT environment.
If you've enjoyed this article why not read The Best LogicMonitor Alternatives or The Leading Real User Monitoring Tools next?
