


You already proved the pipe in First Prometheus Metrics on Logit.io: Telegraf scrapes, the Infrastructure Metrics stack stores the series, Explore draws a line. The next useful thing is not a forty-panel community dump. It is one dashboard on the Metrics stack Grafana — a host filter, a few PromQL panels that match what you actually ingested, and a save you can share.
Contents
Launch Metrics opens the right Grafana
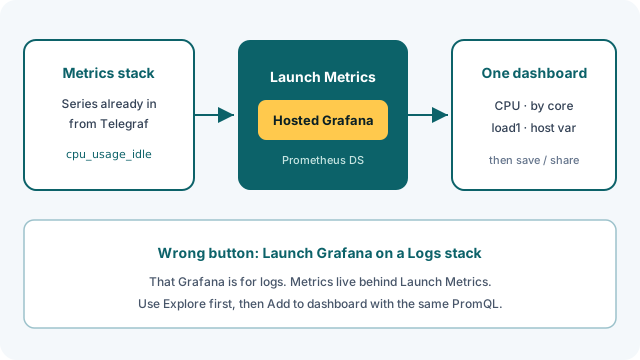
Logit ships Grafana in two places, and the button labels matter. On an Infrastructure Metrics stack, the control is Launch Metrics — top of the stack card or on stack settings. That path is what Getting started with Grafana Dashboards and View infrastructure metrics with Grafana both describe. On a Log Management stack the sibling control is Launch Grafana, aimed at logs. Open the wrong one and you will spend twenty minutes wondering why Prometheus looks empty while Telegraf is fine.
Stay on the Metrics stack you used for the scrape. Launch Metrics from that card. Do not invent a second Grafana URL from an old Slack thread. Hosted Grafana for metrics is bound to the stack that holds the series.
Prove the Prometheus datasource still answers
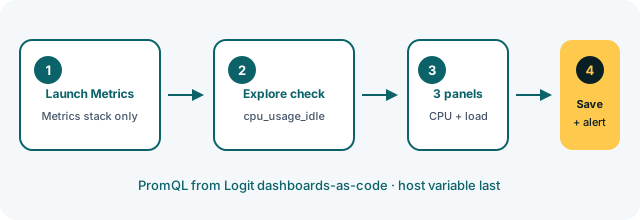
Before Dashboards → New, reopen Explore in the left sidebar. At the top of Explore, pick the Prometheus datasource that came with the Metrics stack. Set the time range to the last 15 minutes (calendar / clock controls, top-right). The visualizers guide walks this Ad-hoc Explore path field by field: data source dropdown, time range, query builder, then Run Query.
Type a metric you know landed. The Logit docs lean on Telegraf CPU series for the worked examples — start with cpu_usage_idle. If your scrape was node_exporter through the Prometheus input (the path in the first-metrics post), Explore may list node_cpu_seconds_total instead. Use the metric browser. Do not paste a name that never appears in the autocomplete just because a blog post used it.
After the metric name, add label filters the way the visualizers page shows — tags such as host to pin one machine. Pick a visualization (line is enough). Run Query. Prefer Add to dashboard from Explore only after the line looks right; that button carries the working query into a new or existing board so you are not retyping PromQL by memory.
A line here is the green light. No line? Fix Explore first — wrong Metrics stack, time range tighter than the scrape interval, or Telegraf pointed at a different stack’s credentials. Dashboard panels will not invent series Explore cannot see.
Unlock complete visibility with hosted ELK, Grafana, and Prometheus-backed Observability
Three panels from the CPU dashboard recipe
Logit’s dashboards as code and Terraform guides ship a concrete host CPU board. Steal that recipe by hand in the UI instead of importing a stranger’s JSON. The getting-started Grafana page frames each panel the same way: choose a visualization type, configure the data query (query builder for simple series, query editor for the PromQL below), then customize panel settings (unit, thresholds, legend). From Grafana: Dashboards → New dashboard → Add visualization. Panel by panel:
Panel 1 — CPU Usage (timeseries)
Datasource: Prometheus (the stack one, same as Explore).
Query A: 100 - cpu_usage_idle{host=~"$host"}
Legend: {{host}}
Unit: percent, min 0, max 100.
That expression is the docs sample — idle flipped into busy CPU.
Panel 2 — CPU Usage by Core (timeseries)
Query A: 100 - cpu_usage_idle{host=~"$host", cpu!="cpu-total"}
Legend: {{host}} - {{cpu}}
Same unit bounds. The cpu!="cpu-total" filter matches the published example so per-core series stay readable.
Panel 3 — System Load Average (stat)
Query A: system_load1{host=~"$host"}
Legend: {{host}}
One number next to the graphs is enough for a first board.
Then add the host variable the docs use. Dashboard settings → Variables → Add variable:
- Name:
host - Type: Query
- Query:
label_values(cpu_usage_idle, host) - Multi-value: on, Include All: on, All value:
.*when you want the full set - Refresh on dashboard load / time change so new hosts show up after the next scrape
Apply, set time to last 1h, refresh every 30s if you want the same defaults as the JSON sample. Save the dashboard with a boring name you will recognize next week — “Host CPU” beats “Dashboard”. Resize panels after the queries return; the getting-started page calls that out once the visualization is saved.
When Explore is green and the board is blank
This failure mode is specific to dashboards. Explore shows cpu_usage_idle, the panel stays “No data”. Usual causes, in order:
- Panel datasource — the panel still points at a Prometheus you added by hand, or at Grafana’s default that is not this stack. Re-select the Metrics-stack Prometheus on every panel.
- Host variable mismatch —
host=~"$host"with no selection, or All wired without.*, filters everything out. Pick one host from the dropdown, or temporarily drop the selector and query100 - cpu_usage_idlebare. - Wrong metric family — you scraped node_exporter and pasted Telegraf’s
cpu_usage_idle. Flip the panel to the series Explore actually lists, or scrape the Telegraf cpu input if you want the docs samples verbatim. - Time range — dashboard clock set to last 5 minutes while the agent just restarted; widen it.
- Job / label typos — a
job="…"matcher copied from another environment that never existed on this stack.
If Explore itself is empty, you are back on the first-metrics checklist: scrape URL, Telegraf service, credentials for this Metrics stack. TLS mistakes on the shipper side — agent skipping HTTPS to a TLS-only output, or a corporate proxy terminating the Metrics endpoint — show up as missing series, not as a Grafana theme bug. Confirm the agent still uses the Install Integration output block for this stack before you rewrite every panel query.
Save the board, then wire one CPU idle alert
Once the three panels move, stop adding rows. Use the share icon on the dashboard for a link your team can open inside the same Launch Metrics Grafana — the visualizers guide mentions share options after Add to dashboard. That is the collaboration step unique to this surface: a saved board on the Metrics stack, not a screenshot in chat.
Next useful click is one alert against the same metric family. Configure CPU alerts walks the Grafana Alerting UI: Alerting → New Alert Rule, metric cpu_usage_idle, host label with =~ if you want regex across machines, reduce with avg() instead of last(), condition IS ABOVE 90 for sustained idle (underutilization signal in that doc), evaluate every minute or every 5, and fold in the cpu / cpu-total label conditions the guide shows. Name the rule, put it in a folder/group you will find later, attach a contact point, save. The broader metrics alerting overview is there when you outgrow the single rule.
Leave community packs and Terraform automation for after this board is honest. When you do want code, the same PromQL and ${DS_PROMETHEUS} datasource uid pattern live in the dashboards-as-code page — still pointed at Launch Metrics, still the Metrics stack you opened today.