
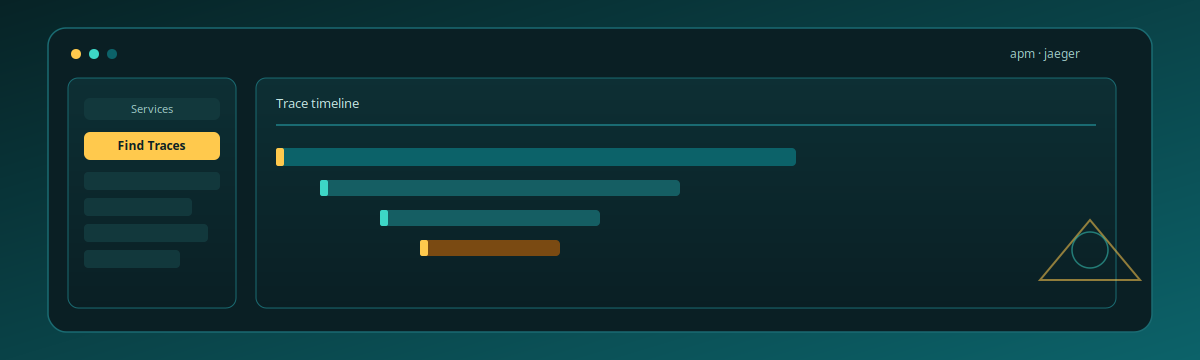

You already have logs telling you something failed, and metrics showing when latency drifted. The next useful signal on Logit.io is a trace: a parent span for the request, child spans for the downstream work, and a timeline you can open in Jaeger. That lives on an Application Performance Monitoring (APM) stack, not as JSON blobs shoved into the Logs index you used last week.
Contents
Spans are not another log line
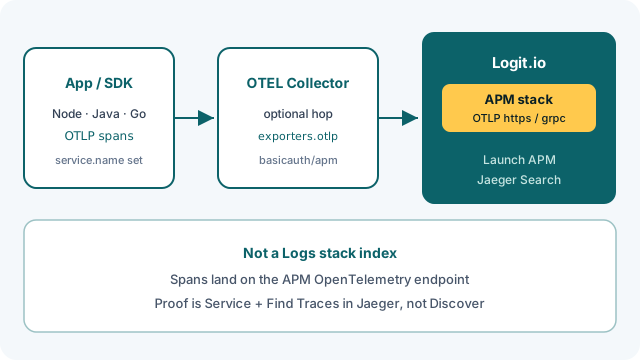
A Logs stack is for documents you search in OpenSearch Dashboards. An APM stack is a different product surface: OpenTelemetry ingestion, OpenSearch storage for spans, and Jaeger as the visualizer. The APM overview spells out the pieces — Jaeger collector, Kafka, Jaeger ingester, OpenSearch, Jaeger UI — so you are not fighting Discover for a waterfall that was never meant to live there.
Stuffing span JSON into Logstash keeps the wire busy and still leaves you without Service dropdowns, Find Traces, or compare views. The dedicated path is the one in Getting started with OpenTelemetry and the traces quickstart: ship OTLP into the APM stack, then Launch APM.
Copy the OpenTelemetry Inputs for this stack
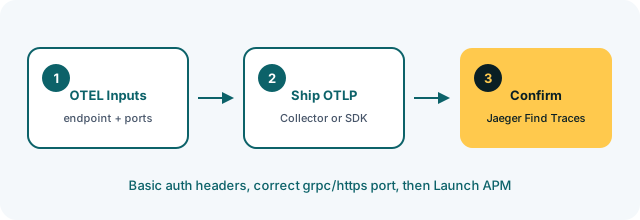
Sign in at the Logit.io dashboard and create an APM stack. From stack settings, open OpenTelemetry Inputs under Application Performance Monitoring. That page is documented in APM: OpenTelemetry Inputs. Use the Copy Endpoint control. Do not paste a hostname from a Logs or Metrics trial.
Field by field, what you need from that panel:
- Stack OpenTelemetry endpoint — the
{stack-id}-apm.logit.iohost for this APM stack. - Protocol —
httpsorgrpc. Pick one and keep the exporter on that protocol end to end. - Port — the https port and the grpc port are stack-specific values shown next to the protocol. Mixing grpc credentials with the https port (or the reverse) is a silent miss.
- Https user / https password — reveal them on the Inputs page. APM expects Basic auth over both HTTPS and gRPC; see Authorized applications.
Those same placeholders appear in Install Integration for language guides and for the OpenTelemetry Collector source: @opentelemetry.endpointAddress, @opentelemetry.httpsPort / @opentelemetry.grpcPort, @opentelemetry.username, @opentelemetry.password.
Ship OTLP: Collector or SDK
Two honest first paths. The Using OpenTelemetry for traces quickstart points at Integrations → OpenTelemetry → Traces OpenTelemetry Collector. The Collector config Logit ships for the demo pipeline wires an exporters.otlp block with auth.authenticator: basicauth/apm and:
endpoint: '@opentelemetry.endpointAddress:@opentelemetry.grpcPort'The matching extension is basicauth/apm with client_auth.username / client_auth.password from OpenTelemetry Inputs. The traces pipeline is receivers: [otlp] → exporters: [otlp]. Local receivers stay on 0.0.0.0:4318 (HTTP) and 0.0.0.0:4317 (gRPC) so your app talks to the Collector; the Collector talks to Logit on the APM endpoint and grpc port.
Prefer instrumenting one service directly? The Node.js APM section is a concrete SDK sample. config.js for HTTPS looks like:
module.exports = {
  endpoint: "@opentelemetry.endpointAddress",
  port: "@opentelemetry.httpsPort",
  protocol: "http",
  username: '@opentelemetry.username',
  password: '@opentelemetry.password',
};
For gRPC, swap port to @opentelemetry.grpcPort and protocol to "grpc". The exporter builds either https://{endpoint}:{port}/v1/traces with an Authorization: Basic … header, or grpc://{endpoint}:{port} with SSL plus metadata Basic auth. The SDK sets ATTR_SERVICE_NAME (the sample uses LogitNodeJSTestApp). That name is what Jaeger lists under Service. Leave it blank or let it default to something generic and you will stare at a Service list that never shows the process you just restarted.
Hit one route that creates a real parent span. Auto-instrumentation on Express is enough for a first waterfall. The Node sample app.js requires ./tracing before Express listens, then serves / so a browser hit to http://localhost:3000 actually emits a span. Do not turn on every sampler knob and every library on day one. Language packs for Java, Go, Python, and .NET live under the same APM getting started list if Node is not your stack.
Unlock complete visibility with hosted ELK, Grafana, and Prometheus-backed Observability
Prove it in Jaeger Search
Return to the dashboard and choose Launch APM (also labeled Launch next to Jaeger under Services on the APM stack card). The click path is in Viewing spans and traces and the traces quickstart. Jaeger opens on Search.
Set the date range on the right to cover the minutes since you generated traffic. Pick your Service from the list — the service.name / ATTR_SERVICE_NAME you set — then Find Traces. A row in Search is the proof. Click a trace summary to open the span timeline: durations, child operations, where time actually went.
The Compare tab is useful once you have more than one trace for the same operation — the viewing guide calls it out for cutting noise and focusing on end-to-end latency. For the first session, one honest parent span with at least one child beats a wall of empty services. If the Service list is populated but Find Traces returns nothing, widen the date range before you rewrite the exporter. Jaeger will not show spans captured outside the picker window even when the APM stack ingested them.
When Jaeger stays empty
Wrong endpoint or port is still the usual miss. Re-copy OpenTelemetry Inputs. Confirm the exporter protocol matches the port you pasted. HTTPS exporters that omit /v1/traces, or gRPC exporters pointed at the https port, fail without a useful UI error in Jaeger.
Missing Basic auth is next. Username and password must match the revealed Https user / Https password for this stack. Rotating credentials on Inputs without updating the Collector extension or SDK config.js looks identical to a dead pipe. TLS mismatch shows up when the client skips SSL on a port that requires it — the Node gRPC sample uses credentials.createSsl() for a reason.
If the Collector is up and Jaeger still lists no Service, check service.name. Sampler configs that drop everything (ratio 0, or a parent-based sampler with no parent and no root decision) produce a healthy process and zero spans. Generate one request after the SDK starts; traffic from before sdk.start() never becomes a trace.
Network blocks still happen. The APM troubleshooting page on stack connectivity is Logstash-oriented openssl checks; for OTLP, verify outbound access to {stack-id}-apm.logit.io on the https/grpc ports from Inputs. Proxy and firewall rules that only allow the Logs -ls.logit.io host will not help APM. Also confirm you launched Jaeger from this APM stack. Another trial's Launch APM link opens a Search view that will never list the Service you just instrumented.
Open the slow span, then find the matching log
Once Search returns a trace, stop adding exporters. The next useful move is unique to tracing: open the slowest span in the waterfall, note the operation name and timing, then jump to your Logs stack and search for log lines that carry the same trace context (trace id / span id) for that request window. That is the correlation Getting started with OpenTelemetry is aiming at — traces in Jaeger, logs in Dashboards, not one pile of JSON.
After that path is boring, add a second service, or put a latency panel in Grafana against the metrics you already scrape. Alerts can wait until you trust the Service list. Cross-check every placeholder against OpenTelemetry Inputs before you paste; APM hosts and ports are stack-specific, and they change when you rebuild the stack.