
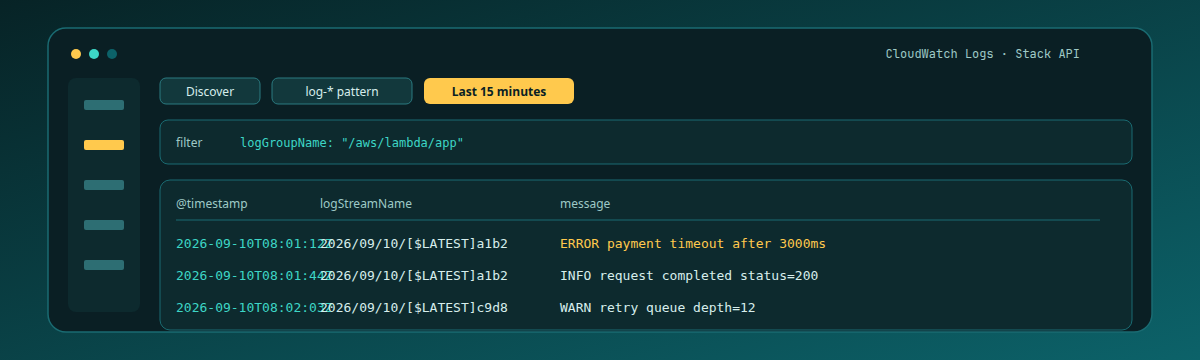

CloudWatch already holds the lines from your Lambda, ECS task, or unified agent. The first useful win on Logit.io is not a migration spreadsheet. It is one Log Group, the documented Lambda shipper posting to this stack's API, and rows in OpenSearch Dashboards Discover that show logGroupName, logStreamName, and message. If you are still proving that a Logs stack can accept anything at all, start with First Logs on Logit.io; this post assumes CloudWatch is the source and the Stack API is the pipe.
Contents
CloudWatch already has the lines
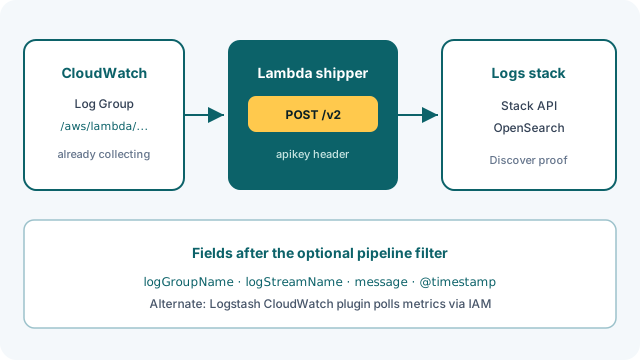
Logit's AWS getting-started path lists several ways out of the account: ship directly from the host, land files in S3, push through Lambda, or queue through SQS. For logs that already sit in CloudWatch, the path that teaches first value is the AWS Lambda CloudWatch integration: CloudWatch fires the function, the function gunzips the subscription payload, and it POSTs JSON to the Stack API. That is different from AWS CloudWatch via the Logstash CloudWatch plugin, which is the poll-based IAM path for CloudWatch metrics (cloudwatch:GetMetricStatistics, cloudwatch:ListMetrics, plus ec2:DescribeInstances). Use the plugin when you want selected metrics into Grafana. Use the Lambda shipper when you want the log lines themselves searchable in Discover.
Getting started if you're running applications in AWS is blunt about polling the CloudWatch metrics API for everything: it burns cost and rarely helps. Narrow the first Log Group. One noisy /aws/lambda/... group is enough to prove the pipe.
Install Integration and the Stack API key
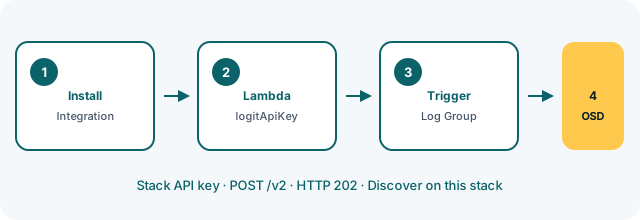
Create or open a Log Management stack. On the docs page (or from the stack), click Install Integration for the Lambda CloudWatch source. That step binds the placeholders the sample function uses — @apikey and @logitApiEndpoint — to this stack. An API key copied from another trial, a Metrics stack, or a teammate's account will return looking healthy in CloudWatch while Discover on your stack stays empty.
You can also pull the key from Settings → Stack API Keys on the same stack. Treat that value as a secret in the Lambda environment; do not hard-code it into the function source you commit to git.
Every field in the Lambda shipper
In the AWS console, create a function from scratch on the runtime the docs call for (Node.js 16.x on the live sample). Replace the default index.js with the Logit handler from AWS Lambda CloudWatch. Walk the pieces before you Deploy:
configurationData.logitApiKey starts as the Install Integration placeholder. At runtime the handler prefers process.env.logitApiKey when that env var is non-empty after trim. Missing or whitespace-only env values fail the invoke with Environment value for logitApiKey must be specified. — that string is the first failure mode to search for in the function's own CloudWatch logs.
handleInput reads input.awslogs.data, base64-decodes it, then zlib.gunzips the buffer. CloudWatch Logs subscription filters always send that compressed envelope. If you test the function with a plain JSON event that has no awslogs.data, gunzip fails and nothing reaches Logit.
parseEvent builds each outbound record with four keys: message (trimmed log line), logGroupName, logStreamName, and timestamp as an ISO string from the CloudWatch event timestamp. Those names matter later when you filter in Discover and when you optionally flatten them in Logstash.
sendToLogit POSTs to hostname @logitApiEndpoint, path /v2, with headers apikey, content-type: application/json, and content-length. The body shape is { cloudWatchLogEvents: [ ... ] }. The handler treats HTTP 202 as success. Any other status logs Response code invalid and fails the callback — so a 401 from a wrong key or a 404 from a wrong endpoint shows up in the shipper's CloudWatch log stream, not as a silent drop.
Add the environment variable logitApiKey, paste the Stack API key, Save, and Deploy. Do not skip Deploy after the env change; an old published version will keep failing the env check.
Unlock complete visibility with hosted ELK, Grafana, and Prometheus-backed Observability
Attach one Log Group as the trigger
In the Lambda designer, Add trigger and choose the CloudWatch Logs Log Group that already receives the lines you care about. One group for the first proof. The docs expect the designer to show that subscription after you save. New lines in that group should invoke the function; old historical lines in CloudWatch do not replay unless you write a fresh marker.
Generate a unique marker — a string you can search — by invoking the source function or writing a known log line into the group. Wait for the shipper invoke to finish. Then leave the AWS console and open the Logit stack.
Prove logGroupName in Discover
On the stack, Launch OpenSearch Dashboards. Open Discover and select the index pattern this Log Management stack created. Set the time picker to Last 15 minutes. Search for your marker in the free-text box, then confirm the document fields the shipper sent:
logGroupName— the CloudWatch group you attached (for example/aws/lambda/your-app)logStreamName— the stream inside that groupmessage— the trimmed log line, including your marker@timestamp— after the optional Logstash date filter below; until then you may still see the shipper'stimestampfield depending on how the default pipeline stored the payload
Filter on logGroupName for the group you attached so you are not mixing noise from another trial on the same account. Rows with that field and your marker mean the Stack API leg accepted the POST (202) and OpenSearch indexed the events.
Once those rows exist, the next useful step on the journey is often a narrow alert on the same message pattern — see Your First Useful Log Alert on Logit.io. Do not wire alerting until Discover is boringly reliable for this Log Group.
Lambda green, Discover quiet
Wrong stack API key is the usual miss. Re-copy from Settings → Stack API Keys on the stack you are watching in Discover. Confirm the env var name is exactly logitApiKey and that you Deployed after setting it.
Open the shipper function's own CloudWatch log stream. Look for Log data sent successfully. versus Response code invalid, Problem executing the request, or the missing-env error. A 202 in the shipper with an empty Discover view points at the wrong stack endpoint or the wrong Dashboards index pattern. A non-202 points at key, hostname, or network egress from Lambda to the Logit API.
Confirm the trigger is on the Log Group that received the marker. A function that never invokes will not POST. Confirm the time picker covers the invoke. Confirm you are not looking at a Metrics stack Grafana or another account's Logs stack.
If the stack stays empty after a clean 202, follow How can I diagnose no data appearing — the same diagnosis path the Lambda CloudWatch docs link.
Optional pipeline, then leave metrics alone
Stacks ship with common Logstash pipelines. For cleaner Discover fields, the Lambda CloudWatch docs recommend a filter that matches message containing cloudWatchLogEvents, runs json on message, splits the array, renames [cloudWatchLogEvents][logGroupName] → logGroupName (and the same for logStreamName, message, timestamp), then runs a date match on ISO8601 into @timestamp. Edit under Stack → Settings → Logstash Pipelines. Apply that once Discover already shows raw events so you can tell a pipeline mistake from a shipper mistake.
Stop there for logs. Do not bolt on VPC Flow Logs, CloudTrail S3 drops, or every Log Group in the account until this one group is reliable. When you need CloudWatch metrics instead of log lines, switch to the separate AWS CloudWatch Logstash input: create the IAM policy with cloudwatch:GetMetricStatistics, cloudwatch:ListMetrics, and ec2:DescribeInstances, create a programmatic IAM user, and configure the AWS input on the stack for verification. That path ends in Grafana, not in the Discover fields this post proved.
Cross-check every hostname, API key, and pipeline snippet against the live docs before you paste. Stack API keys and endpoints are stack-specific, and they change when you rebuild the stack.