Getting Started, How To Guides
3 min read
Last updated:
If you want to learn how to export your Kibana dashboards, visualisations, and search results as either CSV or JSON then follow the steps below in our brief guide.
Also, if you're getting started with using Kibana for the first time then it is likely that you'll require a platform in order to host your Elasticsearch cluster. Logit.io is the perfect solution for this, offering fully open hosted ELK which provides extensive advantages and capabilities, alongide in-depth documentation with hundreds of integrations to support your organization. Find out more about hosted ELK from Logit.io within this article.
How To Export From Kibana To CSV
In order to export a visualisation to a formatted CSV file, you must first open up a visualisation from the Visualisations menu and press the Inspect button at the top of the page.
You cannot export a visualisation if there is no data within the visualisation, and as such the inspect button will be disabled.
A right side inspection window will show where you will be able to select the type of CSV to download. See the screenshot below:

Both the raw and formatted options will export a CSV file and include headers using the CSV data format, however the latter option will format data rows in a more human-readable format, similar to the data shown in the results panel.
The raw version will show more specific values for numbers and the date/time values will used timestamps rather than easy to read labels (i.e. October 1st 2020).
How To Export From Kibana To JSON
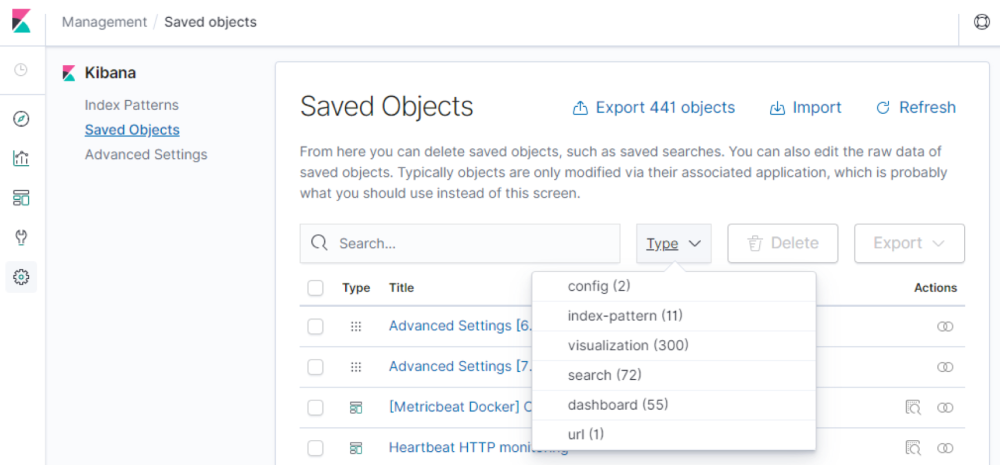
Kibana provides the capabilities to export saved objects created by the user using the Management menu. You can export saved dashboards, search results, visualisations and more inside the Saved Objects submenu.
You can filter by the type of export using the Types dropdown menu on the right of the search box.
This page allows you to selectively export one or more objects contained inside a single "export.json" file.
This can be used to backup data and then imported at any time using the import button in the top right of the page next to the refresh button, as shown below:

If you save a visualisation from the Visualisations menu, it will show in the list of saved objects. Then you will be able to export it by checking the check box next to its name and pressing the Export button.
If you are getting started with using Kibana for the first time then it is likely that you'll require a platform in order to host your Elasticsearch cluster.
By using a platform such as Logit.io, you can experience all of the benefits of fully open ELK without having to configure, maintain or manually upgrade your Stack.
Also, our observability platform offers unparalleled flexibility and affordability. It comes with no vendor lock-in, transparent pricing, no charges for data egress, and no mandatory multi-year commitments. If you’re interested in finding out more about our platform, don’t hesitate to get in contact or get started with a 14-day free trial.
Unlock complete visibility with hosted ELK, Grafana, and Prometheus-backed Observability
Start Free TrialIf you're already a Logit.io customer more information regarding Kibana can be found in the Kibana section of our documentation. Also, if you encounter any issues when working with Logit.io's hosted Kibana, feel free to reach out, or contact us via the live chat which can be found in the bottom right corner of your screen.
If you enjoyed this guide on how to export data from a Kibana search then why not check out our article on how to create a new Elastalert rule as well as our article on how to remove fields using Logstash filters.
