
Resources
5 min read
Reporting and analytics dashboards provide enhanced visibility into your data and the ability to view your most critical metrics via a single source of truth. By using dashboards, your team can easily highlight issues or areas of concern and promptly begin addressing them utilizing the real-time data that a dashboard provides. As well as this they can be utilized to drive data-driven decisions for your organization, enabling greater accuracy for decision-making to drive growth.
With dashboards, you can save both time and resources. Rather than spending numerous hours logging into different systems to run and format individual reports. You can simply harness the potential of centralized dashboards to quickly and easily highlight updated results and data, enabling enhanced efficiency for your team.
In addition, dashboards make tracking and reaching goals much simpler. You can create a dashboard specifically for a certain goal, with all the relevant metrics and KPIs that need to be reached to complete the goal. So, throughout the journey to reach the goal, you can clearly see if you’re on track or if resources need to be dedicated to a specific area to help attain goal completion. Within this article, we will outline how to build dashboards with some of the most popular platforms.
Contents
How to create a Grafana dashboard
By using Grafana to build a dashboard you can create highly customizable visualizations that combine logs, metrics, and tracing data from numerous data sources into a single dashboard. Also, Grafana enables you to visualize data in real-time, allowing for a dynamic view of your system's performance and quick identification of trends, anomalies, or issues. The steps below will provide a walkthrough of how to create a Grafana dashboard.
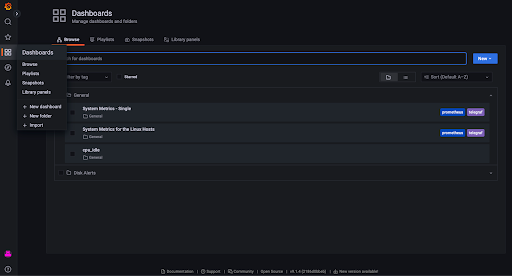
Log into Grafana, if you don’t have an account, you can sign up for a free trial of hosted Grafana, you will arrive at the homepage. Now, from the menu on the left of your screen choose ‘Dashboards’ and select ‘+ New Dashboard’ as shown below.
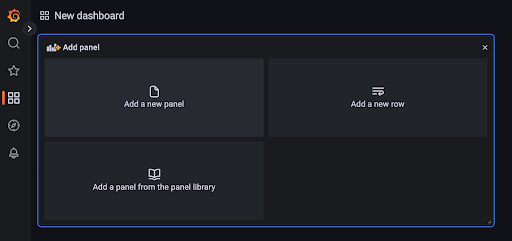
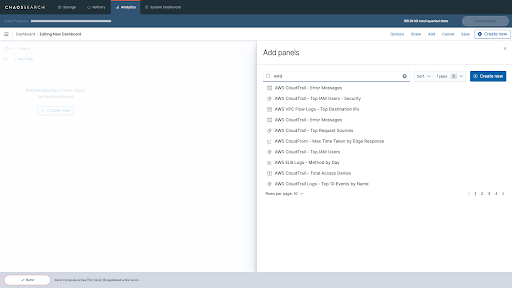
This dashboard page will enable you to create helpful graphs and visualizations to display your data, depending on your requirements. From here you can choose ‘add a new panel’.
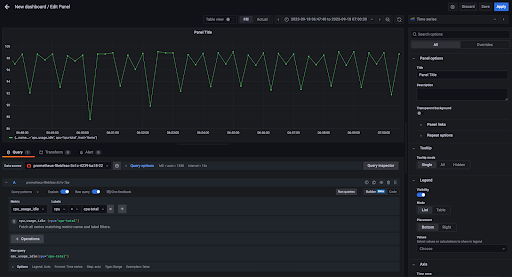
After selecting ‘add a new panel’, the edit panel screen will appear (as shown below), here you can customize what data is displayed. Depending on what data you choose to include you will need to select a ‘Metric’ and ‘Label’ seen in the image below, then select ‘Run Query’ to preview what the new panel will look like.
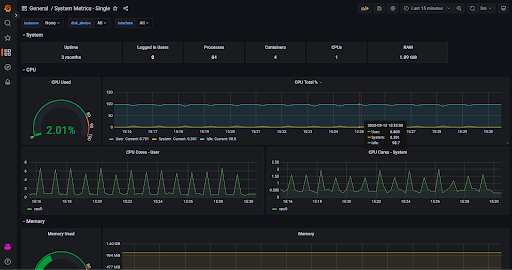
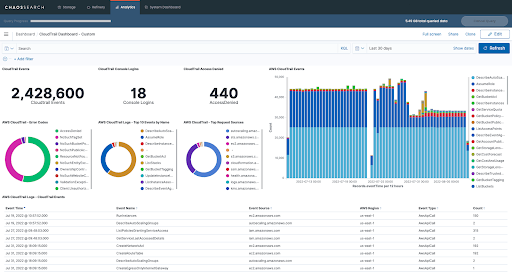
Select ‘Apply’ to add this new panel to your dashboard and continue to add panels to your dashboard until it has reached your requirements. An example dashboard is shown below.
To further optimize your dashboard, pay attention to panel placement, and drag and drop each panel until the layout is as desired. Label your panels and utilize annotations to provide context and insights to viewers. Also, guarantee that you save your dashboard by selecting the disk icon in the upper-right corner.
How to build an OpenSearch Dashboard
With OpenSearch you can visually present your analytical, operational, and strategic data assisting you in understanding the trends in your data. Supplying you with a high-level view of key metrics, streamlining data exploration, and delivering insights when and where you need them.
First login to OpenSearch,if you don’t have an account, you can sign up for a free trial of hosted OpenSearch. You'll then arrive at the homepage. From here, navigate to the left-hand menu and select ‘Overview’ under ‘OpenSearch Dashboards’ to begin visualizing your data.
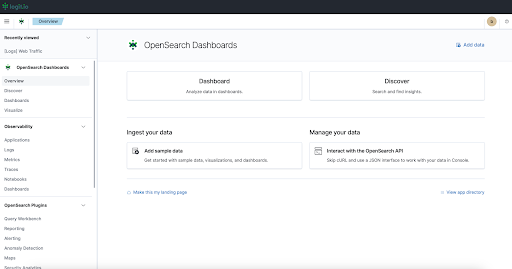
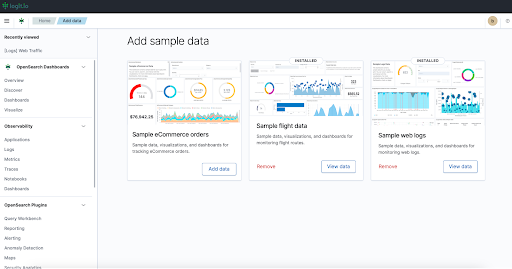
Once here, you can select ‘Discover’ to visualize your ingested data in more detail. Also, you have the option to use sample data. If you use sample data, OpenSearch will produce an example dashboard that can be cloned, edited, and adjusted. This will help you to understand the visualization options that OpenSearch is capable of.
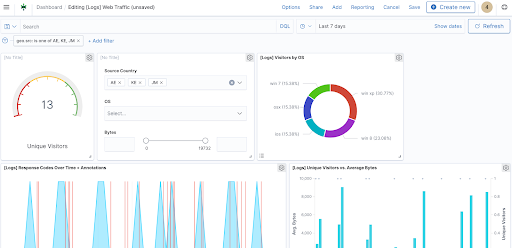
 For reference an example dashboard is shown below:
How to create a Kibana dashboard
Kibana is another solution that provides powerful dashboards. Kibana visualizations are particularly useful for beginners as the tool has extensive help documentation and queries answers by other users. Also, if you’re dealing with an extensive amount of complex data, then Kibana dashboards allows you to more easily utilize canvas visualizations to help examine and analyze this data much more easily.
Log in to Kibana, if you don’t have an account, you can sign up for a free trial of hosted Kibana. From the left-side menu select ‘Visualize’, you’ll arrive at the visualizations page, and select ‘Create Visualization’ to build a new visualization.
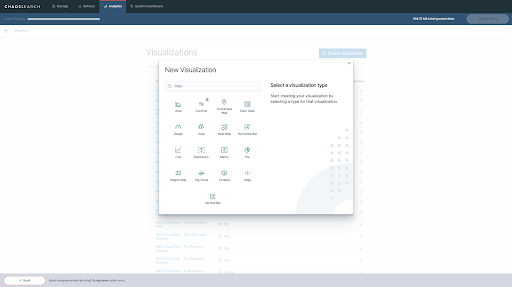
Next you’ll need to identify a data source, this can be a previously saved search or you can execute a new search.
Now configure the visualization builder to display your data so it is useful, you can modify these visualizations by adding filters.
After creating visualizations, select ‘Dashboard’ on the left-side menu, and then choose ‘Create New Dashboard’. Here, you’ll be requested to add panels to your dashboards, your visualizations that you created earlier can now be used as ‘Panels’ for your dashboard.
Now that you’ve specified what data should be displayed in each panel on your dashboard, to make your dashboard more visually appealing these panels can be rearranged and other elements added.
How to build a dashboard with Logit.io
Logit.io is a highly rated monitoring, analytics, and reporting platform that supports Hosted Kibana, Hosted Grafana, and Hosted OpenSearch. This means that you can attain all the benefits of these services, such as the powerful visualization capabilities, without the time-consuming and difficult configuration.
With the Logit.io platform, you can launch any of our hosted services to begin visualizing your data within minutes of creating your stack. Our fully managed OpenSearch, Grafana & ELK solutions incorporate node-to-node encryption and advanced Role-Based Access Controls (RBAC). As well as providing an extensive array of options for custom data visualization, alerting, and monitoring platform.
This makes it especially well-suited for numerous use cases, including cybersecurity and centralized data management. Also, leveraging Logit.io for hosting and managing your observability Stacks enables you to enjoy the benefits of utilizing a unified platform for data centralization without the need of acquiring extensive overheads, troubleshooting and maintanence.
If you want to begin creating dashboards and visualizations but are intrigued by the numerous benefits a hosted solution can offer, then Logit.io can assist you with your decision. Don’t hesitate to contact us or begin exploring our platform for yourself with a 14-day free trial.
If you’ve enjoyed this article, why not read the Best OpenSearch Dashboard Examples or the Top 30 Grafana Dashboard Examples next?