Grafana is a data analytics and monitoring software that is considered to be a transformative open-source tool that enables organizations to visualize and analyze data in real time. Grafana creates interactive and dynamic dashboards, which then allow users to gain significant business sense from the data they have retrieved making them informed in their decision-making process for effective operational efficiencies. Whether it is DevOps, business intelligence or system administration, Grafana stands out as the preferred open source solution because of its strong features and flexibility.
Various data sources are able to be used with Grafana due to its adaptability through which it has gained popularity across various different sectors. The user-friendly interface coupled with powerful functionalities of this software allows users to come up with custom dashboards not only showing critical metrics but also giving suggestions on what actions can be taken based on the insights.
In this article will give an insight into some of the best Grafana dashboards and visualizations that help make monitoring simpler and will help you to improve business outcomes.
Contents
- Grafana dashboards explained
- How to create a Grafana Dashboard
- How has Grafana grown in recent years?
- How can Grafana be used for Docker monitoring?
- How can Grafana be used for virtual machine monitoring?
- What information does the Grafana dashboard for Node exporter provide?
- Why were these specific Grafana examples chosen?
- 1. Server Monitoring
- 2. Lighthouse Metrics Report
- 3. Weather Forecast
- 4. Performance Testing
- 5. Monitoring Global ISP Latency
- 6. Windows Host Monitoring
- 7. OpenVPN Connection Monitoring
- 8. Tracking Udemy Progress
- 9. Fitbit Health Monitor
- 10. TrueNAS Dashboard
- 11. Homelab Monitoring & Cost Analysis
- 12. Forecasting Stocks
- 13. Docker Monitoring
- 14. SSL Expiry Tracker
- 15. AWS Billing Estimator
- 16. Kubernetes Cluster Monitoring
- 17. GitLab CI Pipeline Status
- 18. Kong Monitoring
- 19. Alertmanager Visualisation
- 20. Monitoring Spring Boot Microservices
- 21. Spark Streaming Monitoring
- 22. HDD Temperature Monitor
- 23. Nextcloud Audit Log Dashboard
- 24. Strava Monitoring Dashboard
- 25. Monitoring Linux Processes
- 26. Monitoring Redis
- 27. Graphite
- 28. Grafana Billing Dashboard
- 29. Kubernetes Integration Efficiency
- 30. Loki NGINX Logs
Grafana dashboards explained
Grafana dashboards are incredibly powerful for visualizing and analyzing data from a wide variety of sources. It acts as a single pane of glass, enabling users to view and interact with their metrics and log data through various visualizations. This is essential for monitoring system performance, detecting trends, troubleshooting issues in real-time and for providing an overarching view into the data being ingested.
There are many options for representing your data within a Grafana dashboard. For instance, tables present information in an easily comparable format while timelines show events over time so you can track changes or incidents occurring during that particular period. Time series charts plot out points against each other according to when they occurred which makes these a great option for keeping an eye on any metric that changes over time. Stat panels highlight important measurements by displaying them prominently. Bar charts compare different values side-by-side and pie charts break down one value based on their proportional size compared against other values being measured.
What sets Grafana dashboards apart as a visualisation tool is its flexibility and ability to be customized. Grafana dashboards can also connect to various data sources such as traditional databases like MySQL or PostgreSQL. It also supports time-series databases such as InfluxDB and Prometheus. Moreover its support for Elasticsearch makes log analysis possible while Grafana's REST APIs integration allows working with custom source types to achieve holistic system visibility across multiple environments.
Alerting and notification capabilities are another area where Grafana really shines, as users have full control over configuring their alerts based on the data being collected. Users are able to define an alert rule upon which notifications should fire once certain condition has been met. Notifications themselves can be sent via email, Slack integration and/or PagerDuty.
To show you how much you can do with Grafana dashboards we’ve collected the top open-source Grafana visualisations and reports to inspire you to get started with this leading data visualisation tool.
How to create a Grafana Dashboard
Creating a dashboard in Grafana is particularly simple, the complexity tends to come from the initial configuration of Grafana. However, this can be completely removed by opting for a hosted solution such as hosted Grafana from Logit.io. With our solution, you gain all the best features of Grafana but without all the time-consuming and challenging configuration and maintenance, as this will be handled by us. If you’re interested in finding out more about hosted Grafana from Logit.io, don’t hesitate to reach out or begin exploring the platform for yourself with a 14-day free trial.
Below we’ve outlined how you to create a dashboard in Grafana. This method is also applicable for hosted Grafana from Logit.io, just select ‘launch’ next to Grafana from the dashboard and follow the instructions listed below.
Create a dashboard: Once logged in, click on the "Create" button in the left-hand sidebar to create a new dashboard.
Add panels: A Grafana dashboard consists of panels, which are individual visualizations or data displays. To add a panel, click the "Add new panel" button on the dashboard.
Configure panels: After adding a panel, you can configure it by clicking on its title or the gear icon in the top-right corner. Depending on the panel type (e.g., Graph, Singlestat, Table), you'll have different configuration options.
Customise the dashboard: Customize your dashboard layout by clicking the "Settings" (gear icon) on the top-right corner of the dashboard. Here, you can set the dashboard title, define time ranges, apply themes, and adjust other dashboard-level settings.
Add rows and panels: You can organize your panels into rows to create a more structured layout. To add rows, click the "+" icon on the left sidebar and choose "Add Row." You can then add panels to each row.
Configure data sources: Grafana connects to various data sources to fetch data for your panels. You need to configure data sources before creating panels. To configure data sources, click on the gear icon in the left sidebar, select "Data Sources," and add the data source relevant to your use case.
How has Grafana grown in recent years?
Grafana has experienced significant growth in recent years, with its launch in 2014 marking the beginning of its success story. Over time, the platform has garnered increasing recognition and adoption, resulting in a remarkable expansion. This growth trajectory reached a significant milestone in 2021 when Grafana secured an impressive $220 million in funding during its latest funding round. The substantial investment highlights the thriving popularity of Grafana and emphasizes the increasing number of individuals who are recognizing and appreciating its value. The platform's noteworthy journey demonstrates its continuous growth and the wide-scale appeal it has gained among users.
How can Grafana be used for Docker monitoring?
Grafana can be utilized effectively for Docker monitoring, providing a comprehensive solution for Docker users seeking to manage and monitor their deployments. By employing Grafana, users can keep tabs on crucial statistics such as CPU, memory, disk usage, and traffic. The monitoring dashboard specifically designed for Docker showcases insightful details such as average, maximum, and current values for each tracked metric.
One of the notable advantages of using Grafana for Docker monitoring is its user-friendly nature. With minimal configuration required, it seamlessly integrates into Docker environments. This means that users can start benefitting from the monitoring capabilities right out of the box, without the need for tedious and complex setup procedures.
The positive reviews and feedback received by Grafana's Docker monitoring solution further attest to its efficiency. With this tool at hand, users gain a broad overview of their entire deployment, allowing them to quickly detect and address any issues that may arise. Grafana's Docker monitoring offers an effortless way to stay informed about the performance and health of Docker containers, making it an ideal choice for Docker users who value efficiency and ease-of-use in their monitoring process.
How can Grafana be used for virtual machine monitoring?
Grafana can be effectively utilized for monitoring virtual machines. By utilizing Grafana, users can track crucial metrics such as CPU usage, memory usage, network activity, and filesystem usage of their virtual machines.
Notably, this tutorial incorporates an intelligent alerting system, which leverages Slack to promptly notify users if any of the monitored metrics surpass the defined thresholds. Additionally, this monitoring solution relies on Prometheus, along with node-exporter, to gather and visualize the metrics effectively on the Grafana dashboard. Overall, Grafana proves to be an excellent tool for efficient virtual machine monitoring, offering comprehensive insights and proactive alerting capabilities.
What information does the Grafana dashboard for Node exporter provide?
The Grafana dashboard for Node exporter provides a vast range of information, presenting almost every value exported by the Prometheus Node exporter. Users can explore an extensive selection of dials and graphs, which provide an in-depth understanding of the Node's performance. Additionally, the dashboard offers expandable panels located at the bottom of the interface, which further enrich the available information. This comprehensive overview caters to the needs of Node developers, offering a wealth of data to satisfy their hunger for information. With this dashboard, users can effortlessly monitor and analyze various Node metrics, gaining valuable insights into Node's activities.
Why were these specific Grafana examples chosen?
These specific Grafana examples were carefully selected based on various factors. Firstly, some of these dashboards were chosen for their technical excellence, demonstrating the powerful capabilities of the Grafana platform. These examples showcase how the platform can handle complex data visualizations and analytics, serving as an inspiration for users looking to explore its potential.
Furthermore, the selected dashboards are also remarkable for their interesting range of use cases presented, which highlight the versatility of the Grafana platform. These unique implementations demonstrate that Grafana can be utilized in diverse ways, encouraging new users to think outside the box and explore innovative possibilities for their future monitoring projects.
1. Server Monitoring
 Credit: @Hector Smith
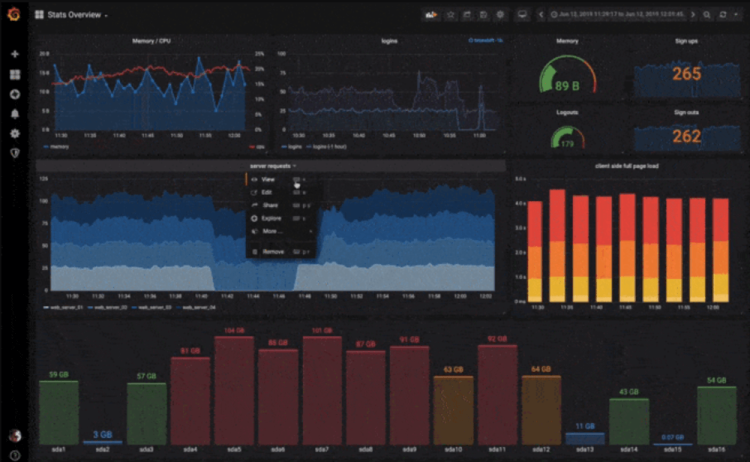
As the vast majority of Sysadmin’s realise, server monitoring is an essential part of monitoring the overall health of your environment.
This reporting dashboard uses a combination of Grafana, Prometheus & Node Exporter to allow you to pinpoint the root cause behind servers going down and enables you to take preemptive steps if you find you are running low on available disk space.
2. Lighthouse Metrics Report
 Credit: @WikiMedia
Whilst many marketing specialists may not have much awareness of Grafana we think it is no excuse for not delving into its capabilities and experimenting, as this example above shows.
This dashboard displays all of the metrics that are included within Google’s own Lighthouse report and provides a way of being able to dive deeper into these metrics at any time without the need to perform a new audit from scratch.
Unlock complete visibility with hosted ELK, Grafana, and Prometheus-backed Observability
3. Weather Forecast
Credit: @WeatherflowCollector
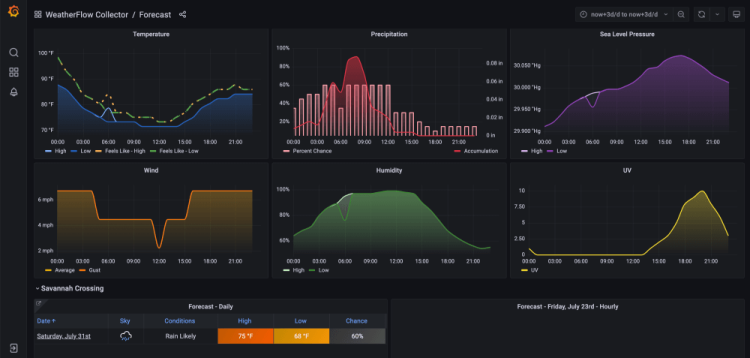
This Grafana dashboard example can be used to view weather conditions, upcoming forecasts, overall temperature & precipitation.
As this dashboard is hosted by Grafana's gallery you are free to experiment with the live dashboard within your browser, saving you from having to configure your own local setup to start improving your knowledge of this data visualisation tool.
Want to recreate this dashboard for yourself? Then check out the original creator’s Github repo.
4. Performance Testing
 Credit: @Nigel Mulholland
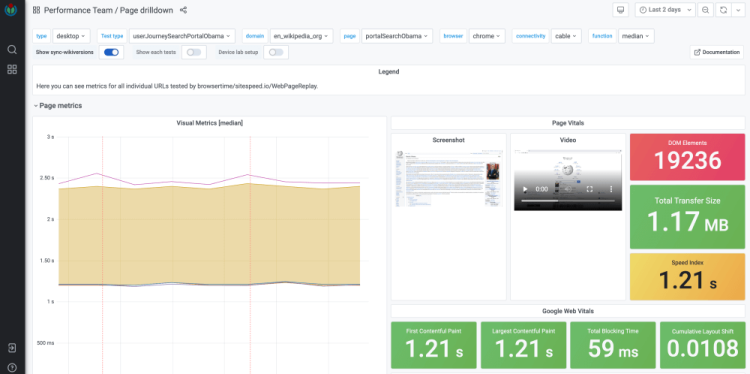
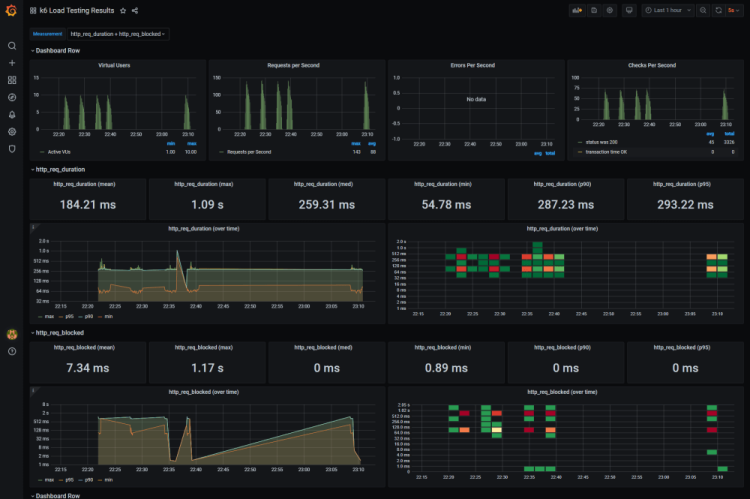
Being able to conduct reliable performance testing is vital for assuring the quality of software that you are releasing to your users.
By putting workload and pressure against your system you can analyse if it behaves as expected or if you need to do further work to improve your code or scale up your operations to meet the demands of high traffic load
5. Monitoring Global ISP Latency
 Credit: @Tehlo
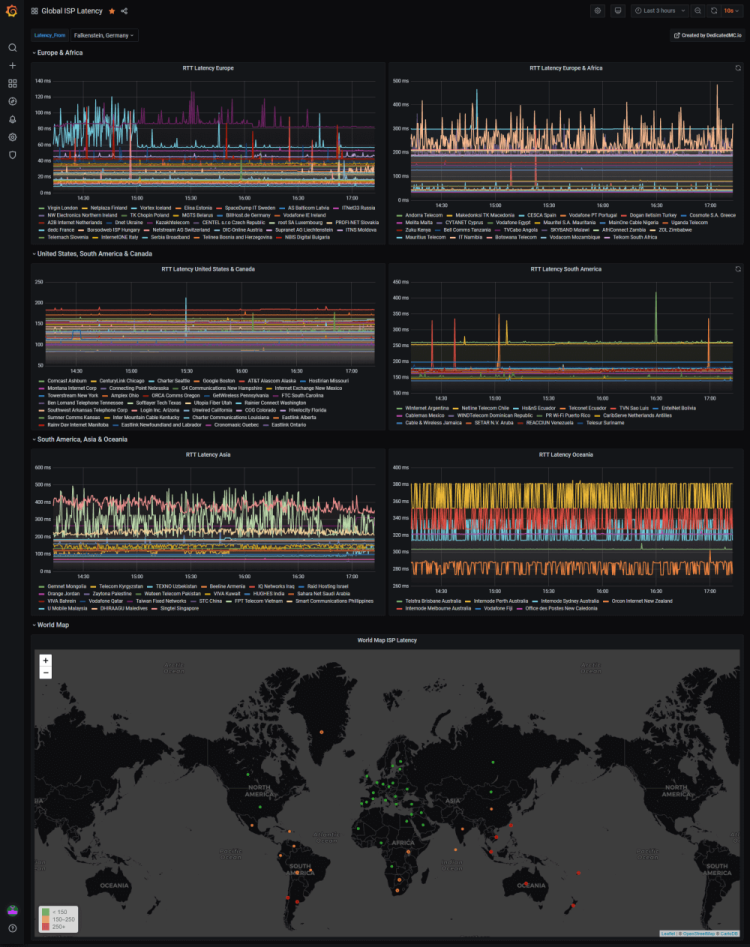
This Grafana Dashboard uses InfluxDB and Telegraf to display the latency of over two hundred ISP endpoints from around the world.
The original creator of this intuitive dashboard created this as they host a gaming company and wanted to give their users the best possible experience by being able to explain that a
6. Windows Host Monitoring
 Credit: @David Stephens
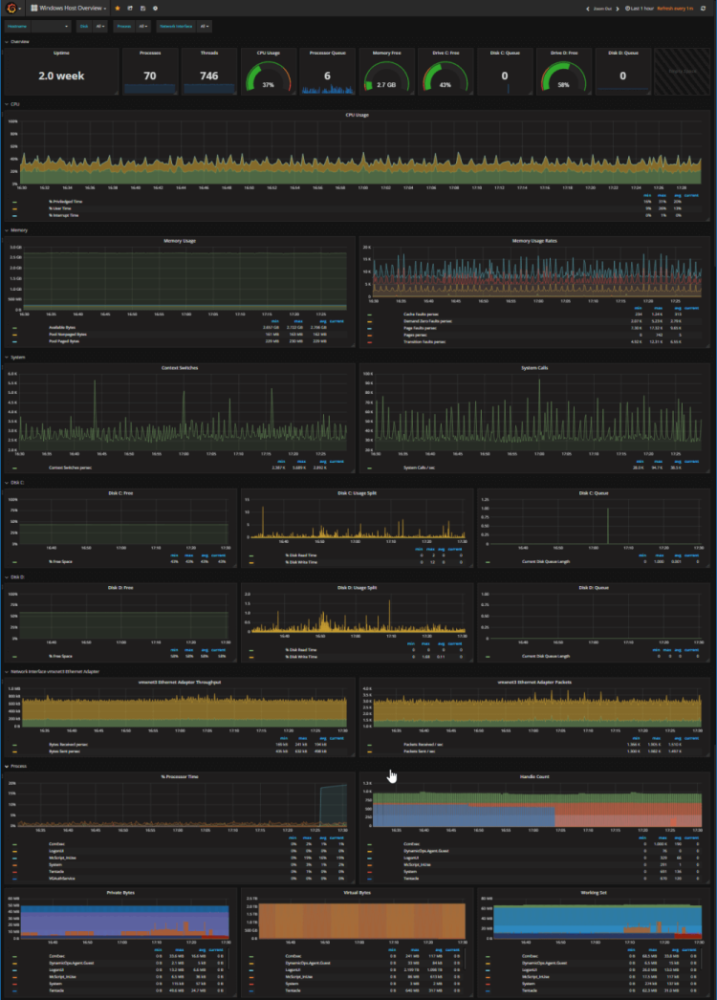
If you want to see the memory usage, processes, threats and CPU usage of your Window's hosts then you should consider using Grafana to create the dashboard above to give you full visibility into the performance of your Window's host.
Credit: @David Stephens
If you want to see the memory usage, processes, threats and CPU usage of your Window's hosts then you should consider using Grafana to create the dashboard above to give you full visibility into the performance of your Window's host.
This dashboard requires integration with Telegraf and Influxdb, otherwise, there will be panels that are not populated with data as a result.
7. OpenVPN Connection Monitoring
 Credit: @Hassan Momin
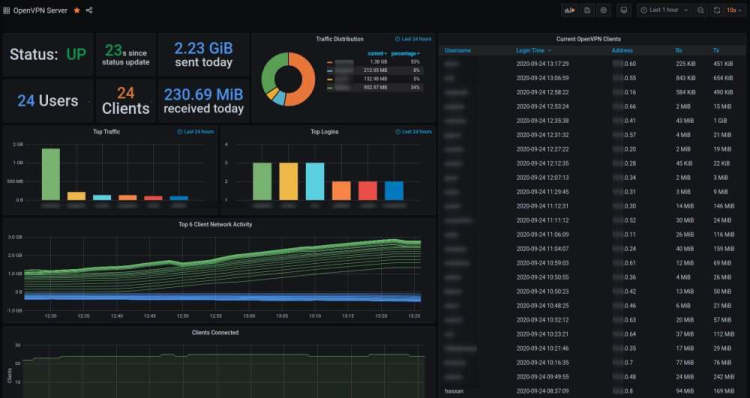
As well as using Grafana, this dashboard also uses Prometheus to monitor OpenVPN connections. This report displays status, time since status update, data sent and received today alongside the number of users and clients.
If you want to have a go at creating your own monitoring service for OpenVPN then check out this guide.
8. Tracking Udemy Progress
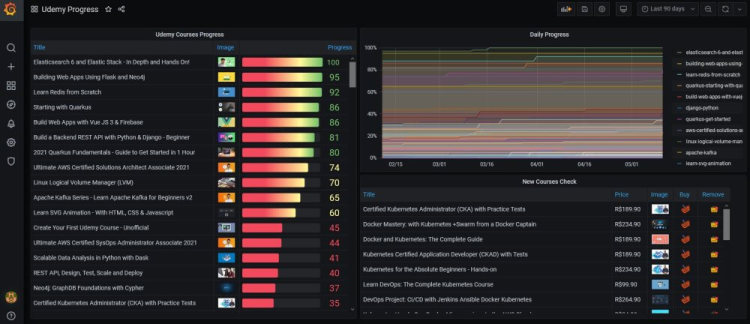 Credit: @crashlaker
This unique report uses Loki alongside Grafana for tracking the user’s progress on completing their Udemy courses by percentage and daily progress.
Credit: @crashlaker
This unique report uses Loki alongside Grafana for tracking the user’s progress on completing their Udemy courses by percentage and daily progress.
This dashboard took an admirable degree of manual work by the original creator (as they encountered limits when using Udemy's official API for data scraping).
If you want to grab your own copy of this Grafana dashboard template then you may be waiting a while as the original creator hasn't linked their guide yet. As soon as they have, you can be sure that we'll add it to this post!
9. Fitbit Health Monitor
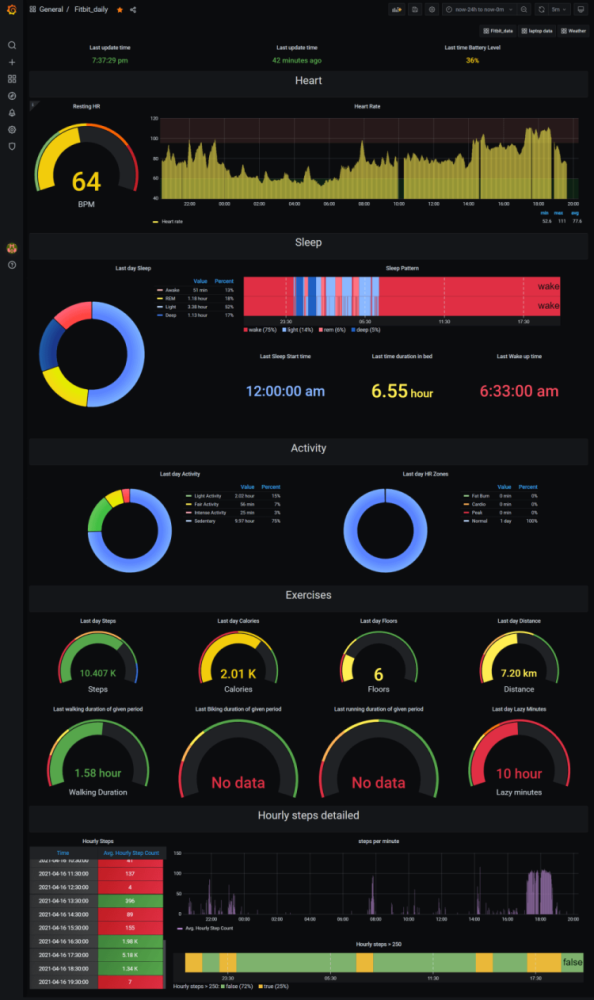 Credit: @Arpanghosh8453
The next dashboard in our list of the most ingenious ways to use Grafana uses the Fitbit API to pull together key metrics regarding heart health, activity, calories burnt and sleep quality of whoever is using the device being measured.
If you want to have a go at creating this dashboard for your own health and activity monitoring, then why not have a browse of the original Github repo?
10. TrueNAS Dashboard
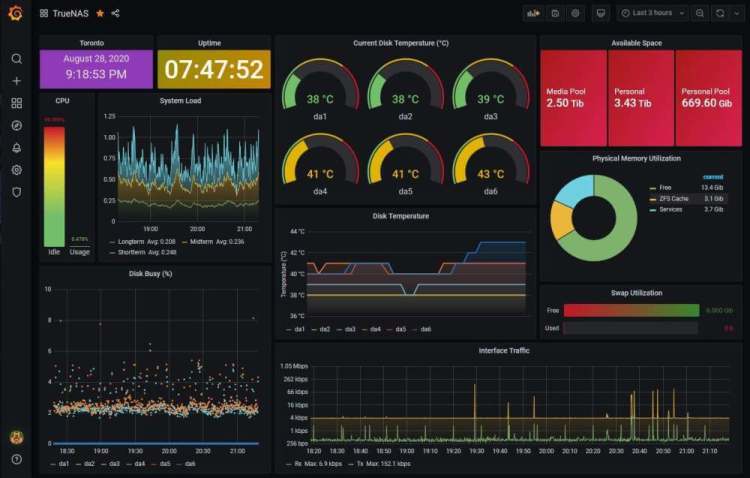 Credit: @thinhla
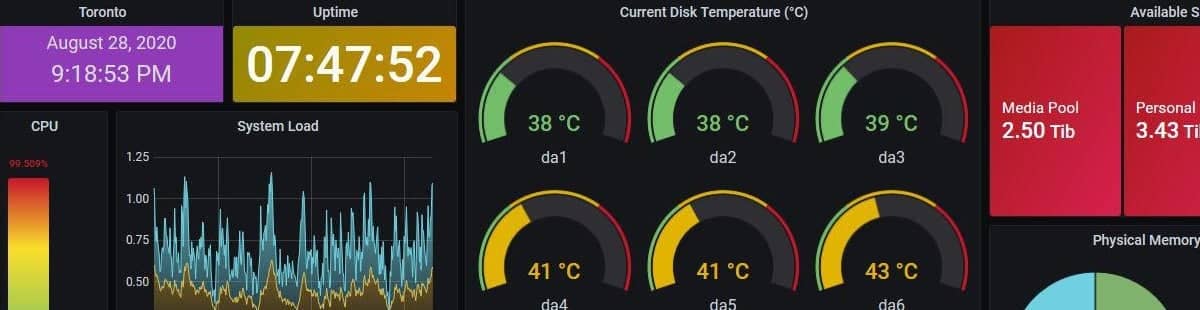
TrueNAS is a Network Attached Storage (NAS) software that shares and protects data from modern-day threats like ransomware and malware.
This report captures the full performance of your TrueNas devices and displays key metrics including: location, uptime, current disk temperature, available disk space, disk busy and interface traffic levels.
11. Homelab Monitoring & Cost Analysis
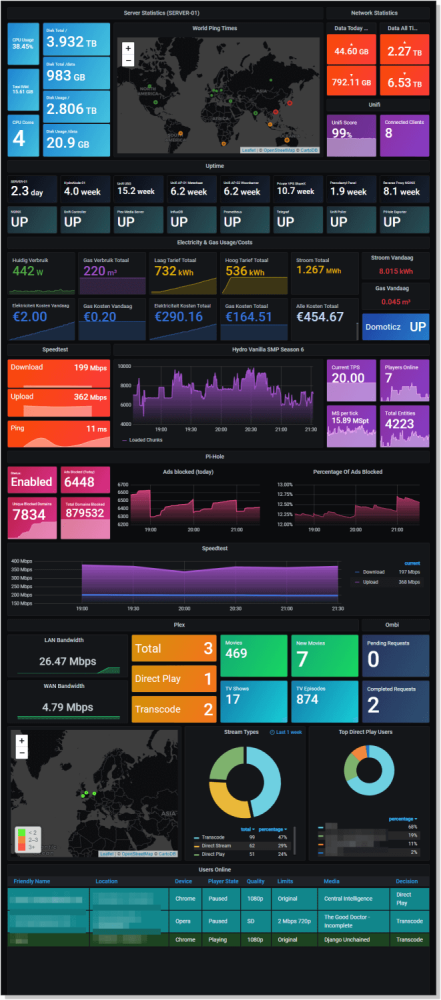 Credit: @Tehlo
This homelab dashboard is in a league of its own and was one of our favourite uses of Grafana out of the examples we considered for this roundup.
This highly detailed visualisation centralises not only server and network statistics but also displays the gas and electricity costs associated with this comprehensive homelab setup.
If you want to get your hands on the template to create this homelab monitor for yourself then you’ll need to head on over to the Github repo for the project.
12. Forecasting Stocks
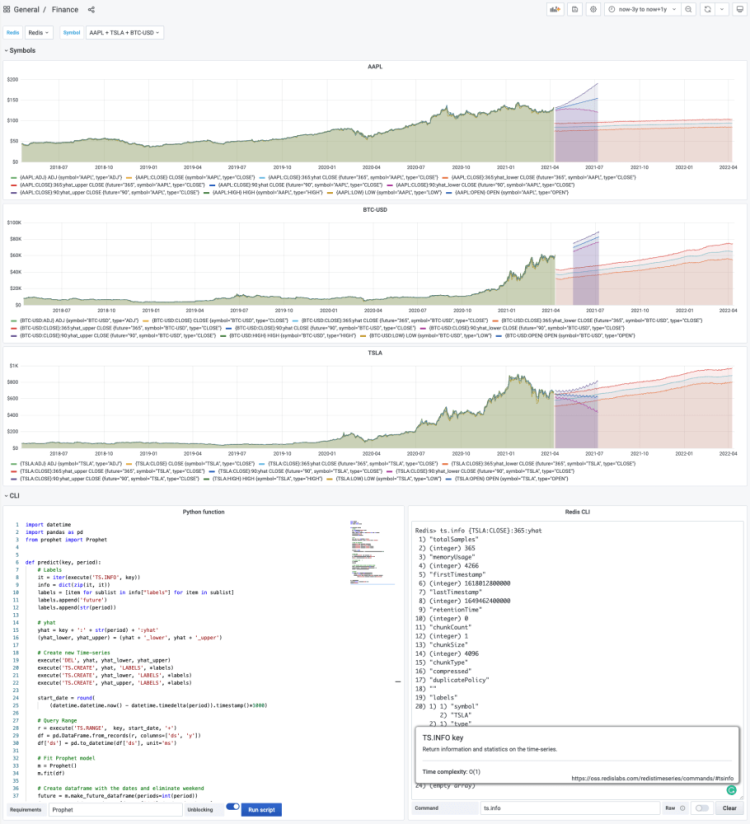 Credit: @Mikhail Volkov
This ingenious dashboard combines using the Redis Application plug-in with Grafana alongside Facebook's Prophet model to predict prices of stocks and forecast future cryptocurrency prices.
13. Docker Monitoring
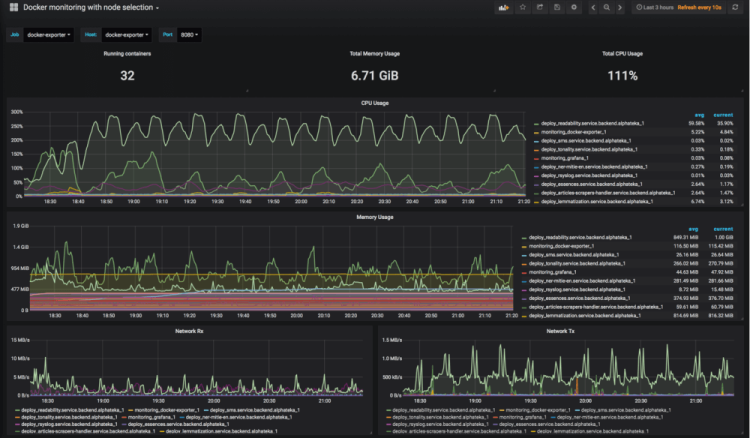 Credit: @Nazar
Another one of Grafana’s key use cases is its capability for container monitoring as shown in the example above regarding Docker monitoring.
The view configured above displays the following essential metrics with clarity: total running containers, total memory usage, total CPU usage, network RX & network TX.
When it comes to avoiding container bottlenecks, monitoring is the best safeguard you can have to ensure visibility of the performance of your containerised applications and overall infrastructure.
14. SSL Expiry Tracker
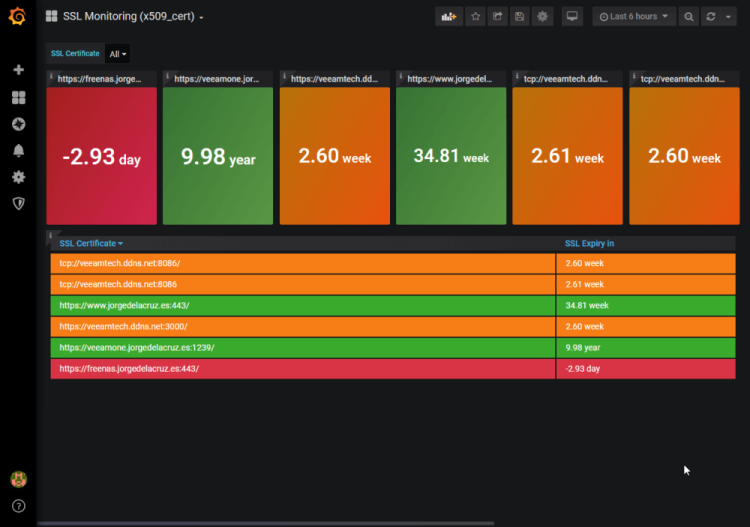 Credit: @Jorge de la Cruz
If you own numerous domains then you might quickly find that monitoring the validity of all of your SSL certificates to be quite tedious and you may require a dashboard to improve your visibility of when your certificates are due to expire.
This SSL monitoring dashboard uses Grafana & InfluxDB to show you which certificates are valid, which are expiring soon and which ones have already expired (and by how many days).
By proactively monitoring your SSL certificates you can take further steps to avoid outages and subsequent loss of revenue and damage to your brand's reputation as a result of not being available to your customers.
15. AWS Billing Estimator
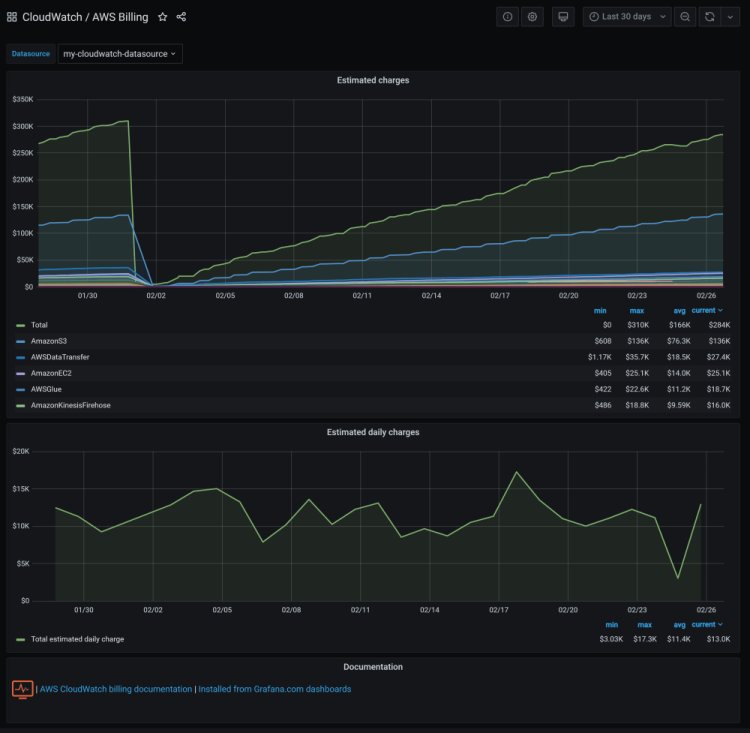 Credit: @Monitoring Artist
As AWS billing is often known for being quite hard to predict, we are sure that many AWS users will find the Grafana dashboard above to be a good workaround for estimating their monthly and daily charges.
This view also splits out individual AWS services by cost, allowing you to see charges for S3, EC2, Glue & Kinesis side by side.
16. Kubernetes Cluster Monitoring
 Credit: @Pivotal Observability
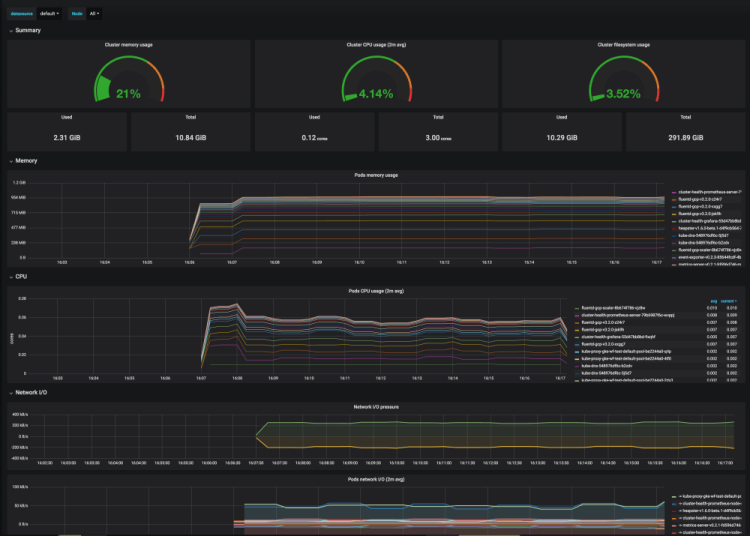
If you are a developer that already uses Kubernetes, then you’ll know firsthand just how important it is to actively monitor Kubernetes clusters to ensure that resources are being used efficiently.
For this use case, Grafana provides an alternative Kubernetes dashboard for analysing which nodes are contributing to workload bottlenecks and see metrics relating to pod CPU usage, network I/O pressure and memory usage split out by pod.
17. GitLab CI Pipeline Status
 Credit: @Mvisonneau
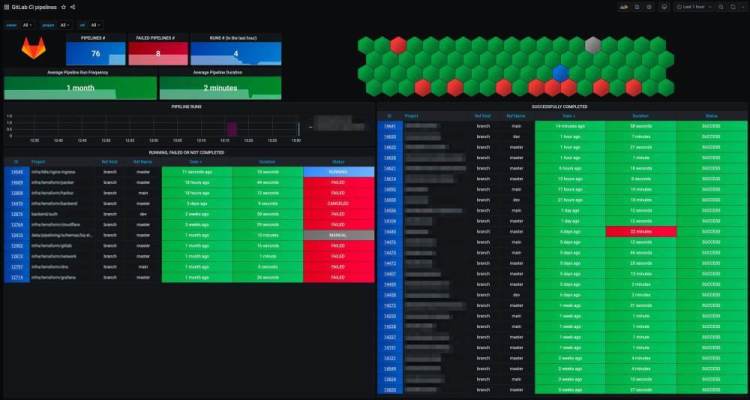
In case you were not already familiar with all of GitLab's key features then you might not know that they provide a continuous integration service that builds and tests code as you push it to the application.
If you already use GitLab CI or wish to get started with this feature then you may soon find the Grafana dashboard we’ve included above useful. This dashboard displays total pipelines, any failures, pipeline runs within the last hour, successfully completed jobs and the average pipeline runtime duration.
If you are new to using Gitlab or have only used Github in the past then why not check out our expert-led review comparing Github vs Gitlab?
18. Kong Monitoring
 Credit: @KongHQ
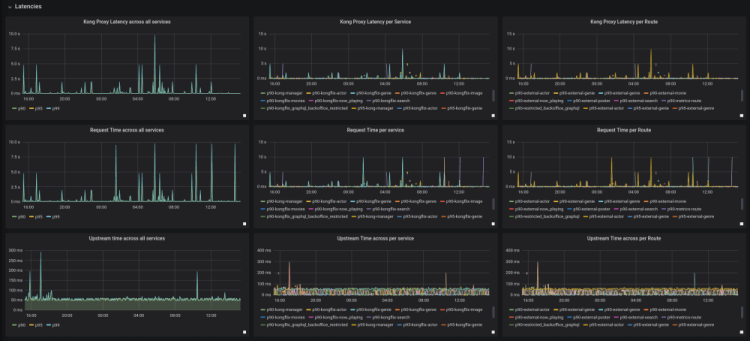
Kong is a popular API gateway that serves as middleware and extends the capabilities of APIs through the use of additional plugins.
This dashboard example allows you to visualise total requests per second (RPS), requests per service, Kong memory usage by Node as well as Nginx connection states shown by time-series graph.
You can even find a similar and simpler dashboard and function in Google Apigee. However, you can compare Apigee vs Kong based on your requirements and decide which one works for you.
19. Alertmanager Visualisation
 Credit: @Shubham Choudhary
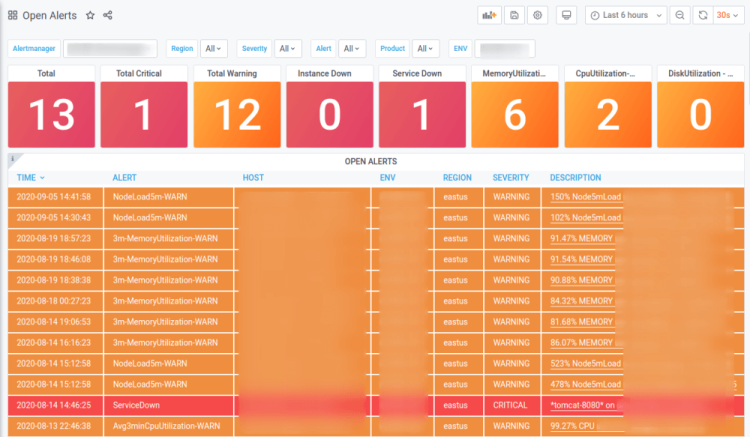
When the creator of this dashboard was tired of manually searching for specific alerts through Slack, teams & emails they soon found out that there was a far better way of displaying this information concisely using Grafana and Prometheus.
By using Alertmanager's API as a data source for Grafana the software engineer behind this tutorial was able to bypass using the default Alertmanager UI.
As a result of implementing this reporting dashboard, the cognitive load was reduced among the team and it also made prioritising highly important errors easier which assisting in reducing the organisation's overall MTTR (mean time to recovery).
20. Monitoring Spring Boot Microservices
Credit: @Firas Messaoudi
In our next example of a dashboard that uses Grafana alongside Prometheus, we've found a great example of how you can get started with monitoring your Spring Boot microservices.
Spring Boot is a popular choice for developers that wish to create production-ready applications swiftly, so we are sure that many of our readers will find this animated tutorial helpful to your next microservice led project.
If you are new to the concept of microservices then why not check out our article on Microservices vs APIs?
21. Spark Streaming Monitoring
 Credit: @Dima Statz
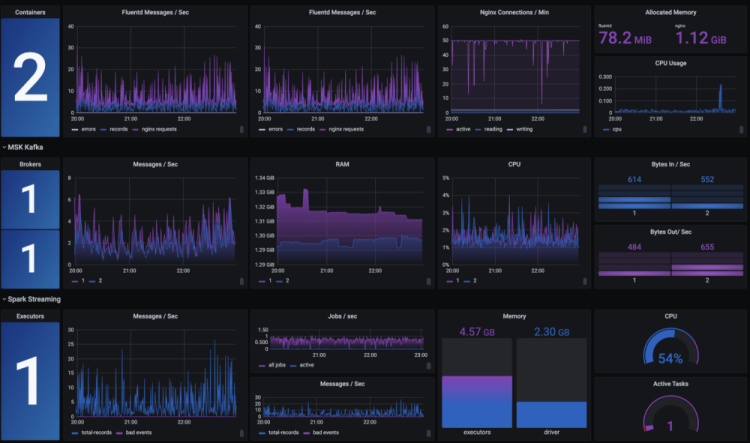
Software architects can use this Grafana dashboard alongside Prometheus to monitor streaming from Apache Spark on Kubernetes.
This dashboard can be used to provide a monitoring and alerting alternative to those who are used to using managed solutions such as AWS EMR or Azure Databricks but wish to build their own in-house reporting solution.
Want to get started with creating your own Grafana dashboards? Then sign up today for our managed Grafana platform and start creating dashboards within minutes with our 14-day free trial, no credit card required.
22. HDD Temperature Monitor
 Credit: @anywhoever
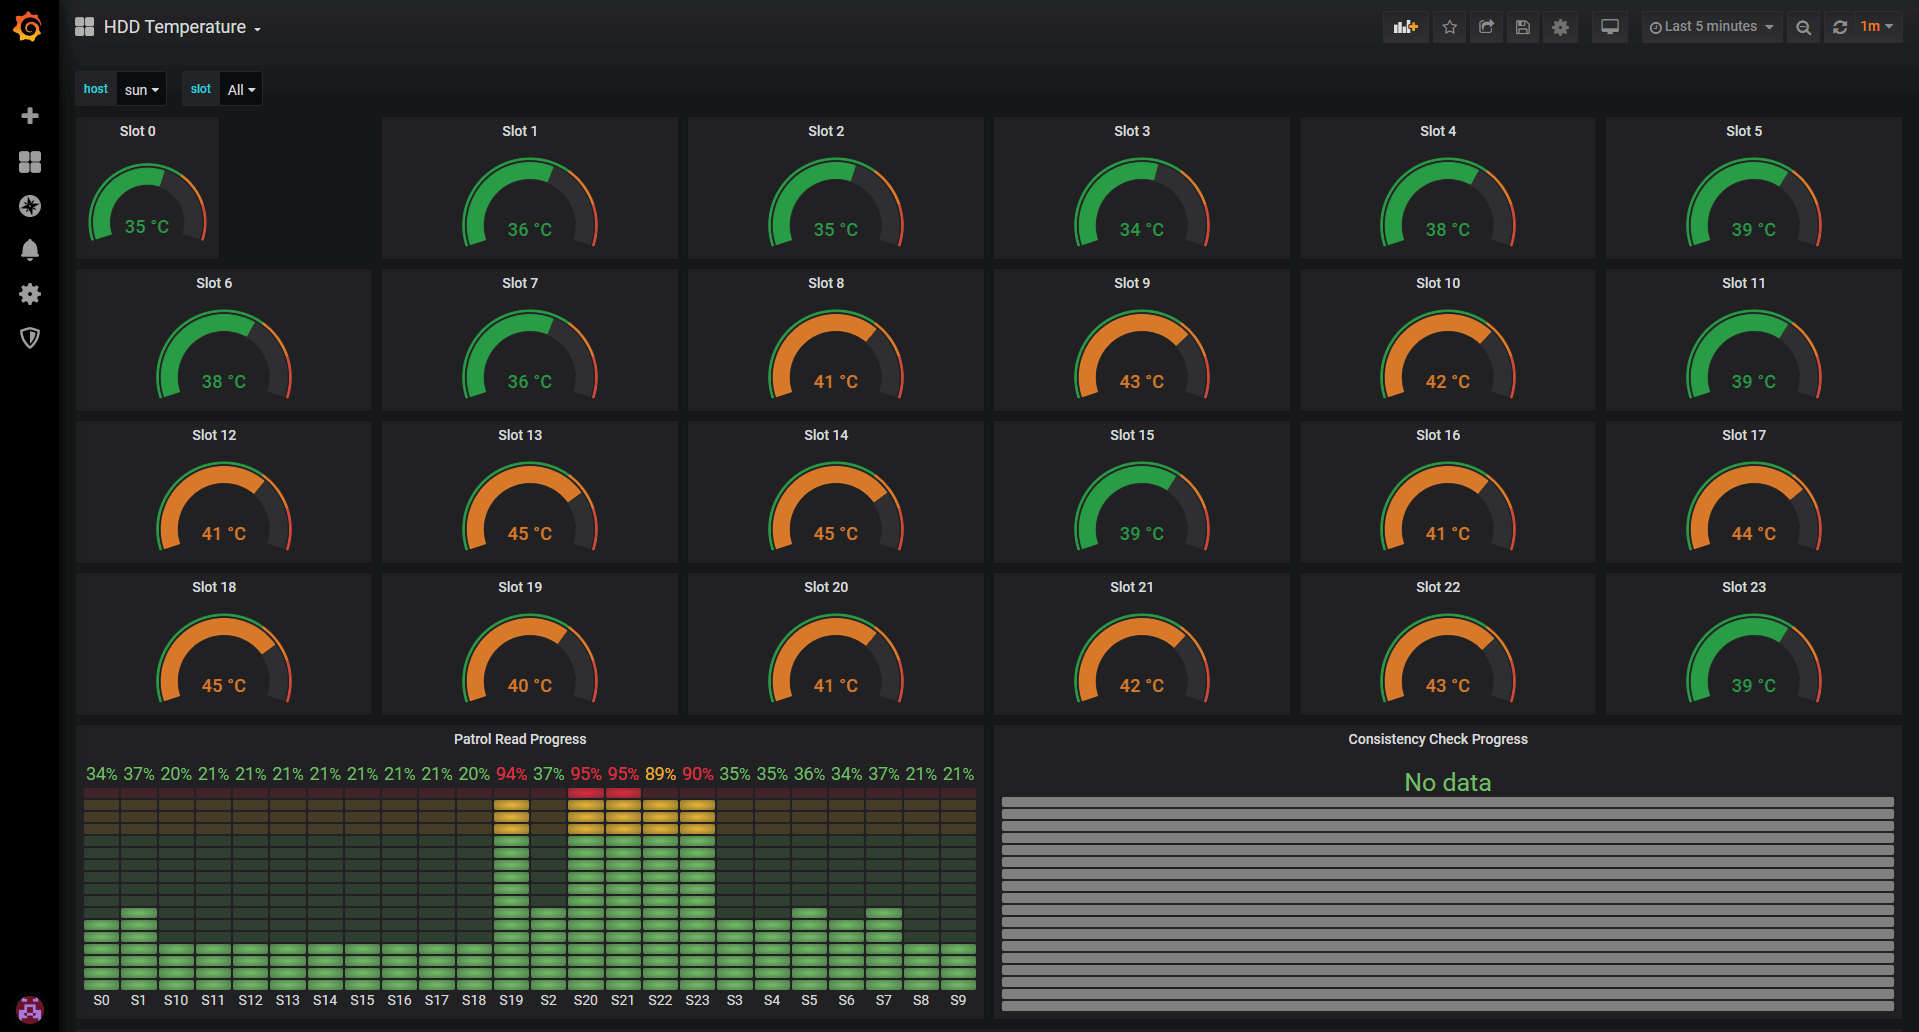
Hardware specialists state that the average HDD temperature should be around 35 Celcius, so if your set-up is often far hotter than this you may wish to invest in a solution that offers hard drive cooling.
It is one thing knowing what temperature you should meet but dynamically monitoring all of your HDDs is another use case for monitoring entirely. This Grafana dashboard provides clarity and awareness to the user to let them know if they should be concerned with the current state of their hardware’s temperature.
23. Nextcloud Audit Log Dashboard
 Credit: @tvojamatka
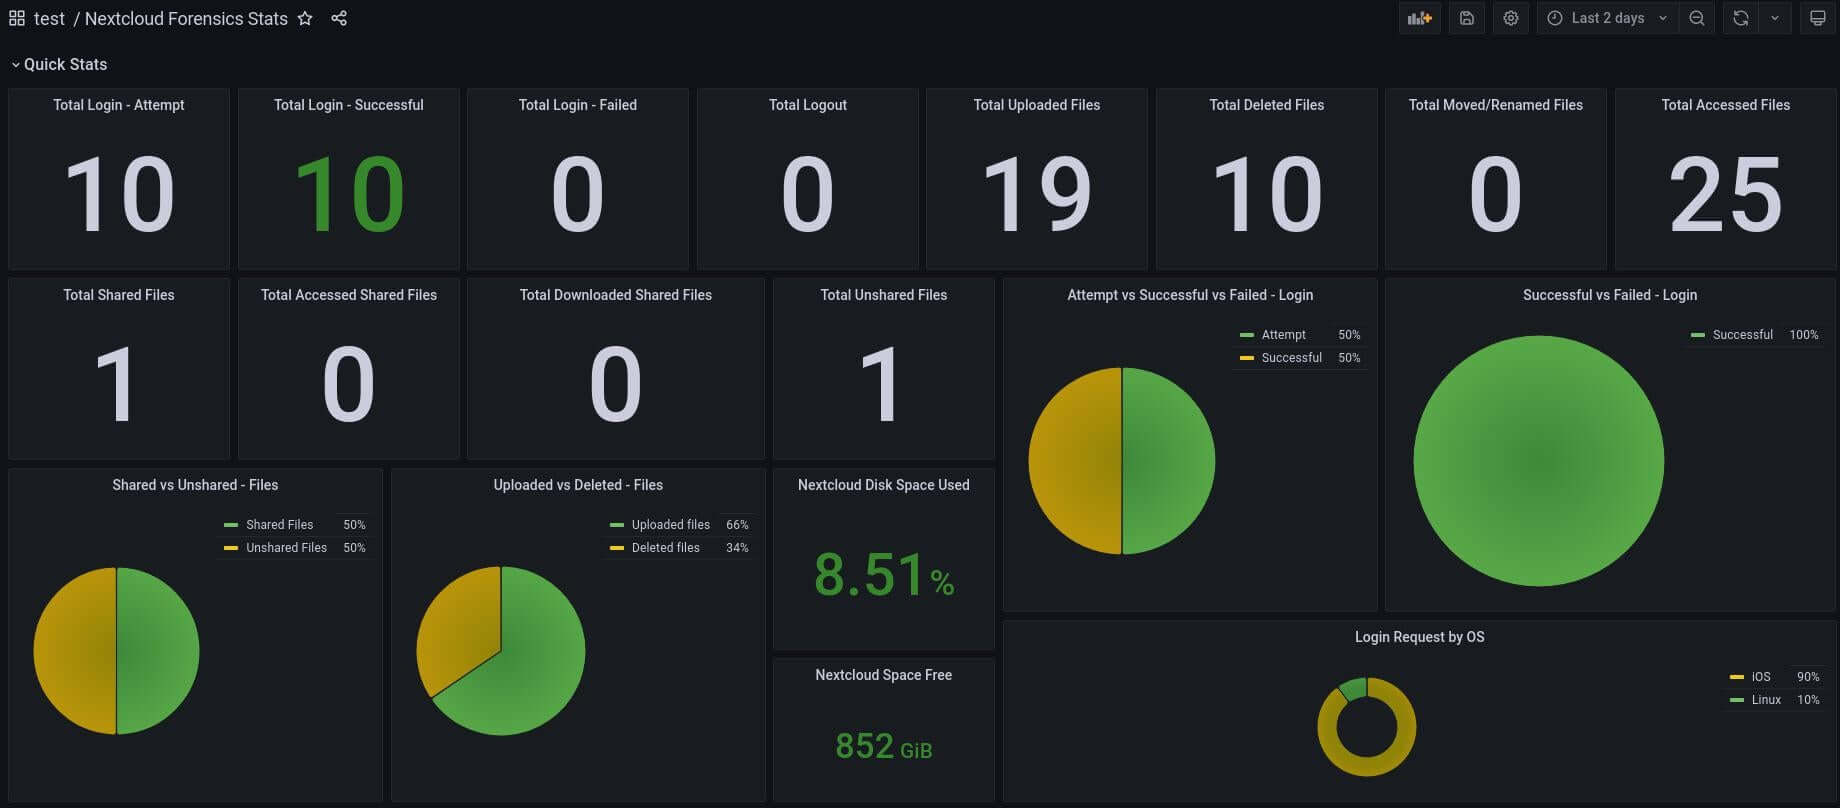
If you are looking to monitor the activity of your Nextcloud server, then hopefully our next Grafana dashboard will inspire you to get started with reporting on the metrics that matter to your system's performance.
As you can see from the preview above, this forensic dashboard captures total logins, total uploaded files, total shared files, as well as total failed logins and total accessed files.
For this dashboard to work, this setup requires integration with Loki and Promtail, the latter of these integrations aids with the collection of logs, much like how Logstash works as part of the ELK Stack.
24. Strava Monitoring Dashboard
 Credit: @Grafana Labs
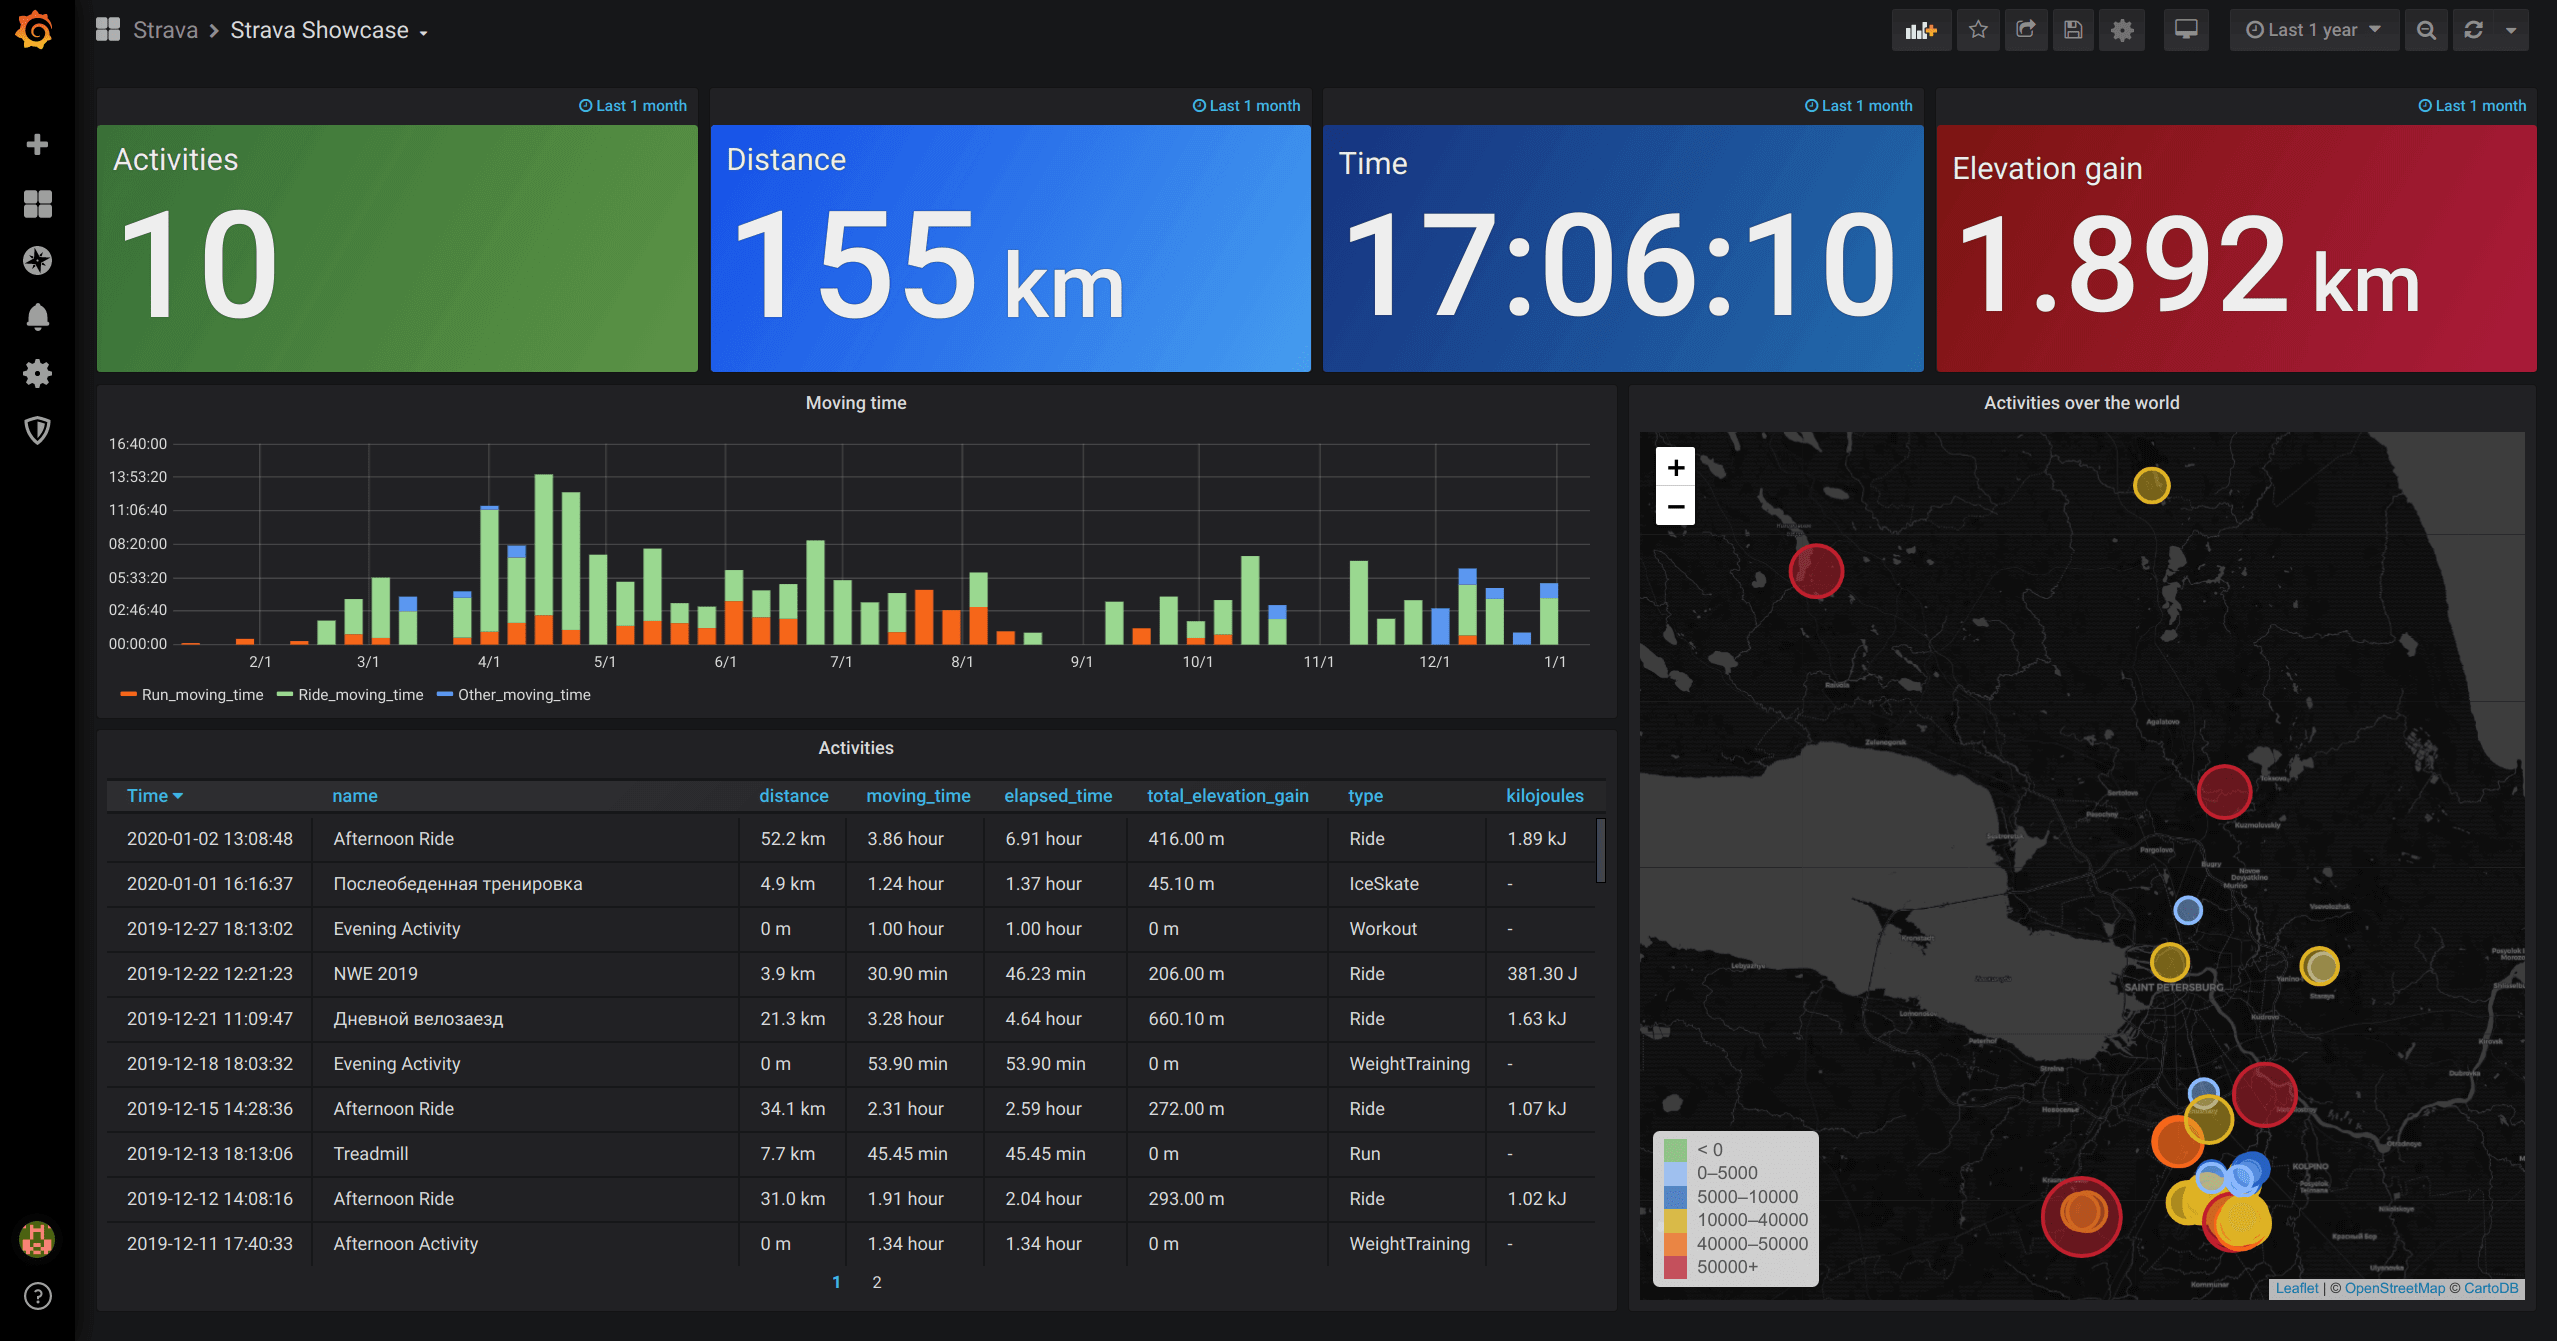
For another health and wellness-themed addition to this list, we’ve found an example dashboard that displays usage metrics from the popular cycling and running platform Strava.
As this dashboard is yet another example dashboard that is hosted by Grafana's gallery you are also free to download this visualisation to experiment with and configure for use on your own machine.
25. Monitoring Linux Processes
 Credit: @SCHKN
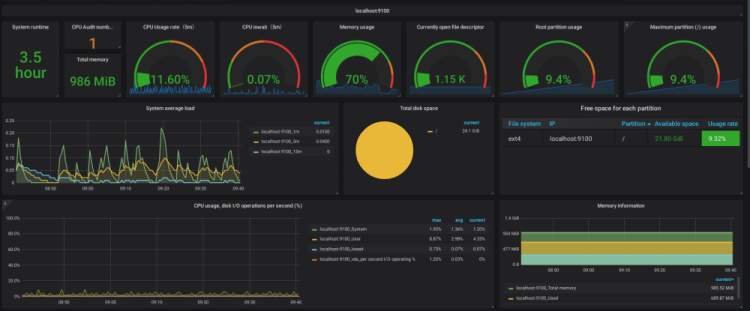
This reporting dashboard uses Prometheus in addition to Grafana to monitor Linux machine processes. This monitoring dashboard is likely to be useful to both DevOps and Linux system administrators and anyone else whose role values tracking server performance metrics.
This report helps to highlight which of your instances are running too slowly, as well as also displaying unresponsive instances that have happened as a result of unresolved bottlenecks.
If you wish to attempt creating this dashboard for yourself then you may wish to follow the steps outlined in this tutorial.
26. Monitoring Redis
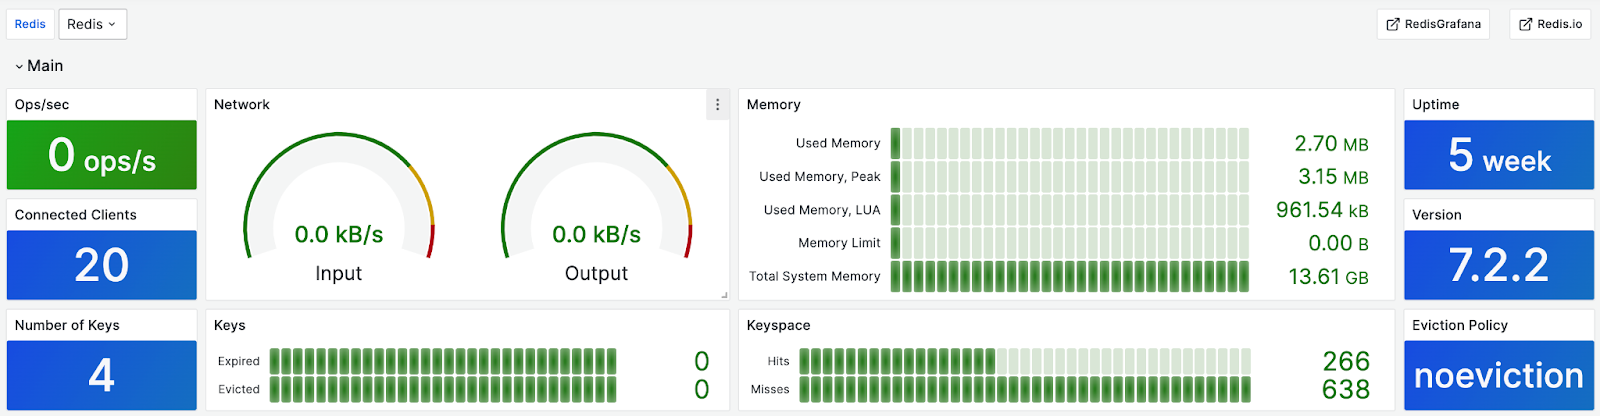
Redis is an extensive Open-source database, the tool is ideal for caching and data storage, as well as streaming and messaging. This Grafana dashboard provides monitoring capabilities for Redis, allowing users to clearly view metrics such as total system memory, used memory, and uptime.
If you wish to recreate this dashboard, you can view it here and learn more about the range of metrics provided for monitoring Redis.
27. Graphite
Graphite is a time-series database and visualization system utilized for monitoring and analytics, that can work equally well on when used on premise or cloud infrastructure. This Grafana dashboard supplies metrics for Graphite.
If you want to replicate this dashboard, access it here to explore the multiple metrics available for monitoring Graphite.
28. Grafana Billing Dashboard
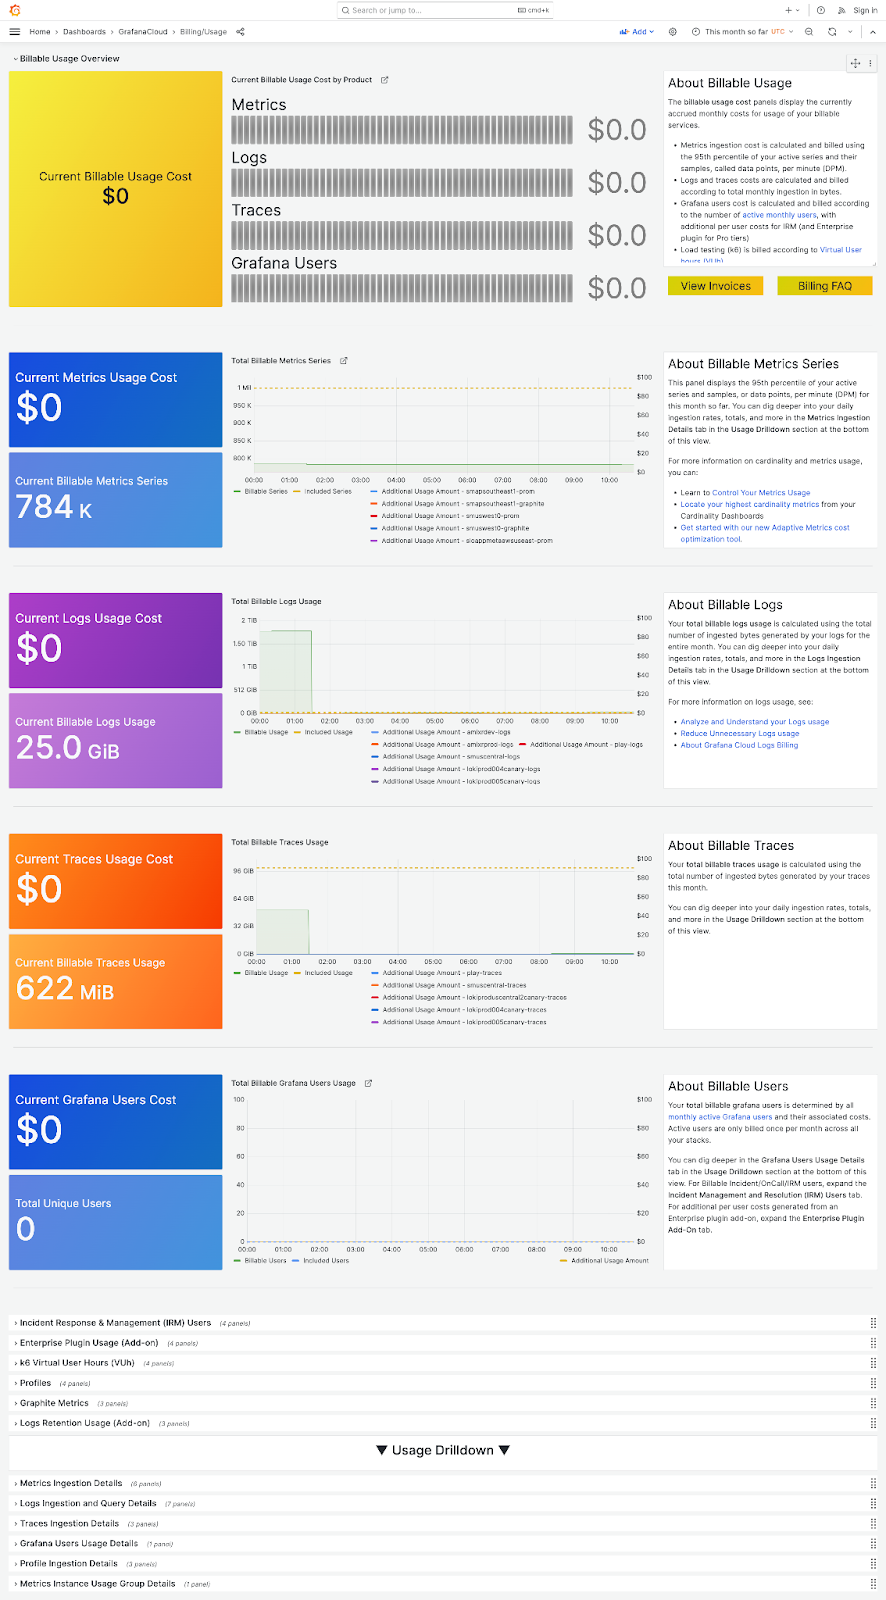
This Grafana billing usage dashboard is a powerful visualisation offering real-time insights into monthly costs associated with billable services. Providing a holistic view, it displays metrics, logs, traces, and user data, aiding in resource optimization. Users can conveniently access invoices and billing FAQs, promoting financial transparency and efficient cost management. To ensure seamless financial operations, it also clearly outlines the invoice payment terms, helping users understand the due dates, accepted payment methods, and any applicable penalties for late payments.
29. Kubernetes Integration Efficiency
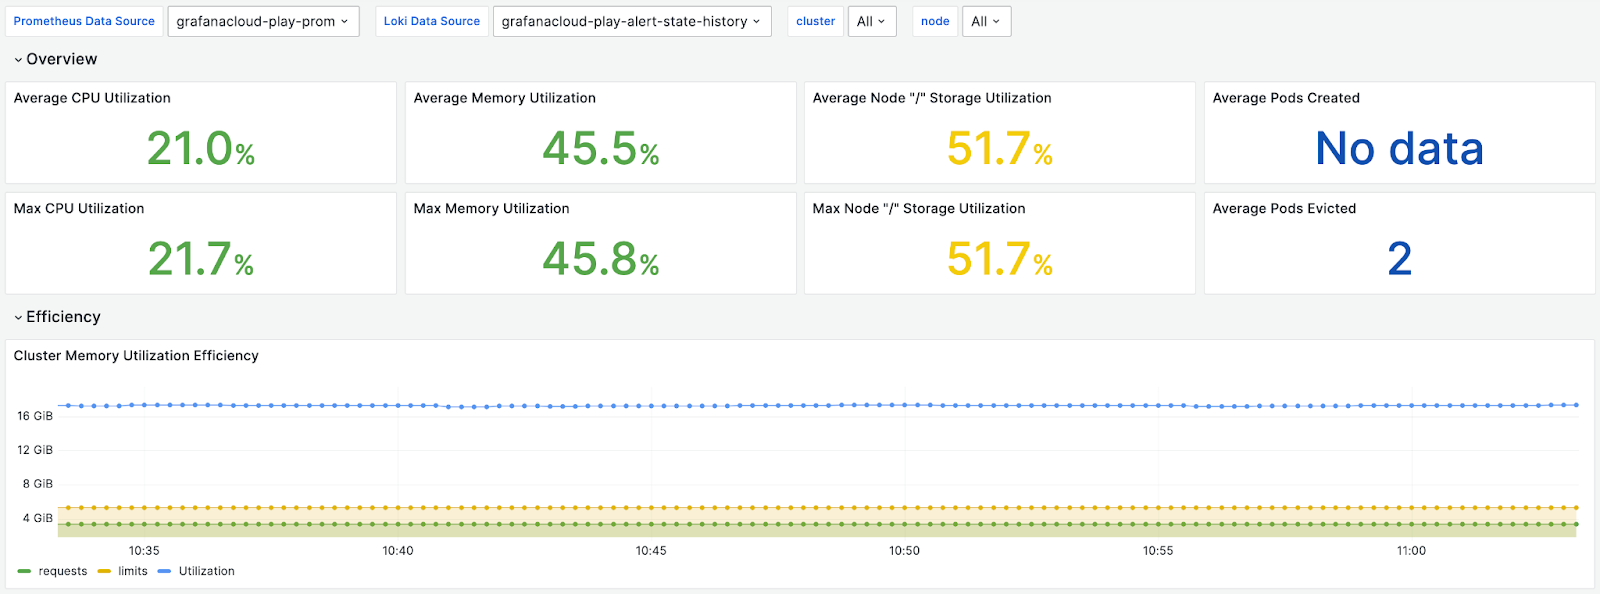 With the Kubernetes integration efficiency dashboard, you can easily view and monitor a range of metrics associated with the efficiency of your cluster. For example, you can monitor, average CPU utilization, average memory utilization, max CPU utilization, and cluster memory utilization efficiency.
Monitoring this enables you to acquire a complete picture of the performance and efficiency of your cluster. This allows you to maximise resources.
30. Loki NGINX Logs
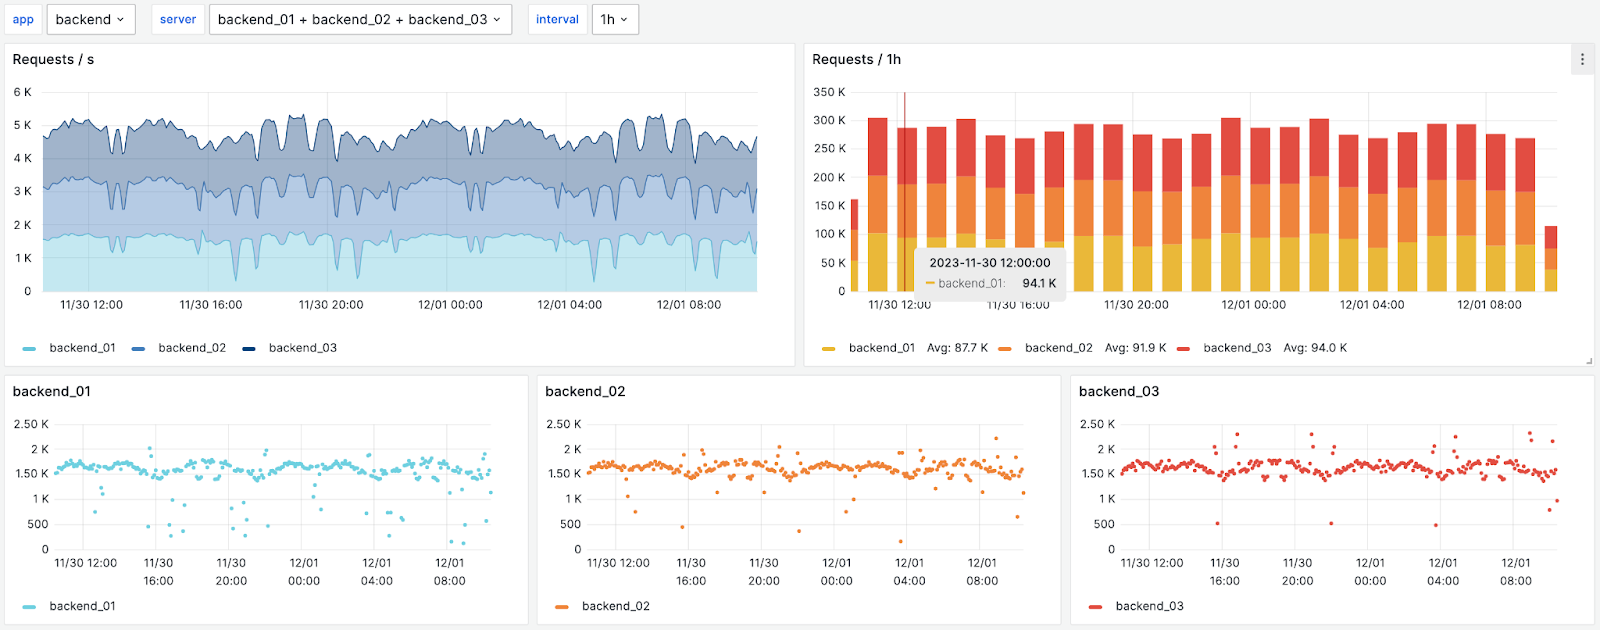
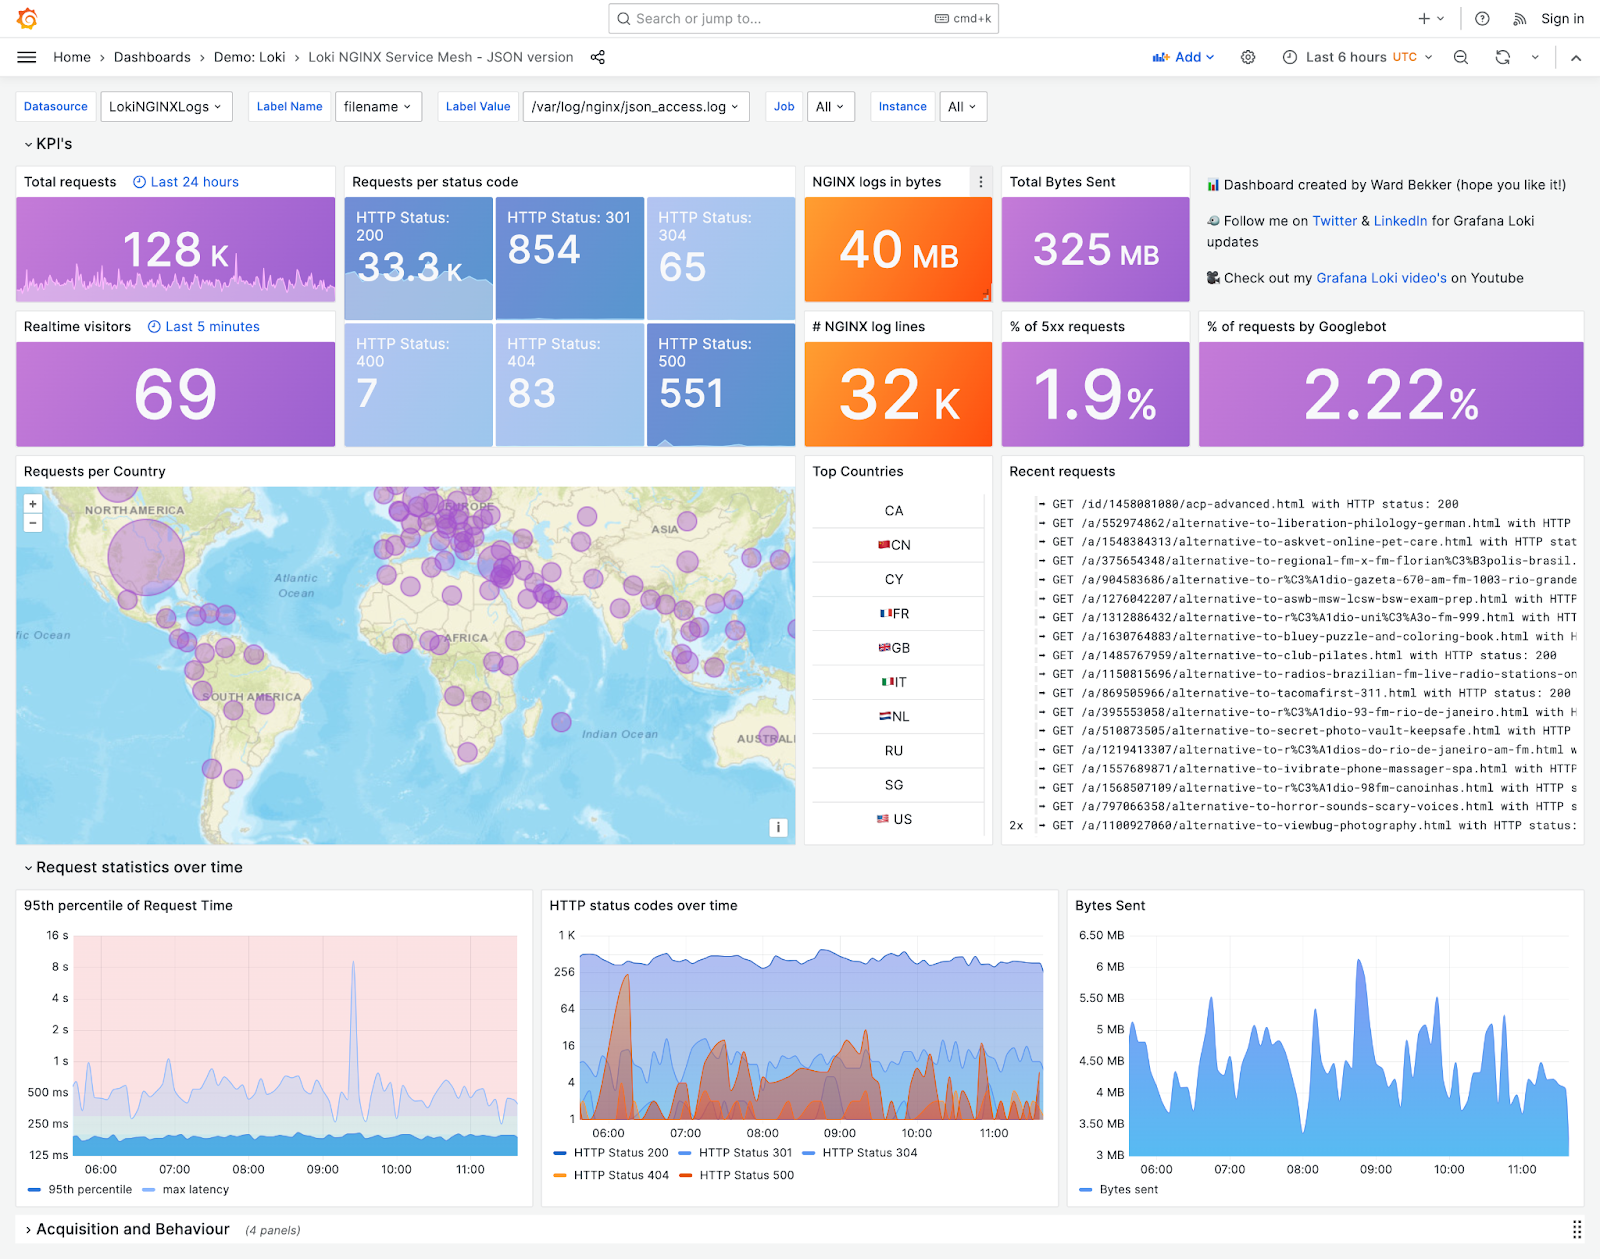 NGINX is a popular web server and reverse proxy server, it produces logs that record numerous events and transactions related to web requests and server activity. With this Grafana dashboard, you can view and monitor various KPIs related to your NGINX logs such as requests per status code, realtime visitors, and total requests.
These dashboards illustrate the vast uses of Grafana. If you’re looking for the simplest option to implement Grafana at your organization then Logit.io’s hosted Grafana is the perfect solution. You can utilize the best of Grafana almost instantly with a rapid onboarding process and if you encounter any issues or have specific requests our Grafana documentation and extensive integration guides can support your efforts. Also, we are here to help, feel free to contact us or reach out via live chat, found in the bottom right corner of our website and dashboard.
Unlock complete visibility with hosted ELK, Grafana, and Prometheus-backed Observability
If you enjoyed this post then why not check out our guide to the best Kibana dashboard examples or our previous post on SIEM tools?