
Resources, How To Guides
9 min read
Last updated:
The most straightforward way to know what’s happening under the hood of your applications running in production is to conduct logging. With Django, this is particularly simple as Django uses and extends Python’s built-in logging module to perform system logging, offering almost identical capabilities as Python’s framework but with further features and for Django applications. By monitoring Django logs users can boost their web application performance, monitoring, and debugging capabilities.
Our Django guide is another entry into our series of how-to guides for integrating various sources with the Logit.io platform, with this article solely focusing on Django. We will discuss what the framework is used for, what Django logging is, and its logging framework, before outlining how to integrate Django with Logit.io for monitoring, debugging, and visualizing Django logs.
Contents
What is Django Used For?
Django is a high-level Python web framework designed to make the creation of complex, secure, and scalable websites quicker. It follows the ‘batteries-included’ philosophy, which includes several features and tools, ranging from ORM (Object-Relational Mapping) and admin interface to authentication mechanisms that decrease the code developers write.
Django lends itself best to creating more complex, database-heavy websites and applications, from content management systems to social media platforms and e-commerce websites. Having a main focus on reusability, rapid development, and ensuring best practices, the framework enables developers to craft clean and maintainable code without losing any parts of the implementation that make it unique in scope.
What is Django Logging?
Django includes built-in logging allowing users to record and control log messages that an application generates. Django uses Python's built-in logging module, but it provides a flexible framework for configuring logging, as well as for defining logging mechanisms for the application. This involves setting log levels like DEBUG, INFO, WARNING, ERROR, and CRITICAL, defining handlers that outline where the log messages would go, such as files, consoles, or via emails, applying formatters to regularize the message format of log entries, and using filters to have finer control over what messages get logged.
Django Logging Framework
If you’re already familiar with Python logging, you’ll recognize the Django logging framework as it extends the built-in logging module that Python offers. Therefore Django logging operates in an almost identical fashion, having a large part of the process being preconfigured by the developers of Django. The Django logging framework has four main components loggers, handlers, filters, and formatters.
Loggers
A logger is a named entity that determines the category of log messages. Loggers are used to identify the origin of a log message, for example, different loggers can be created for different parts of an application, such as django.request, django.db.backends, or myapp.custom_logger. Users can set levels for individual log types to set the level of severity, this can be DEBUG, INFO, WARNING, ERROR, or CRITICAL.
Handlers
Handlers are important parts of the Django logging framework which defines what to do with the log messages after they have been emitted by loggers. Each handler directs log output to a range of destinations, such as to the console, to files, via emails, or to some external system. The flexibility thereby also opens up a wide array of options for handlers that you could use to custom-make your handling of the logging behavior of your Django application for capturing, storage, and monitoring of log data.
The StreamHandler is one of the most used handlers in Django, which sends log messages to output streams. This handler will be useful during development because it allows you to receive timely information about the events taking place in your application.
The FileHandler, allows log messages to be written to a file, ideal for a production environment where a user wants to keep a record of log messages for auditing, troubleshooting, or performance monitoring purposes.
Django provides RotatingFileHandler and TimedRotatingFileHandler in cases where log files might become large over time. The RotatingFileHandler will automatically rotate the log file when the file reaches a certain size and retain the number of old log files. This handler is useful to save disk space and to have a reasonable history.
In contrast, the TimedRotatingFileHandler rotates the log file at a fixed time interval, such as daily or weekly. This allows the logs to be segmented in time and, therefore, simplifies log analysis and log retention.
The SMTPHandler is for critical errors requiring immediate attention, this handler sends log messages by email and can be a good way to attain quick alerts on serious issues in real-time.
The AdminEmailHandler class is a Django-specialized version of SMTPHandler that emails error logs to site administrators based on the list defined in the ADMINS setting. It's mainly used to send ERROR level logs and above.
The less common handler, NullHandler, has the responsibility of discarding all log messages. You'll use this handler in a library or parts of your application where logging is optional and you want all logging turned off by default unless the user of your application configured logging explicitly elsewhere in your application.
Lastly, for even more advanced logging cases, Django supports the handlers MemoryHandler and WatchedFileHandler. The MemoryHandler buffers log messages and writes them to another handler when some predefined condition occurs, such as the number of log messages exceeds the pre-specified buffer size. This is beneficial when users want to reduce how often logs are written for high-performance applications. The WatchedFileHandler watches a log file for changes made by an external program so logging can continue even after the log file has been rotated or deleted and recreated by some external process.
Filters
In Django's logging framework, filters provide an additional layer of control over what log messages a logger or handler may process. While loggers decide on the level at which a message is severe enough to merit processing, filters make a more fine-grained decision on whether to allow a record to pass or discard according to some custom criteria. This allows developers to have precise control over their logging configuration, so they can capture only the log messages they are interested in, and filter out noise they don’t need.
Django allows filters to be applied both at the logger and at the handler level. If a filter has been attached to a logger, then it decides whether or not a log message emitted by that logger or any of its descendants should be passed on to the handlers. When a filter is attached to a handler, it only affects the log messages handled by that particular handler, while if attached to the loggers, it affects all of them. That's the difference, which also enables flexible configurations, where you filter messages either completely or just at some place in the logging process.
One common use case for filters in Django is the suppression of log messages from certain modules or the filtering out of log messages containing specific content. For instance, you may want to filter out all log messages about database queries or middleware that are not necessary to see for most debugging purposes. In that case, you can target the cases with a custom filter and bar them from your logs.
Log Management from Logit.io
With Logit.io you can utilize a powerful and cost-effective log management solution for efficient Django logging. Our platform offers the best in class open source tools as Hosted solutions, including Hosted Logstash, Hosted OpenSearch, and Hosted OpenSearch Dashboards. This provides you with the flexibility to use tools that you are most familiar with but without committing to the time-consuming and challenging configuration, as this is handled by us.
Lastly, at Logit.io, we prioritize transparency, our users can choose from a range of cost-efficient pricing plans that are most suitable for their requirements with overage protection being included as standard across all plans. If you’re interested in finding out more about log management from Logit.io, don’t hesitate to contact us or begin exploring the platform for yourself with a 14-day free trial.
Django Logging Example for Logit.io
To maximize the benefits of Logit.io, seamless and efficient data integration is crucial. To support this, we provide detailed and user-friendly integration guides in our documentation for a variety of data sources. For Django logging, users should consult the Django Logging Configuration guide to easily send logs from Django to their Logit.io Stack. Alternatively, you can follow the steps below to learn how to view Django logs in Logit.io.
1. Install Integration
Please click on the Install Integration button in the Django Logging Configuration guide to configure your stack for this source.
2. Installing the Python Logging Handler
Execute the following command using pip (the official Python package installer) to install the logging handler. This sends Python logging events to Logstash, which is part of your Logit.io log management stack:
pip install python-logstash-async
Tip: If you receive errors suggesting pip is an unknown command, navigate to its installed location with your chosen terminal program and try again (or add pip to your environmental variables if using Windows).
3. Sending Logs
Add your imports to the top of your file (the file you wish to include logging on):
import logging
from logstash_async.handler import AsynchronousLogstashHandler
from logstash_async.handler import LogstashFormatter
Add this code somewhere inside the same file, for example:
def main():

    # Create the logger and set it's logging level
    logger = logging.getLogger("logstash")
    logger.setLevel(logging.DEBUG)

    # Create the handler
    handler = AsynchronousLogstashHandler(
        host='<your-logstash-host>',
        port=<your-ssl-port>,
        ssl_enable=True,
        ssl_verify=False,
        transport='logstash_async.transport.BeatsTransport',
        database_path='')

    # Here you can specify additional formatting on your log record/message
    formatter = LogstashFormatter()
    handler.setFormatter(formatter)

    # Assign handler to the logger
    logger.addHandler(handler)

    # Send log records to Logstash
    logger.error('django-logstash-async: django error message.')
    logger.info('django-logstash-async: django info message.')
    logger.warning('django-logstash-async: django warning message.')
    logger.debug('django-logstash-async: django debug message.')

if __name__ == '__main__':
    main()
Launch logs in Logit.io to view your Python data.
Visualizing Django Logs in Logit.io
Logit.io offers robust visualization options through its range of hosted open-source tools, including Hosted Kibana, Hosted OpenSearch Dashboards, and Hosted Grafana. These tools provide enhanced flexibility for comprehensive analysis, debugging, and monitoring of your Django logs.
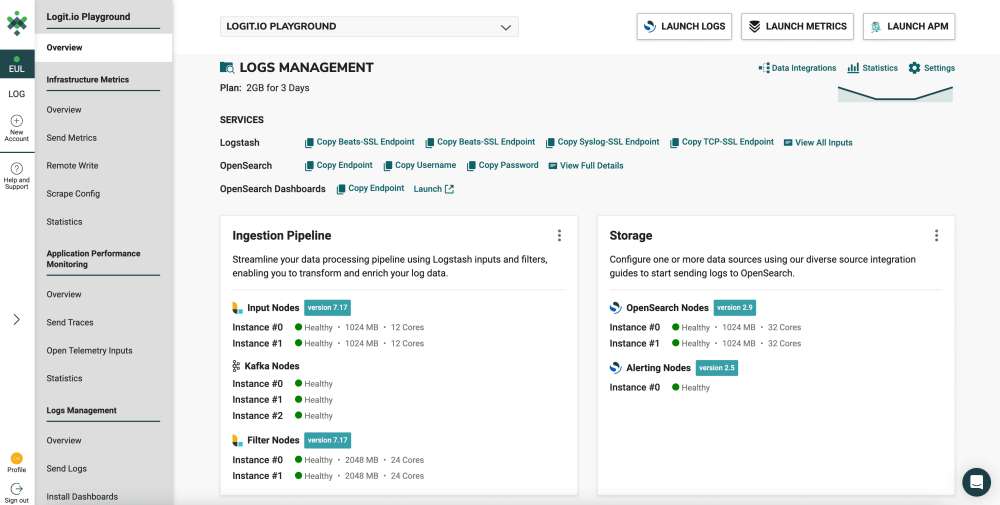
After sending your Django logs to Logit.io, you can access and review them directly from the initial dashboard. For visualizing Django logs, we recommend starting with OpenSearch Dashboards, which can be conveniently launched from the 'Logs Management' page.
- Launch Logs: From the initial dashboard, select ‘Launch Logs’ at the top right of your screen or ‘Launch’ next to OpenSearch Dashboards.
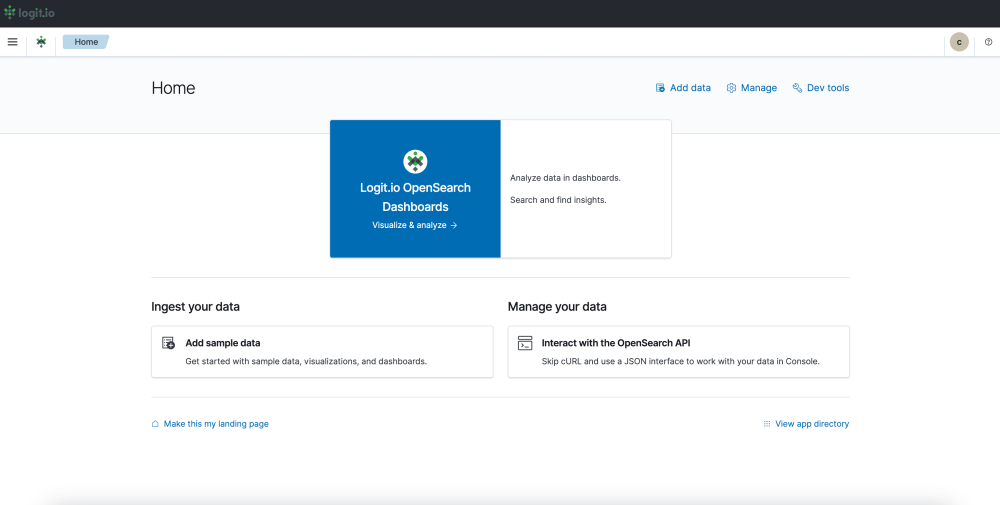
- OpenSearch Dashboards: After selecting ‘Launch Logs’ or ‘Launch’ you will arrive at the OpenSearch Dashboards welcome page. As you have already shipped logs from Django to Logit.io, select ‘Visualize & Analyze’.
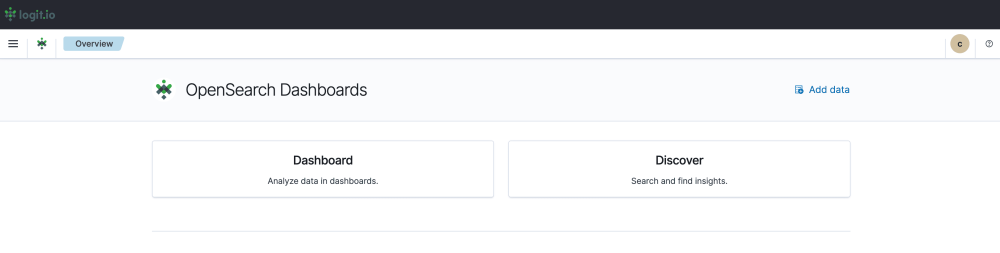
- Visualization Options: From this page, you can choose either ‘Discover’ which allows you to search through your data to find insights, or ‘Dashboard’ which allows you to analyze your data in dashboards. For this guide, we will select, ‘Dashboard’.
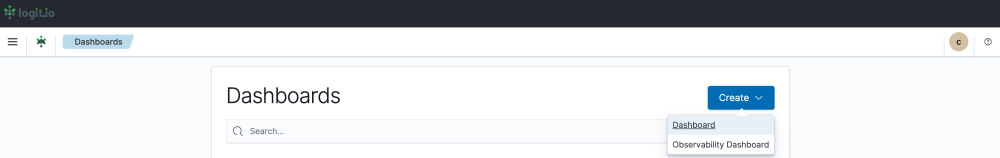
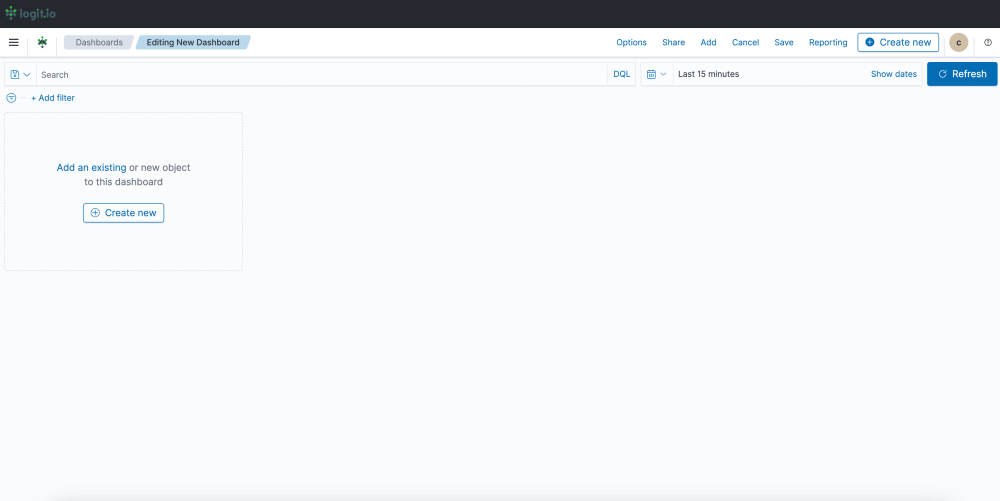
- Create a Dashboard: After selecting ‘Dashboard’ you now need to select ‘Create’ towards the right of your screen and ‘Dashboard’ from the dropdown menu.
- Editing and Saving a Dashboard: From this page, you can edit your dashboard by adding existing panels and objects or creating new ones. To create a new object select ‘Create New’ from the left of your screen and choose your preferred data presentation type for viewing Django data. Once you’ve added all the objects you desire, click ‘Save’ in the top right. Now you can visualize your Django Data in Logit.io.
If you've enjoyed this article why not read How to Integrate Python Logs with Logit.io or How to Integrate Serilog with Logit.io next?