
Resources, How To Guides
8 min read
Last updated:
Docker is an open-source container service provider, designed to help developers build, run, and share container applications. Users building and running these container applications need to conduct effective debugging and monitoring practices and for this, they have turned to Docker logging. To understand the importance of this, the latest edition of our how-to guide series surrounds Docker. The article will include, why containers are needed, what Docker logging is, and how to integrate Docker with Logit.io for enhanced monitoring, analysis, and visualization.
Contents
What are Docker Container Logs?
One of the most important elements in debugging and monitoring Docker container-deployed applications is Docker container logs. These logs capture all of the information that applications emit through stdout and stderr streams. The logs include vital information, such as application behavior, error messages, and debug data that help diagnose issues and track performance.
Why Do You Need Containers?
Containers are useful as they ensure the execution of the application in a lightweight, consistent, and isolated environment to guarantee consistency across varied systems. They package an application and its dependencies into a container making deployment, scaling, and management much simpler. Containers further increase efficiency in resources, for example, more applications can run on one host without interfering with one another, which allows scaling and reduces infrastructure costs. Also, modern DevOps and microservices architectures are streamlined by containers, accelerating development. This means deployment becomes easier, as well as collaboration between the development and operation teams.
What is Docker Logging?
Docker logging refers to the process of capturing and managing the logs generated by applications running inside Docker containers. Docker provides out-of-the-box tools for reading Docker logs, such as the command docker logs, which can be further managed and forwarded to centralized logging systems (like Logit.io) with the use of drivers such as JSON, syslog, or third-party tools like Filebeat, Fluentd, and Logstash. Proper log management goes a long way toward smooth operations in containerized environments by providing valuable insights into the health and activities of the containers.
How Docker Logging Differs and the Challenges Users Encounter
One of the reasons Docker logging differs from traditional logging is that it contains some unique challenges because of its containerized nature. Conventionally, logs are managed either at the server or application level, and there is only one point of logging where all the data is captured and stored. In a Docker environment, this may involve multiple containers running on the same host or across multiple hosts, each of which might generate its own logs. Because of the distributed nature, the architecture complicates the logging process, from log collection and aggregation to analysis.
One key challenge of Docker logging lies in the ephemeral nature of containers. Containers are lightweight and short-lived, meaning they get started or stopped frequently. It is this dynamic nature that complicates log persistence and its management, as the logs may get lost when the container gets stopped or deleted. Additionally, since containers can be redeployed or scaled horizontally, tracking logs from multiple instances of the same application can become particularly complicated.
Furthermore, additional complexity is caused by integrating Docker logging into already existing log monitoring and management systems. This requires log forwarding with appropriate configurations and needs compatibility with leading tools like Elasticsearch, or Logstash, which takes significant time for the setup and maintenance. Modern demands around real-time log analysis and centralized storage of logs complicate the manageability even more by ensuring the reliable transfer and storage for efficient querying and visualization of logs. Logit.io's configuration guide for monitoring Docker container logs aims to remove this added complexity from the integration by offering a simple and easy-to-follow guide that enables you to begin viewing Docker logs in Logit.io quickly.
Lastly, another challenge arises as a result of Docker supporting several logging drivers and formats. For example, Docker allows users the choice to use JSON, Syslog, or implement their own driver, but such diversity inevitably results in a lack of standardization in log format and structure. Such inconsistencies make it harder to standardize log collection and processing across different containers and applications.
Docker Logging Commands
Docker logging commands enable you to view, follow, and manage logs generated by containers. These commands provide insights and details into container behaviour, which helps in debugging and monitoring. Below we have listed the key Docker logging commands.
docker logs: This command fetches and displays the logs from a running container. It shows both stdout and stderr output.
docker logs <container_name_or_id>
docker logs --follow: This command streams the live logs of a container. Similar to tail -f, it continuously outputs the latest log messages as they are generated.
docker logs --follow <container_name_or_id>
docker logs --tail: This command shows only the last few lines of the container logs. You can specify how many lines you want to see.
docker logs --tail <number_of_lines> <container_name_or_id>
docker logs --timestamps: Displays logs with timestamps, useful for knowing when a particular log entry was generated.
docker logs --timestamps <container_name_or_id>
docker logs --sinceanddocker logs --until: These commands are used to show logs from a specific timeframe.--sincespecifies the start time, and--untildefines the end time.
docker logs --since 2023-09-01T00:00:00 <container_name_or_id>
docker logs --until 2023-09-01T12:00:00 <container_name_or_id>
docker logs --since 1h <container_name_or_id>
docker inspect --format='{{.LogPath}}': This command retrieves the path to the log file of a Docker container. Docker stores logs for each container on the host system, and this command helps locate the exact file.
docker inspect --format='{{.LogPath}}' <container_name_or_id>
docker system prune --volumes(for log cleanup): This command removes unused data, including stopped containers and dangling images, which can help clean up old logs and free up space.
docker system prune --volumes
Log Management from Logit.io
Logit.io’s log management solution is a powerful, cost-effective, and intuitive tool for conducting Docker logging. The solution offers Hosted OpenSearch which enables you to aggregate logs from various Docker containers running on numerous hosts into a single, centralized platform. With Logit.io, you gain all the best features of OpenSearch without the time-consuming and complex configuration, so scalability is managed for you. This means you can effortlessly handle increasing volumes of log data as your Docker infrastructure grows.
Also, Hosted OpenSearch supports real-time monitoring and alerting, allowing you to set up automated alerts for specific log patterns or performance metrics. This is particularly useful for identifying potential problems like high error rates or resource exhaustion in Docker containers. If you’re interested in finding out more about Logit.io’s log management solution, feel free to contact us or begin exploring the platform for yourself with a 14-day free trial.
Unlock complete visibility with hosted ELK, Grafana, and Prometheus-backed Observability
Start Free TrialIntegrating Docker with Logit.io
Integrating Docker with Logit.io is painless with the integration of Docker, Filebeat and Hosted OpenSearch. Filebeat can collect logs from multiple Docker containers running on the same host. By integrating directly with the Docker API, Filebeat can easily access and ship logs from all running containers without needing individual configuration for each container. Also, Filebeat can forward Docker container logs to OpenSearch, part of Logit.io’s Log Management solution, which ensures these logs are continuously captured in real time. This integration simplifies the logging pipeline and ensures no logs are lost even in highly dynamic container environments.
To further ease this integration, in our documentation, we have produced a detailed and simple Docker configuration guide, which outlines how to configure Filebeat to send Docker container logs to Logit.io. Once these logs have been sent to Logit.io, they can then be monitored, analyzed, and visualized with Hosted OpenSearch and Hosted OpenSearch Dashboards.
Visualizing Docker Container Logs in Logit.io
After following our Docker container logs configuration guide, you’ll now be able to begin visualizing these logs in Logit.io. With Logit.io, you have access to numerous open source visualization tools as hosted solutions including, Hosted Kibana, Hosted Grafana, and Hosted OpenSearch Dashboards. By using these tools you can create real-time dashboards to visualize logs and metrics, track application performance, detect errors, and set up alerts. These visualizations are invaluable for your DevOps teams to track container health and rectify issues proactively.
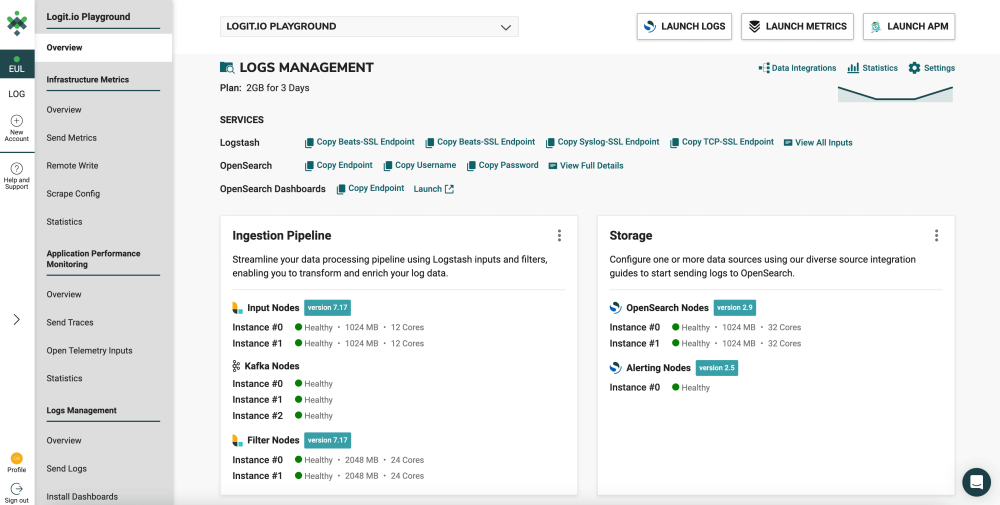
Below, we’ve outlined the steps for visualizing your Docker container logs with Hosted OpenSearch Dashboards which can be launched from the ‘Logs Management’ page.
- Launch Logs: From the initial dashboard, select ‘Launch Logs’ at the top right of your screen or ‘Launch’ next to OpenSearch Dashboards.
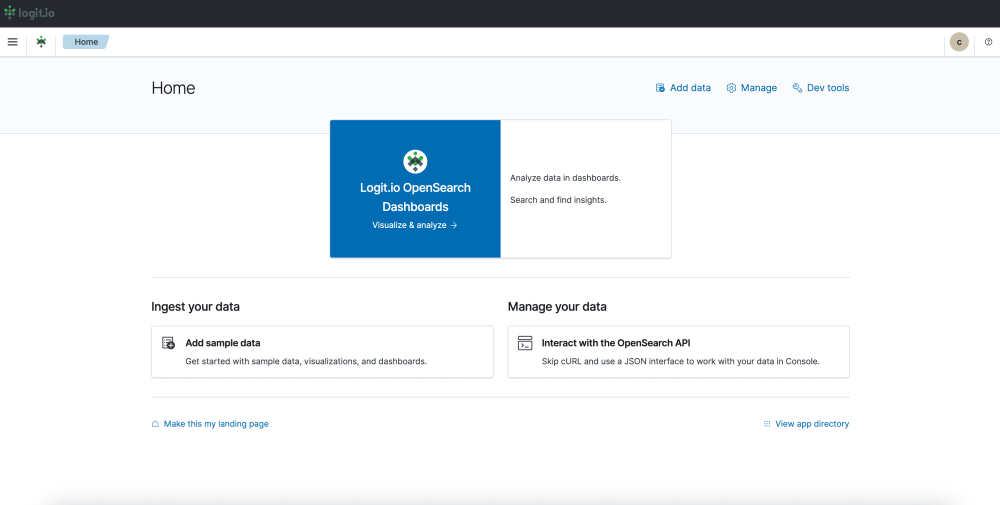
- OpenSearch Dashboards: After selecting ‘Launch Logs’ or ‘Launch’ you will arrive at the OpenSearch Dashboards welcome page. As you have already shipped Docker container logs from Docker to Logit.io, select ‘Visualize & Analyze’.
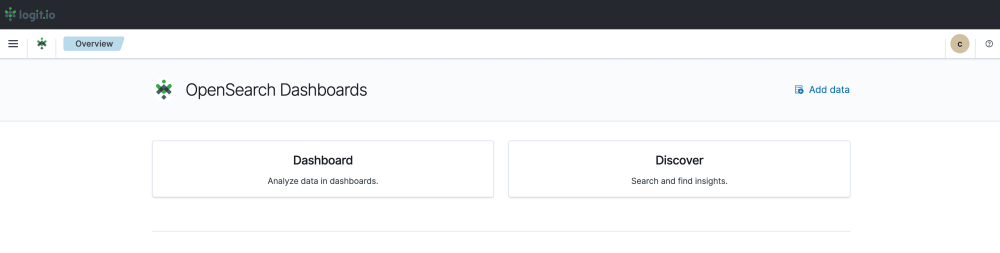
- Visualization Options: From this page, you can choose either ‘Discover’ which allows you to search through your data to find insights, or ‘Dashboard’ which allows you to analyze your data in dashboards. For this guide, we will select, ‘Dashboard’.
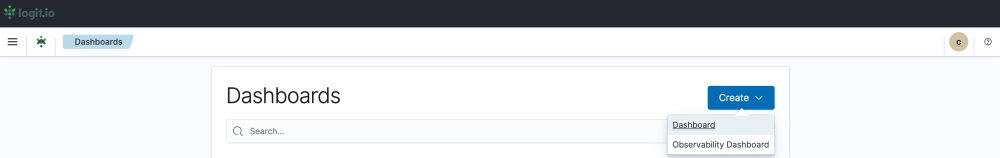
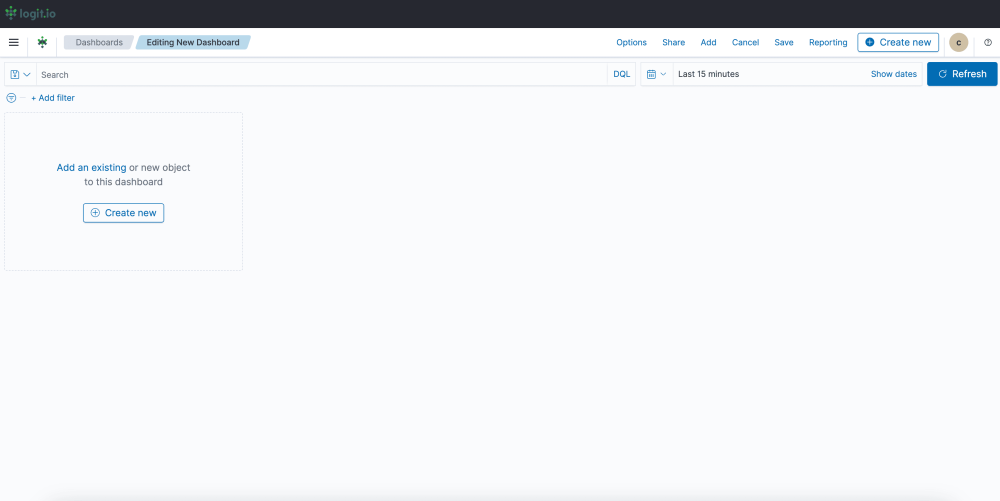
- Create a Dashboard: After selecting ‘Dashboard’ you now need to select ‘Create’ towards the right of your screen and ‘Dashboard’ from the dropdown menu.
- Editing and Saving a Dashboard: From this page, you can edit your dashboard by adding existing panels and objects or creating new ones. To create a new object select ‘Create New’ from the left of your screen and choose your preferred data presentation type for viewing Docker container log data. Once you’ve added all the objects you desire, click ‘Save’ in the top right. Now you can visualize your Docker container logs in Logit.io.
If you've enjoyed this article why not read How to Integrate Serilog with Logit.io or How to Integrate Django with Logit.io next?