
How To Guides, Resources
10 min read
Last updated:
When telemetry data (collected from system sources in observability) is analyzed collectively it provides insights into the relationships and dependencies within a distributed system. OpenTelemetry standardizes the collection and transmission of telemetry data to backend platforms, closing visibility gaps by offering a unified instrumentation format across all services. To assist you in gaining a deeper understanding of OpenTelemetry, Logit.io’s latest how-to guide will outline the framework's architecture, how it works, its benefits, and how OpenTelemetry is used with Logit.io.
Contents
What is OpenTelemetry?
OpenTelemetry is an open-source observability framework that provides a set of standardized tools and APIs for collecting and exporting telemetry data for logs, metrics, and traces from software systems. It was designed to provide deep insight into system behavior to assist developers and operators in monitoring, troubleshooting, and optimizing distributed systems.
OTel (OpenTelemetry) simplifies the integration of different aspects of observability, such as tracing and metrics, across multiple services and environments within various programming languages and platforms. Being a vendor-neutral framework, the export of telemetry data to any backend a user chooses is easy, be it Prometheus, Jaeger, or an APM solution.
OpenTelemetry Architecture and How OpenTelemetry Works
The architecture of OTel allows for effective collection, processing, and exporting of telemetry data across distributed systems. Its design is extendable in terms of capture and management of telemetry by a modular set of vendor-agnostic components. The major components are SDKs, instrumentation libraries, collectors, and exporters.
Instrumentation and SDKs
At the core of OpenTelemetry are a set of SDKs and instrumentation libraries that enable developers to instrument their applications and services with minimal effort. Instrumentation is, in essence, code injected into the applications to capture telemetry data such as timing, errors, and resource utilization. OpenTelemetry has a library for automatic instrumentation, therefore there is little code that a developer needs to add manually in order to capture data.
Each SDK, with various versions for languages like Python, Java, and Go, is responsible for intermediation between the instrumented application and the rest of the telemetry pipeline. An SDK would handle configuration and data for metrics, traces, and logs and can make the system customized for specific requirements, such as setting sampling rates or a level of detail to be captured.
OpenTelemetry Collector
The OTel Collector is the centerpiece of OpenTelemetry and is responsible for processing and exporting telemetry data. It runs independently from your application and sits between the telemetry data captured by the SDKs and the backend observability systems. The OTel Collector may be run as an agent (deployed locally next to the application) or as a standalone service in a distributed system.
Highly configurable, the OTel Collector grants multi-pipelines for a variety of data types. It ingests telemetry data, applies optional processing (such as filtering or aggregation), and forwards the data processed onto the desired backend. This sort of modular architecture makes the centralization of data from a variety of sources with minimal overhead on individual applications simple.
Exporters and Backend Integration
OpenTelemetry is designed to work with a variety of different backends. Exporters are responsible for sending the telemetry data collected to those backends, for example, Prometheus for metrics, Jaeger for tracing, or third-party monitoring tools, like Logit.io. SDKs and the OpenTelemetry Collector come with a set of exporters that enable compatibility with numerous systems out of the box.
This decoupled design has the added flexibility of being able to send telemetry data to one or more backends for subsequent analysis, visualization, and alerting. It would protect the user's investment in instrumenting their services so that in case another observability platform is selected, the previous instrumentation does not have to be rewritten.
How it Works
When a distributed application instrumented with OpenTelemetry is running, each service will generate telemetry data, such as traces that track a request as it makes its way across services, and metrics for measuring system performance. The SDK captures that telemetry and dispatches it to the OTel Collector. Then the Collector executes any necessary processing, filtering, and aggregation of that data before exporting it to any back-end platform for analysis and visualization.
Why Use OpenTelemetry
By using OpenTelemetry your organization can enhance their current operations and gain from the numerous advantages that the framework provides. An example of one of these advantages is that OpenTelemetry reduces the manual effort in instrumenting applications with the help of automatic instrumentation libraries and a standardized telemetry framework, thereby lessening the operational overhead in monitoring complex distributed systems. It provides the ability for developers to focus on building features instead of focusing on instrumentation.
Additionally, OpenTelemetry is supported by a huge community and many observability vendors, this provides a future-proof monitoring solution wherein an organization would keep the same instrumentation in newer tools and technologies while adapting the backend systems to secure their compatibility and investment in the long run. If you’re looking to future-proof your operations then opting for an observability platform that already supports the OpenTelemetry framework is the best method to achieve this and Logit.io is the perfect solution.
Another benefit of using OpenTelemetry is that it supports a wide variety of programming languages and platforms, from which OpenTelemetry derives its suitability for polyglot environments. This makes it easy for an organization to apply the same observability framework across different services running on cloud, on-premise, or hybrid infrastructure.
Lastly, since OpenTelemetry is an open-source project supported by an impressive and ever-growing community, it is constantly adapting to the contributions of serious industry players. It is continuously supported through community-driven improvements and boasts an active ecosystem of tools, libraries, and plugins under continuous development.
Logit.io for OpenTelemetry
Logit.io for OpenTelemetry is a secure, compliant, and production-ready distribution of the OpenTelemetry project, offering unified analysis and full centralization of all data types, and by leveraging OpenTelemetry (OTel) alongside Logit.io you’re able to gain seamless end-to-end observability. Also, Logit.io fully supports relaying telemetry data captured in the OpenTelemetry OTLP standard format, enabling you to use this data to build reports, create dashboards, and set up alerts and monitors.
As well as this, Logit.io can be utilized without agents, allowing you to utilize out-of-the-box instrumentation for popular libraries and platforms, with built-in compatibility for data sources like Kubernetes, Docker, and Node.js. If you’re interested in finding out more about Logit.io for OpenTelemetry or the Logit.io platform, feel free to contact us or begin exploring the platform for yourself with a 14-day free trial.
Unlock complete visibility with hosted ELK, Grafana, and Prometheus-backed Observability
Start Free TrialOpenTelemetry with Logit.io Integration
Logit.io has curated individual integration guides in our documentation outlining how to use OpenTelemetry for Logs, Metrics, and Traces. The guides are straightforward and highlight different tools you can use within the Logit.io platform to enhance your organization's current operations. To follow these integration guides, you will need to have a logit.io account, you can sign up now with a 14-day free trial.
How to Create Visualizations and Search Data with OpenTelemetry in Logit.io
With logit.io, you have access to a broad variety of open-source tools, provided as hosted solutions for extensive visualization capabilities, including Hosted OpenSearch Dashboards, Hosted Grafana, and Hosted Jaeger. Depending on which source the OpenTelemetry Collector gathers, determines which of these visualization tools is most appropriate.
Logs
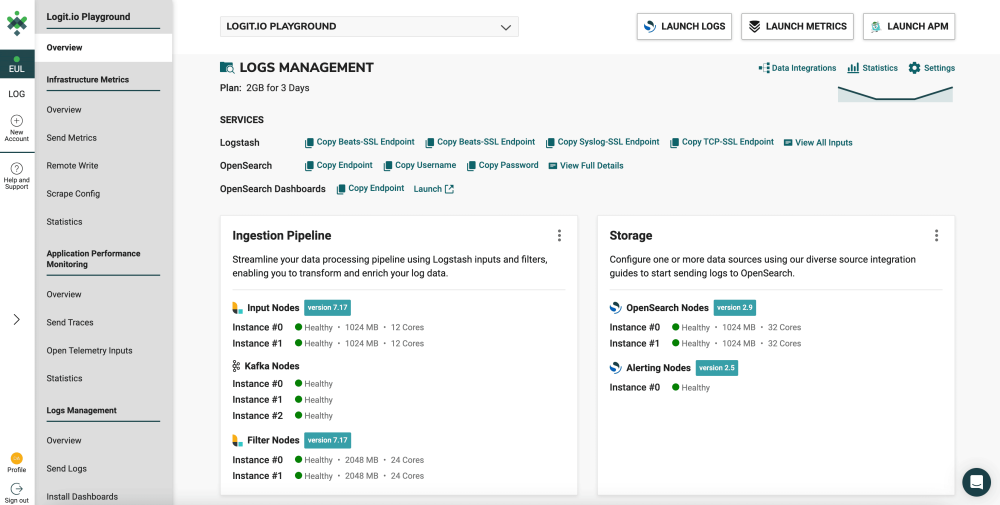
Once you’ve installed and configured the OTel Collector to send your logs to Logit.io, you can now return to the Logit.io dashboard to visualize your data. For visualizing logs we recommend using OpenSearch Dashboards.
- Launch Logs: From the Logs Management dashboard, select ‘Launch Logs’ at the top right of your screen or ‘Launch’ next to OpenSearch Dashboards.
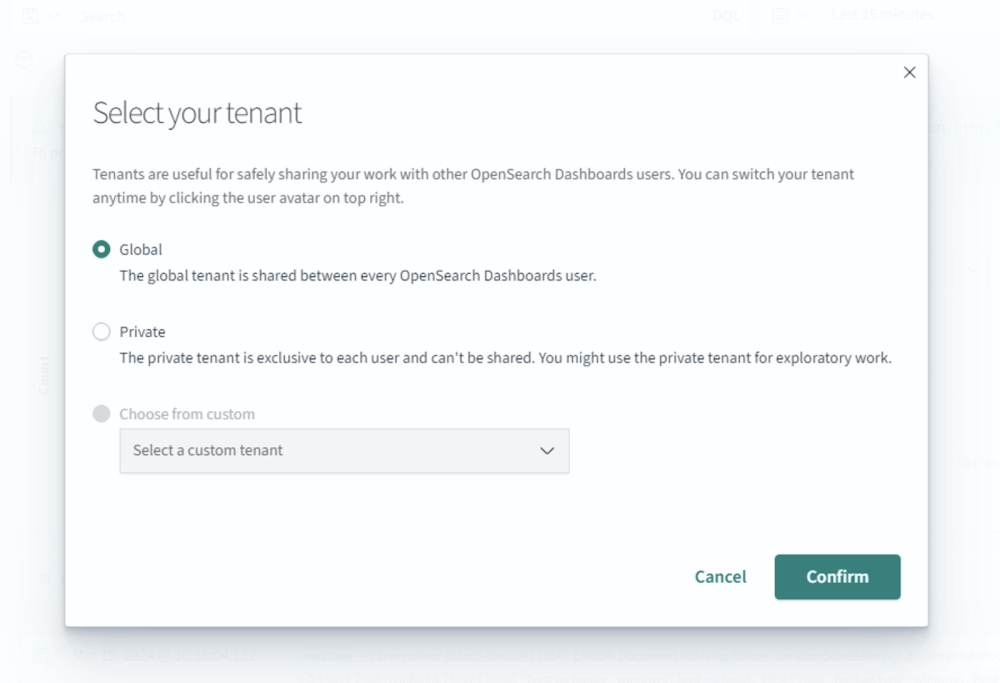
- Verify and Search Data: As OpenSearch Dashboards launches, which serves as the default log viewer, you will be prompted the first time to "Select your tenant." For most users, selecting the "Global" tenant is the recommended option. Tip: You can always change the tenant later in your user settings inside OpenSearch.
- The Discover View: After selecting your tenant, you are then redirected to the Discover View which allows you to explore and search the data arriving in your stack. It provides a user-friendly interface to quickly filter and find specific logs, metrics, or other data types.
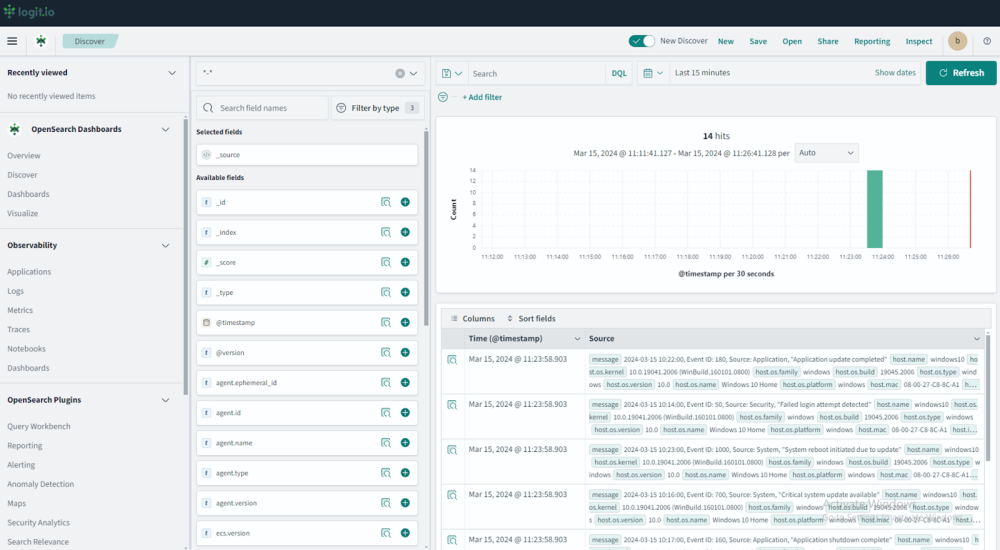
- Monitor, Troubleshoot, and Visualize: You can view your data with predefined searches and dashboards that facilitate monitoring and troubleshooting.
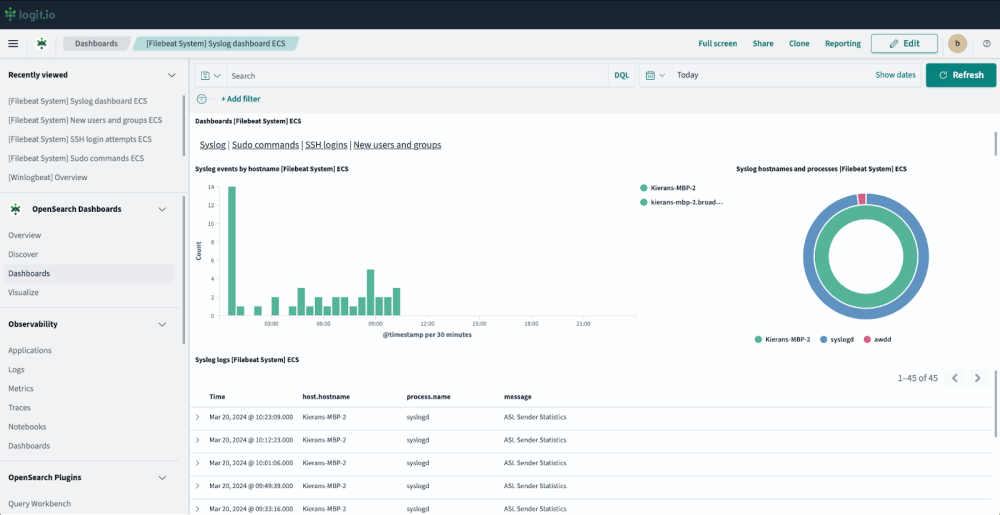
You can browse our pre-configured dashboards and choose which to install by choosing Install Dashboards from your Logs stack.
Once you've sent your logs to Logit.io, you can gain an in-depth perspective on the health and performance of your distributed cloud services through using real-time monitoring, and custom dashboards. This allows your team to dive deep into logs for troubleshooting, while simultaneously offering a broad view of your infrastructure's status via custom dashboards and notifications.
Metrics
After installing and configuring the OTel Collector to send your metrics to Logit.io, you can return to the Logit.io dashboard to visualize and analyze your data. For viewing metrics we recommend using Grafana.
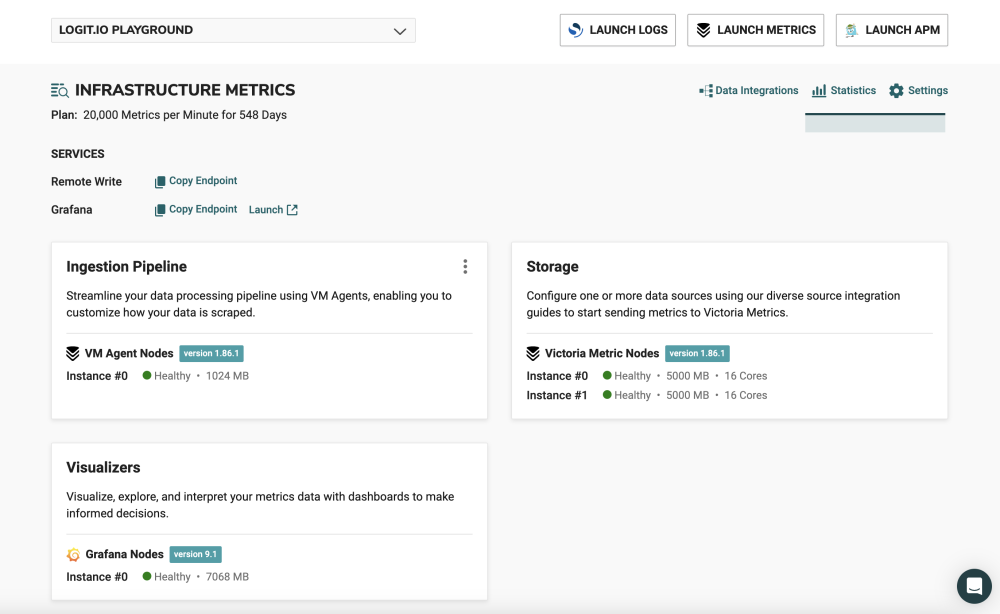
- Launch Metrics: From the Infrastructure Metrics dashboard, select ‘Launch Metrics’ at the top right of your screen or ‘Launch’ next to Grafana.
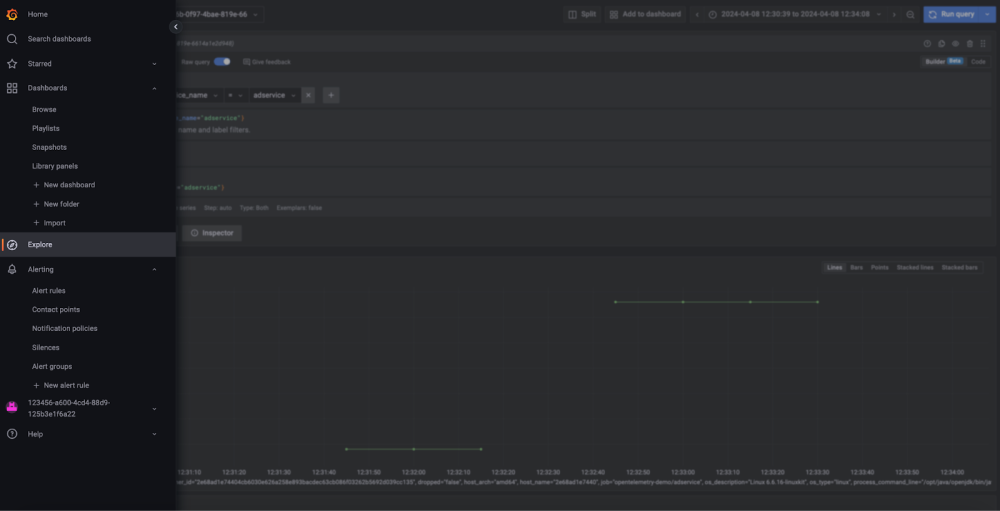
- Verify and Search Data: As Grafana launches, which serves as the default metrics viewer, choose Explore from the left menu. The Explore feature in Grafana lets you search and examine your stack's incoming data. It offers an intuitive platform for swiftly isolating and identifying particular metrics or various data forms.
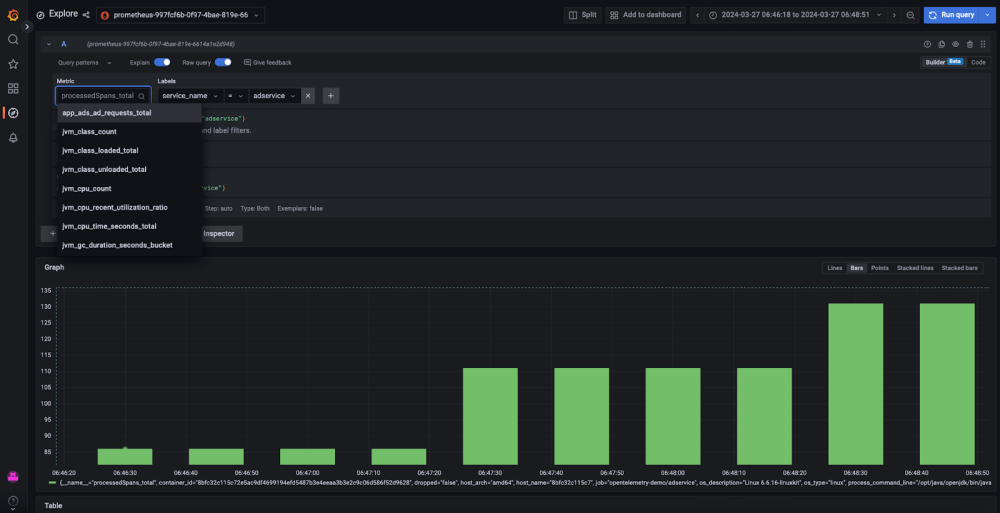
- Select Metrics: Select the required Metrics from the list as shown below and choose Run query to visualize your metrics.
- Monitor, Troubleshoot, and Visualize: You can view your data with predefined searches and dashboards that facilitate monitoring and troubleshooting.
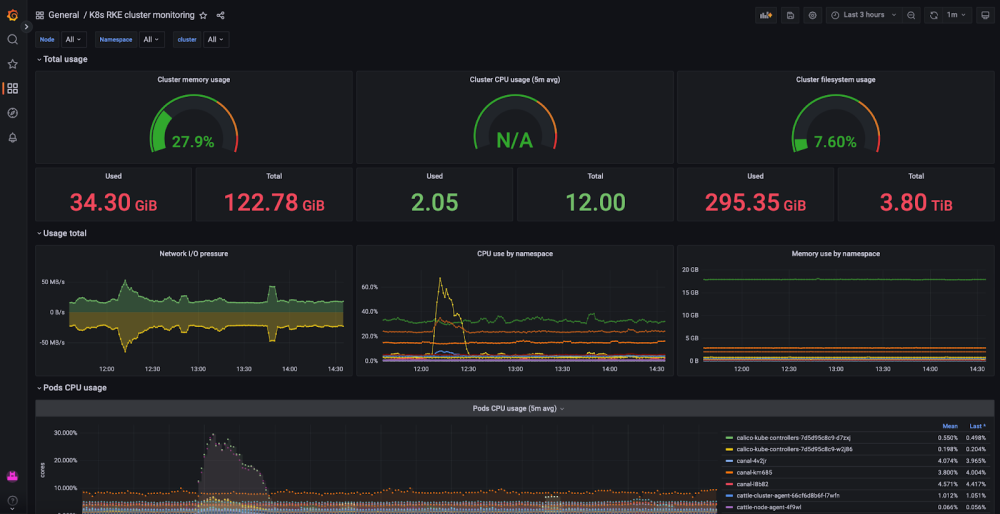
Once you've sent your metrics to Logit.io, you can gain an in-depth perspective on the health and performance of your distributed cloud services through using real-time monitoring, and custom dashboards. This allows your team to dive deep into logs for troubleshooting, while simultaneously offering a broad view of your infrastructure's status via custom dashboards and notifications.
Traces
After setting up the OTel Collector to forward your traces to Logit.io, you can head back to the Logit.io dashboard to visualize your data. For visualizing traces and spans we recommend using Jaeger.
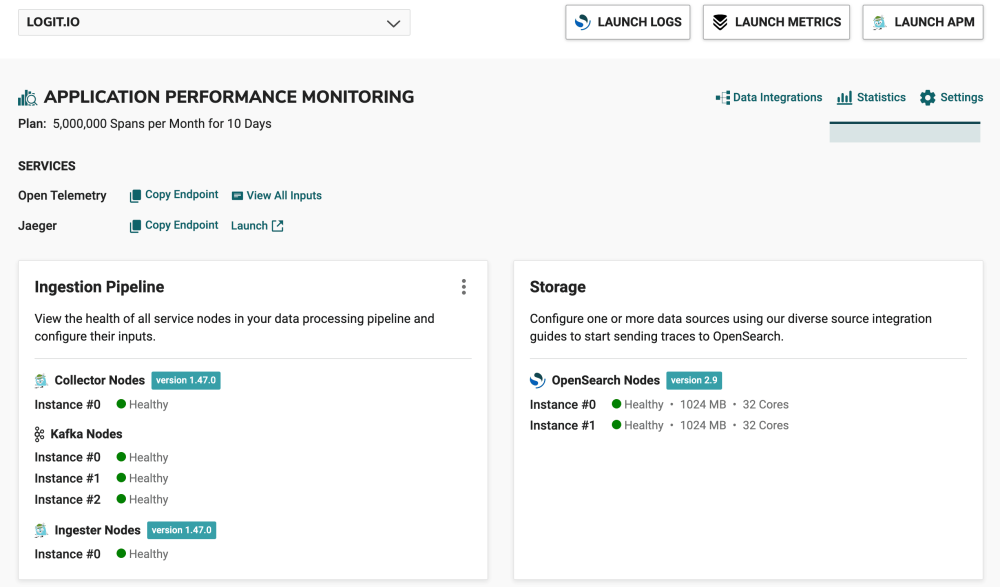
- Launch APM: From the initial dashboard, scroll down to the Application Performance Monitoring (APM) section, and under ‘Services’ you’ll see Jaeger, select ‘Launch’, or in the top right of your screen select ‘Launch APM’.
- Verify and Search Data: As Jaeger launches, which serves as the default Trace viewer, you are redirected to the Search View. The Search View in Jaeger enables the exploration and analysis of your stack's incoming trace data. It provides an intuitive interface for quickly identifying specific traces, pinpointing errors, or examining varied trace information and metadata.
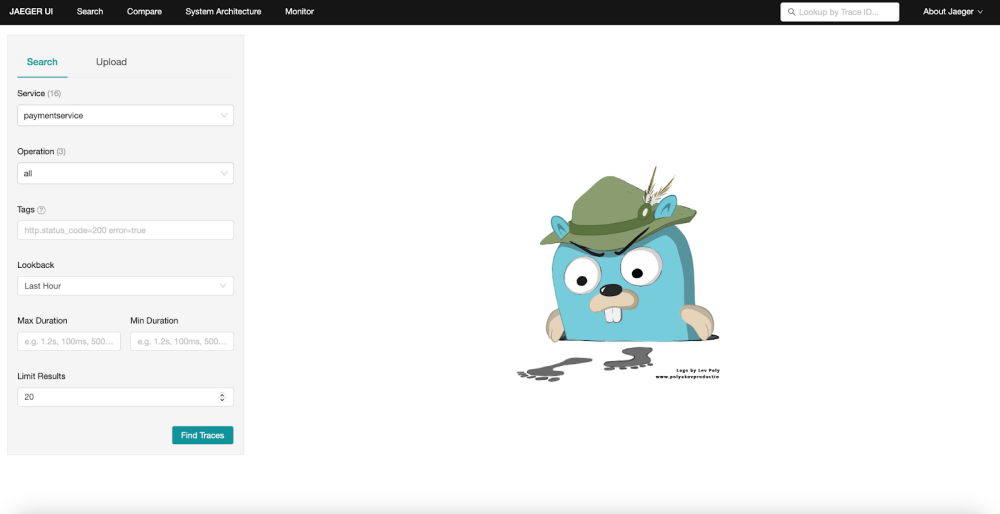
- Find Traces: Select the required Service from the list as shown below and choose Find Traces to visualize your data.
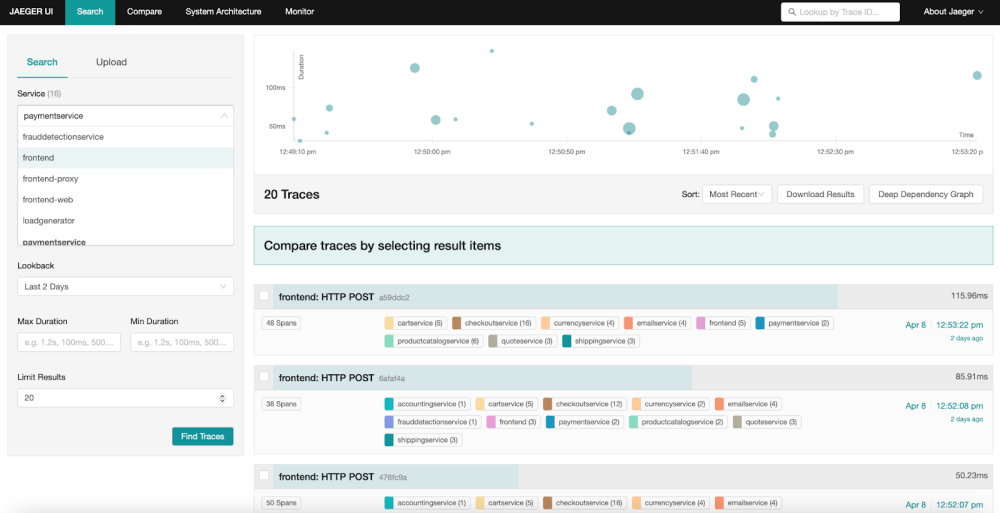
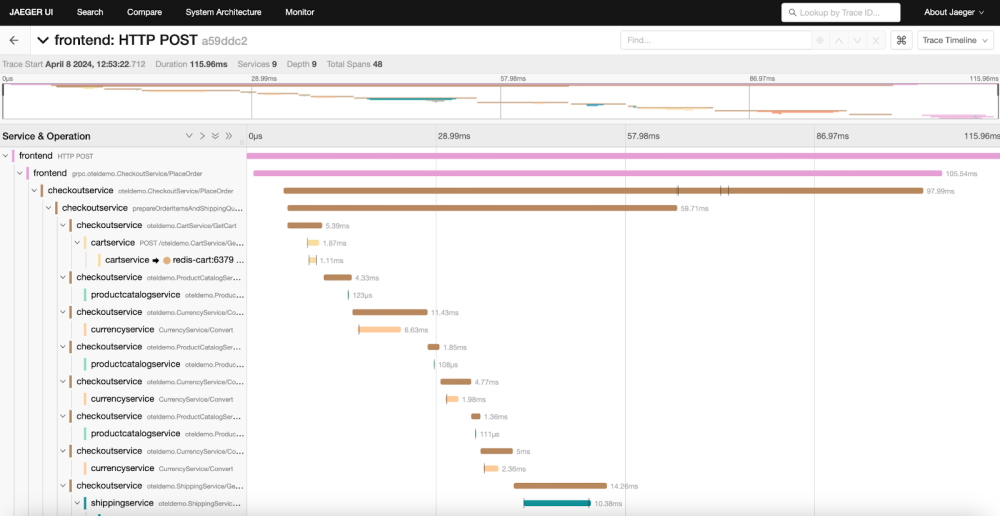
- Investigate and Troubleshoot: To investigate a trace in greater detail, click on a trace summary in Jaeger's Overview. This action allows for an in-depth examination of a trace's span durations and operational flow, essential for diagnosing issues and optimizing system performance.
Once you've sent your traces to Logit.io, you can gain an in-depth perspective on the health and performance of your distributed cloud services through using real-time monitoring, and custom dashboards. This allows your team to dive deep into logs for troubleshooting, while simultaneously offering a broad view of your infrastructure's status via custom dashboards and notifications.
If you've enjoyed this article why not read How to Integrate Django with Logit.io or How to Integrate Filebeat with Logit.io next?