
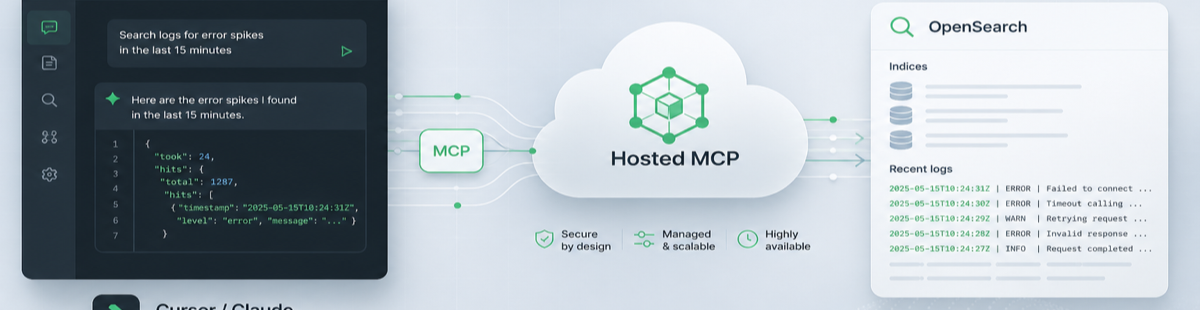

There are two moments in setting up observability where you leave your editor. The first is when you go and find out how to add OpenTelemetry to this particular app, in this language, with this logging library. The second is when you've deployed the change and need to know whether anything arrived. Logit.io now has a tool for each: onboarding's Copy AI prompt for the first, and Hosted OpenSearch MCP for the second.
Put together, they make a single session in Cursor or Claude: the assistant makes the change, you run the app, and the same assistant reads your stack to tell you what landed. This is how that session goes, and where to keep a human eye on it.
Contents
1. Copy the prompt for your language
In the dashboard, open onboarding on your Logs stack and choose OpenTelemetry, then Applications. Pick your language from the dropdown. There are SDK or zero-code agent setups for .NET, Python, Node.js, Java, Go, Ruby, PHP, Elixir, Erlang, C++, Rust and Swift. Under the setup steps there's a row headed "Using an AI assistant?" with Copy AI prompt and a Preview button. Read the preview once before you paste it anywhere. It's plain text, and there's nothing in it you'd mind an assistant seeing.
That's deliberate. The prompt contains your Hosted OpenTelemetry endpoint, https://your-stack-id-otel.logit.io, and the username for it. It does not contain your API key. Instead it tells the assistant to read the key from an environment variable (LOGIT_API_KEY on a Logs stack, which is where Hosted OpenTelemetry lives) and to ask you to set it, with a bash export for Linux and macOS and a PowerShell version for Windows. The key never goes into the chat transcript, and the assistant has no reason to write it into a file it might commit.
The rest of the prompt is the known-working setup for that language and a set of rules. The rules say OTLP over HTTP with http/protobuf, one endpoint and one credential for logs, traces and metrics, no gRPC, no added port, TLS stays on, and don't install a Collector unless one is already running. It also gives the assistant a check to run at the end, so you both agree on what "working" means.
2. Let the assistant make the change
Paste the prompt into Cursor's agent, or Claude with access to your repo, from the root of the app. The prompt covers two cases, and the assistant is told to work out which one it's in.
The app doesn't export OpenTelemetry yet. The assistant follows the setup in the prompt: the language's SDK packages, or its official zero-code agent, plus the config file for that language. That's appsettings.json for .NET, otel.properties for the Java agent, and a .env file for Python, Node.js, Go and others. The SDK and the agent are alternatives, and the prompt says not to install both.
The app already exports OTLP somewhere. This is where a generic "add OpenTelemetry" request goes wrong, usually by adding a second exporter next to the first. The prompt tells the assistant to keep the existing SDK, instrumentation and service name, and to change only the endpoint, the protocol and the auth header, in whatever configuration already supplies them. If the app sends to a Collector, the assistant retargets the Collector's otlphttp exporter and leaves the app alone.
Review the diff as you would a colleague's. The things worth checking take seconds:
- The endpoint is the base URL, with no port and no
/v1path, unless it's a single-signal setting that needs the full path. - The protocol is
http/protobuf, not the gRPC default some SDKs fall back to. - The key is read from the environment, not pasted into a file. A
.envfile with the token in it should be in.gitignore, and the onboarding page says so under the config. - Nothing has been registered twice.
Then set LOGIT_API_KEY to the API key from the Hosted OpenTelemetry card on your stack's Endpoints page in the environment that runs the app, and start it.
Unlock complete visibility with hosted ELK, Grafana, and Prometheus-backed Observability
3. Glance at onboarding while you wait
Leave the onboarding tab open. Once you've moved on from the Install step, the page waits for your first data, and on a Logs stack Launch unlocks only when your first logs are searchable. A pipeline that has merely seen a connection doesn't count. It's a simple, honest signal that the logging side works end to end.
It won't tell you what arrived, though, or whether the service name is the one you expected. That's where MCP comes in.
4. Connect Hosted OpenSearch MCP
Hosted OpenSearch MCP is a managed, read-only MCP server for your Logs and OpenSearch stacks. It's available on Hosted OpenSearch, Log Management and Custom plans, while Hosted OpenTelemetry is on every plan, so check your plan includes it before you rely on this step. To switch it on:
- Open the stack's Settings and find OpenSearch MCP under Access.
- Select Enable. Logit.io creates
your-stack-id-mcp.logit.ioand a dedicated MCP API key, separate from your OpenSearch-eskey and from the Hosted OpenTelemetry key. - On your stack's Endpoints page, copy the example config from the OpenSearch MCP (read-only) section into Cursor's MCP settings or Claude Desktop's.
That config carries an Authorization header, so treat it like any other credential. If you use a project-level .cursor/mcp.json, keep it out of version control, or put the server in your user-level config instead. The Hosted OpenSearch MCP docs have the full steps for both clients.
5. Ask about the first data
Now the assistant that wrote the change can read the result. Start with the questions the MCP docs suggest for a first connection, then narrow down to your service:
- "List the indexes on this stack."
- "Search the most recent log index for documents from the last 15 minutes and show me the fields."
- "Find documents where the service name is
my-app. Which field holds it?" - "Do any of these log records carry a trace ID?"
Asking which field holds the service name is worth doing rather than assuming. It tells you whether the OTEL_SERVICE_NAME the assistant set actually reached the data, and it tells the assistant what to filter on for the rest of the session. If the answer is a default such as unknown_service, the environment variable didn't reach the process, and you've found that in the first minute rather than the first incident.
If the index has nothing from your app, compare notes with the onboarding tab. Waiting there as well points to export or credentials, so check the app's exporter output for 401s. Data in onboarding but not in your query usually means the search is too narrow.
What MCP won't show you
Hosted MCP reads OpenSearch on Logs and OpenSearch stacks. Traces from the Hosted endpoint go to your APM stack and metrics to your Metrics stack, so check those in the APM trace view and in Grafana. Both signals need their stack: without one, the endpoint accepts and drops them, and the dashboard shows a count.
MCP is also read-only by design. It can't create an index, change a mapping or fix a pipeline for you, and that's what makes it reasonable to leave connected in an editor. Once the first data is confirmed, the same connection is useful for the questions that come later, which our introduction to Hosted OpenSearch MCP covers. For the instrumentation side in more depth, the OpenTelemetry getting started docs and the OpenTelemetry language docs are where the prompt's setups come from.