

An alert fires about fifteen minutes after a deploy. Error rate on checkout-api is up. You are already in Cursor reviewing the release. The question is whether you can narrow the blast radius without leaving the editor for a half hour of Discover clicks.
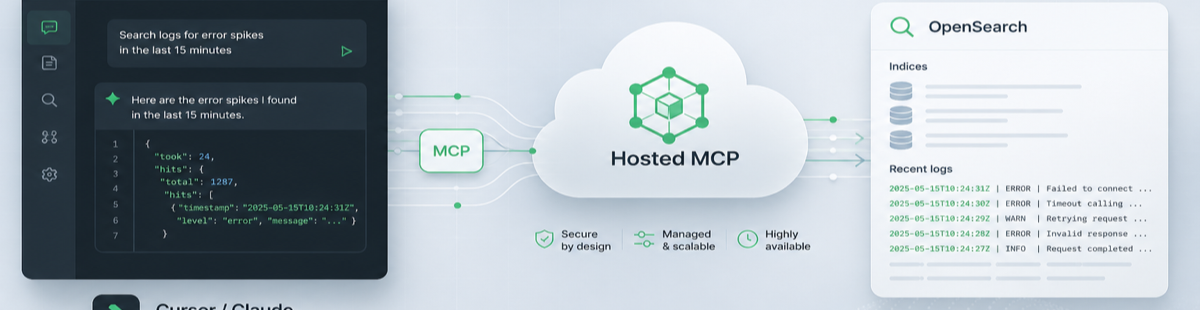
The service names, fields and timestamps below are examples; swap in your own. Hosted OpenSearch MCP is how you run that investigation from the editor. Logit.io hosts a read-only OpenSearch MCP endpoint at {stack-id}-mcp.logit.io so Cursor or Claude Desktop can call tools against your Logs or OpenSearch stack. Setup and enablement live in the Hosted OpenSearch MCP quickstart; the launch context is in Introducing Hosted OpenSearch MCP.
Contents
Start from the alert, not the cluster
Resist the urge to ask “what’s wrong in production?” Broad prompts invite broad scans. Anchor the assistant on four facts you already have from paging:
- Symptom — for example, elevated
5xxor a log line containingPaymentGatewayTimeout. - Deploy marker — release version, commit SHA, or the wall-clock time the change went live (in UTC).
- Suspected service — e.g.
checkout-api, not “the backend.” - Window — a tight range around the spike, not “today.”
Hosted MCP is read-only by design. The assistant can list indexes, read mappings, count, and search — it cannot mutate data or change cluster settings through MCP. That keeps investigation next to the code without granting write tools to the client.
Narrow time, then pick the index
Good first prompt:
We deployed checkout-api at 2026-10-08T14:05:00Z. Errors spiked after that.
List indexes or data streams that look like application logs for the last day,
then count documents matching message:PaymentGatewayTimeout between
2026-10-08T13:50:00Z and 2026-10-08T14:35:00Z. Use UTC and include a date format
on any range filter.
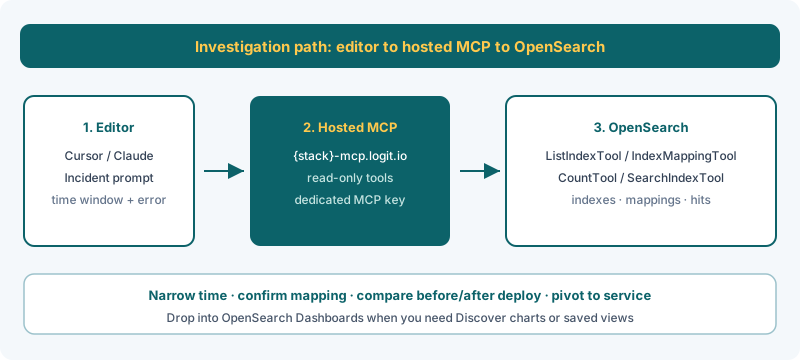
What a well-behaved client typically does:
- ListIndexTool — enumerate indexes / patterns so it does not invent
logs-*. - CountTool or a small SearchIndexTool — confirm volume in the window before pulling full hits.
- Only then widen to sample documents.
If Count returns empty, stop and check the index pattern and timestamp field before asking for “all errors.” Empty results are usually a wrong pattern or a wrong time field — not proof the incident never happened.
Confirm mappings before you filter
Hallucinated field names are the fastest way to waste an on-call hour. After you know the index, for example logs-checkout-api-*, force a mapping check:
For logs-checkout-api-*, show the mapping for @timestamp, service.name,
host.name, message, and log.level. Tell me which fields are text vs keyword
before you write term queries.
That should trigger IndexMappingTool. Use the result to choose query shapes:
- text fields →
match/match_phrase(e.g. error text inmessage). - keyword (or
.keywordsubfields) →term/termsfor exact service or host. - date ranges → include an explicit
formatsuch asstrict_date_optional_time||epoch_milliswhen the tool expects it.
If the assistant skips mappings and jumps straight to term on a text field, interrupt it. Mapping mismatch looks like “no hits” even when Discover is full of the same string.
Compare before and after the deploy
Once the index and fields are confirmed, ask for a paired comparison:
Using CountTool (or MsearchTool if you can batch), compare counts of
PaymentGatewayTimeout on logs-checkout-api-* for:
A) 2026-10-08T13:20:00Z to 2026-10-08T14:05:00Z (pre-deploy)
B) 2026-10-08T14:05:00Z to 2026-10-08T14:50:00Z (post-deploy)
Filter service.name.keyword:checkout-api. Keep size small on any search.
MsearchTool is useful when you want both windows in one round trip. CountTool is enough when you only need magnitude. Either way, prefer counts before document dumps — large result sets burn context and hide the signal.
A clear step-up after the deploy time is your cue to pull a small sample of post-deploy hits (size well under the tool maximum) and read the structured fields, not just the message string.
Unlock complete visibility with hosted ELK, Grafana, and Prometheus-backed Observability
Pivot from error text to service and host
Example follow-up once samples land:
From the post-deploy hits, group by service.name.keyword and host.name.keyword.
Which hosts dominate? Pull up to 10 recent documents for the noisiest host,
returning only @timestamp, service.name, host.name, message, and trace.id if present.
Expect SearchIndexTool with aggregations or a tight _source filter. You are looking for concentration: one host after a bad rollout, or every replica if the regression is in the build. If trace.id exists, that is your bridge out of logs into tracing UIs — MCP got you the id; it does not replace a trace viewer.
When the question turns into “show me the shape over an hour” or “save this view for the team,” stop prompting and open OpenSearch Dashboards. MCP is strong for targeted, iterative queries beside the diff; Dashboards is stronger for Discover histograms, saved searches, and sharing a picture of the spike.
Safety notes for MCP on-call
- Read-only endpoint — hosted MCP does not expose write tools; use the OpenSearch REST API when you intentionally need writes or automation.
- Dedicated credentials — use the MCP username and MCP API key from your stack's Endpoints page, not the OpenSearch
-esstack key. Rotate them from the Endpoints page when a laptop leaves the rotation or a key may have leaked. - Scope — enable MCP per stack; clients only see the stack behind that
{stack-id}-mcp.logit.ioURL. - Prompts are not a vault — do not paste secrets, session tokens, or raw PII into the chat. Refer to field names and redacted examples.
- Bound the query — tight time ranges, modest
size, and Count before Search keep responses usable and reduce accidental wide scans.
For clusters and Dashboards, see the Hosted OpenSearch overview. Node sizing lives on OpenSearch pricing (developer tier from $45.52/node/mo).
Failure modes that look like empty clusters
- Wrong index pattern — ListIndexTool first; do not assume yesterday’s naming still applies after an ILM or data-stream change.
- text vs keyword —
termon analyzed text returns nothing useful; check IndexMappingTool and use.keywordormatchappropriately. - Timezone / range mistakes — mix local wall clock with UTC
@timestampand you query the quiet hour. State timezone explicitly; prefer UTC in prompts. - Hallucinated fields — if the assistant invents
svcorhostname, make it re-read mappings before another search. - Empty results after a real alert — verify stack, index, time field, and that MCP is enabled on the stack that actually received the traffic. Connection and credential issues are covered in the MCP quickstart troubleshooting section.
- Oversized pulls — asking for thousands of raw docs fills the context window; aggregate or sample instead.
Tool names above match the core tools in the upstream OpenSearch MCP server (ListIndexTool, IndexMappingTool, SearchIndexTool, CountTool, MsearchTool, ExplainTool, GetShardsTool, ClusterHealthTool). Hosted MCP on Logit.io is the managed, read-only way to reach your stack with that style of interface — confirm the tool list in your client after you paste the dashboard config.
When to leave the editor
Stay in Cursor or Claude while you are hypothesizing, comparing two windows, or extracting a host and trace id. Move to OpenSearch Dashboards when you need visual time charts, to share a Discover session with someone not on MCP, or when the investigation becomes dashboard-building rather than a single incident thread. For cluster health beyond a quick check, ClusterHealthTool / GetShardsTool can answer “is the index even healthy?” — deep shard surgery still belongs in ops runbooks and Dashboards, not a chat transcript.
Get started
Enable OpenSearch MCP under stack Settings → Access, copy the config from Endpoints, and connect Cursor or Claude Desktop using the Hosted OpenSearch MCP quickstart. Keep the first real prompt as boring as possible: list indexes, read mappings, count in a tight UTC window, then search. That sequence — more than clever wording — is what turns an error spike after a deploy into a short, evidence-backed investigation.