
Resources
6 min read
Among the arsenal of tools available for monitoring and managing an organisation’s mission critical applications and service, New Relic is a popular choice for many users. In our article, we will delve into the world of New Relic Dashboards, shedding light on the best use cases that demonstrate their visualisation capabilities. From e-commerce giants managing high-traffic websites during peak shopping seasons to fintech companies ensuring the security and reliability of financial transactions, these dashboards can provide a helpful starting point in terms of inspiration for your next monitoring project.
Contents
Butler SOS
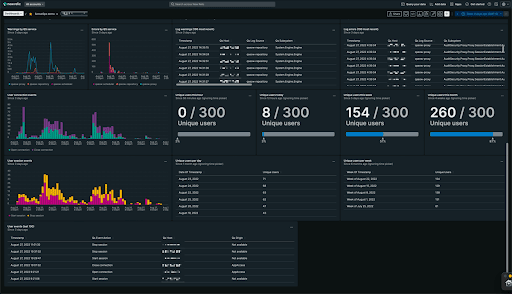
This Butler SOS dashboard is designed to pull data from Butler SOS and Butler to enable simple monitoring. This dashboard also highlights access to logs for failed reloads from within New Relic. The dashboard presents a range of metrics including, but not limited to warnings by OS service, unique users per day, user connection events, log warnings, and user session events.
K6
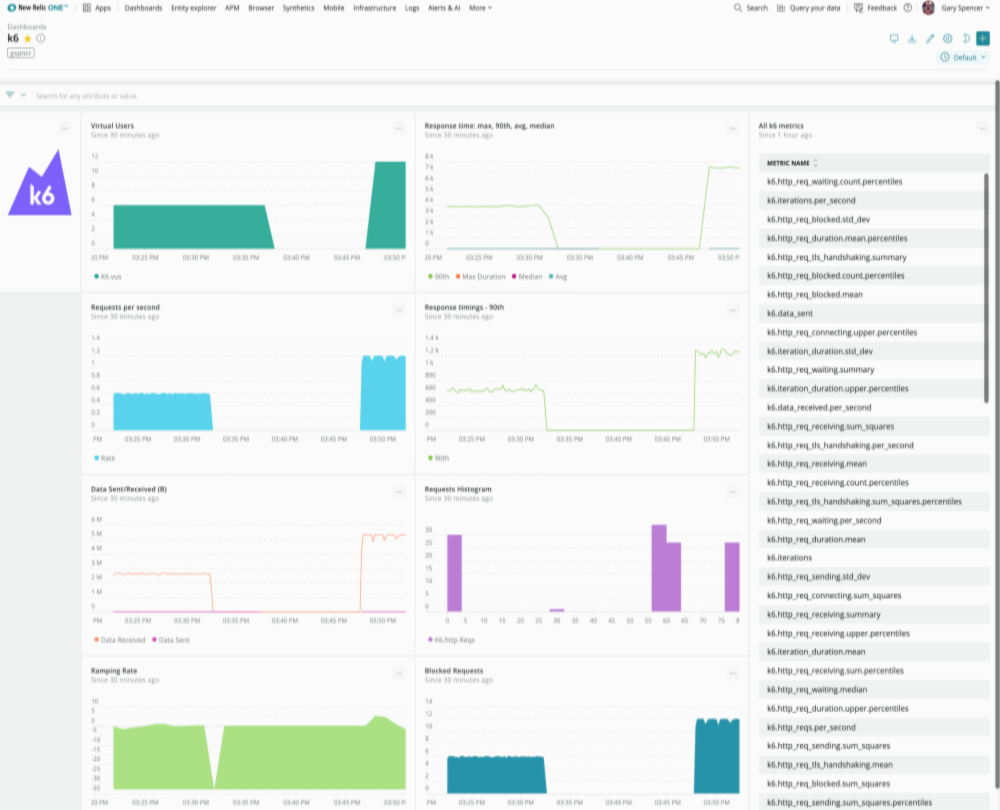 Grafana's k6, is an open-source tool, which simplifies performance testing for engineering teams, offering a free, developer-friendly, and extensible solution to assess system reliability, detect regressions, and enhance the scalability and resilience of applications.
Telemetry data can be shipped from k6 to New Relic via the New Relic StatsD integration. With this dashboard, you can visualise k6 performance data alongside your real user's data and server-side performance. This k6 dashboard enables you to view metrics including but not limited to requests per second, virtual users, and response timings.
Auto Javascript Interactions
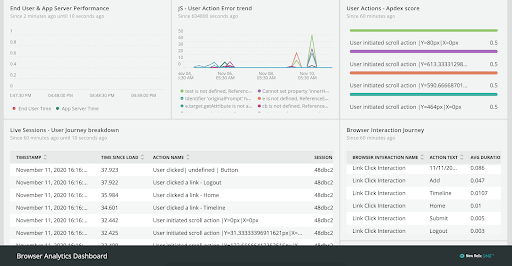
The auto javascript interactions dashboard enables auto tracking and the collection of user actions and interactions to then add it to the New Relic Browser Agent Service as dynamically collected analytics. This dashboard presents a range of metrics including, but not limited to, end user & app server performance, user action error trend, and browser interaction journey.
Alerting Dashboard
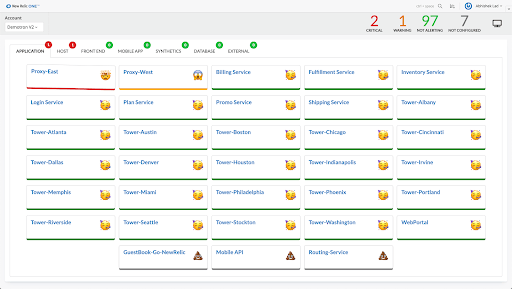
This alerts dashboard goes further than the traditional static view with the health of your services. The dashboard supplies a simplified clean UI and a unique solution for the colour blind community by not focusing on colour coding and instead uses visual cues like wobble effects or pictorial references. With this dashboard you can view the health of numerous services across applications, hosts, front end, and others.
Postman
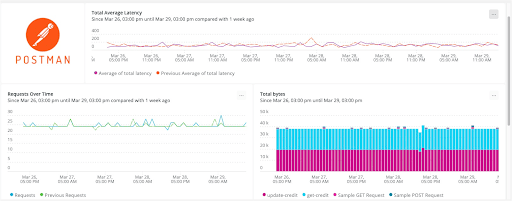
The Postman integration with New Relic provides a dashboard that presents you with a suggested view for API monitoring. With this dashboard, you can query and display metrics. The dashboard supplies a range of metrics such as, total average latency, requests over time, and total bytes.
Machine Learning
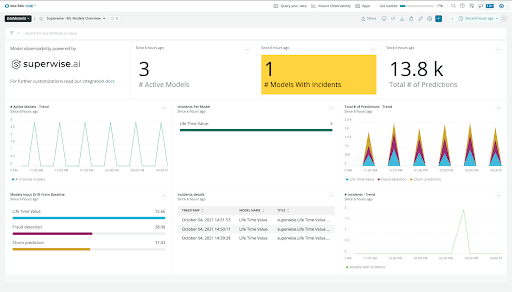
This Superwise.ai dashboard for New Relic provides you with information regarding your active models, their activity status, drift levels, and any open incidents detected for specific time intervals or filters. The dashboard supplies enhanced monitoring of your machine-learning models by delving into the specifics of each model, such as the total number of predictions during the filtered timeframe.
Geckoboard Dashboard
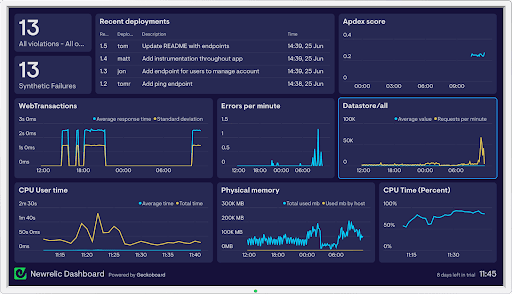
The Geckoboard dashboard enables you to make key performance metrics relating to your web and mobile applications, visible and understandable. Also, you can add metrics from other data sources to supply a holistic view of the performance of your system. This dashboard presents a range of metrics including but not limited to recent deployments, errors per minute, and CPU user time.
eCommerce Reporting
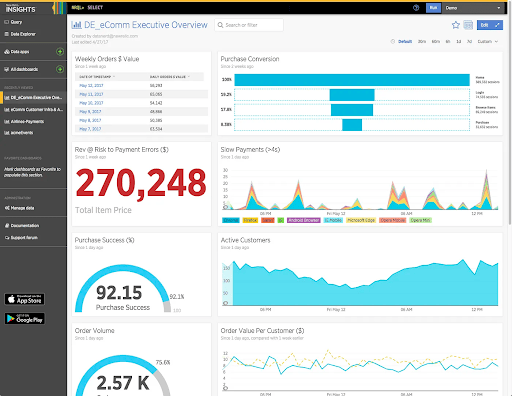
Gaining visibility into your eCommerce platform is vital for retailers and this New Relic dashboard offers users exactly that. This dashboard provides you with real-time data and updates, to ensure that you never miss anything. With this dashboard, you can view a variety of metrics including but not limited to purchase conversion, order value per customer, and weekly order value.
Error Reporting Dashboard
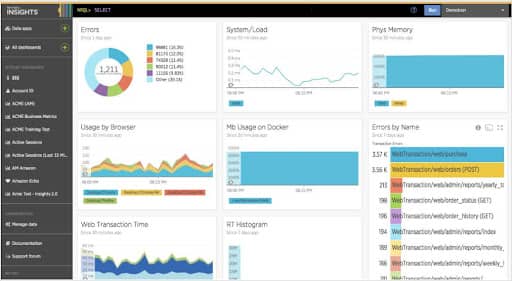
This New Relic errors dashboard enables you to effectively monitor your application or system for errors. Alerts can be configured for this dashboard ensuring a prompt response when issues or errors arise. With this dashboard, you can view metrics such as errors, errors by name, usage by browser, web transaction time, and MB usage on Docker.
PHP Application Performance
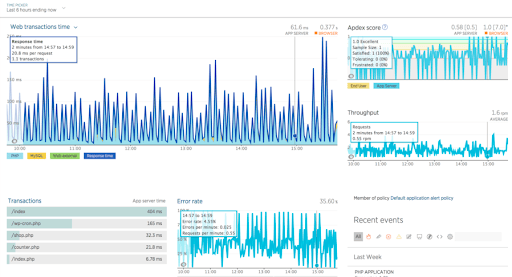
With New Relics application monitoring you can create a dashboard for your PHP applications. Utilising real-time data, this dashboard provides a range of charts and tables, enabling you to conduct analysis and find the exact areas that are a cause for concern. With this dashboard, you can view numerous metrics relating to your applications such as throughput, error rate, and web transaction time.
Speedscale
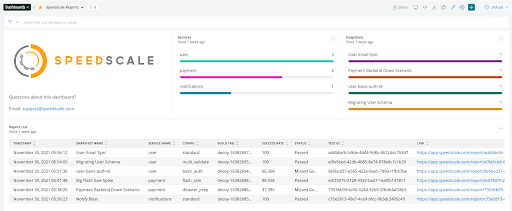
This Speedscale dashboard exports data from your Speedscale environment to New Relic, providing you with enhanced visibility and analysis into your environment. Speedscale’s tool captures the traffic of your app, enabling you to review, filter, and distil this traffic into snapshots that run as tests or mocks, with no scripting required. With this dashboard, you can view metrics like services, snapshots, and report lists.
Azure Spring Cloud
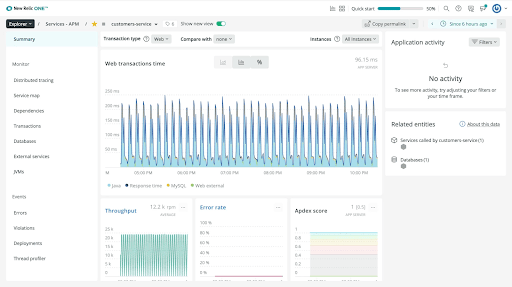 This dashboard is another example that utilises New Relic’s APM to provide visibility into your applications. In this example, the application is Azure Spring Cloud. With this dashboard, you can drill down into numerous aspects of your application, such as Java Virtual Machines, and view the stack trace of each thread. The dashboard provides a variety of metrics such as web transaction time and other key metrics around application activity.
Snyk Security Dashboard
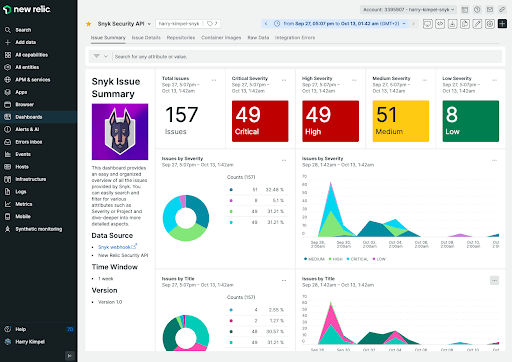
With This New Relic dashboard for Snyk you can view data relating to your Snyk projects with the configured retest frequency. Snyk is a developer security platform that enables application and cloud developers to secure their whole application. This dashboard presents a variety of metrics including but not limited to issues by severity, total issues, and issues by title.
Cloudflare Network Logging
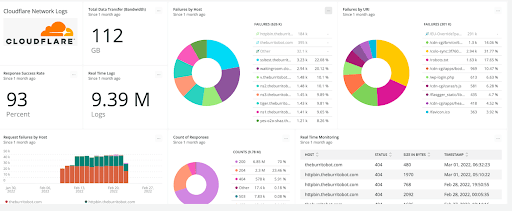
With the Cloudflare dashboard for New Relic you can attain full observability into your Cloudflare logs. Analysing Cloudflare logs across your entire infrastructure within New Relic One is powerful for monitoring and troubleshooting, guaranteeing the security and reliability of your services. With this dashboard, you can view metrics such as failures by host, total data transfer, and count of responses.
Browser Monitoring
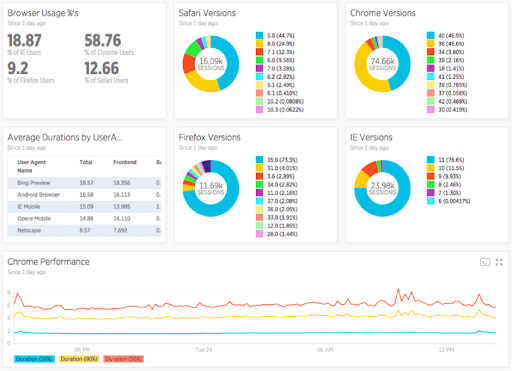
This dashboard for browser monitoring tracks everything involving HTTP requests and HTTPs made in a browser, such as loading times with histograms, percentiles and graphs with segmentation through to graphic reports, and performance with the whole backend. With this dashboard, you can view a range of metrics such as browser usage, chrome performance, and Safari versions.
We hope that you found this guide to the leading New Relic dashboards useful, if you are looking for a highly affordable and scalable alternative to New Relic you should consider our New Relic alternative and explore Logit.io’s free 14-day trial to start unlocking the insights hidden within your data.
If you found this article informative then why not consider reading Dynatrace alternatives or Loggly alternatives next?