
Resources
8 min read
Last updated:
There are many advantages to using dashboards that are powered by open-source technology that make them a compelling choice for many organizations. These tools provide flexibility, allowing users to customize and tailor dashboards to meet specific business needs without the restrictions of proprietary software. With access to a vast range of community-driven plugins and integrations, open source dashboards can be easily extended and adapted. Also, open source solutions are often cost-effective, as they eliminate the need for expensive licenses, making them ideal for businesses looking to scale without incurring high software costs.
Below we will discuss some of the major benefits of using dashboards that are built with the help of open-source technology, along with examples of some of the leading use cases for which open-source technology has been utilized.
Contents
- Cost-effective
- Customizability
- Community-driven development
- Security and transparency
- Integration and extensibility
- What concerns are there about open-source programs?
- What recommendations are provided for users to select the most suitable dashboard tool based on their specific needs and preferences?
- 1. Monitor OpenStack Instances
- 2. Monitoring Use Container Engine for Kubernetes (OKE)
- 3. Visualise Log Data
- 4. SIEM Dashboard
- 5. System Monitoring
- 6. Marketing
- 7. DORA Metrics
- 8. MySQL, PostgreSQL, and Microsoft SQL Server
- 9. eCommerce
- 10. React.js
Cost-effective
Typically, open-source software is free to use and distribute, which greatly reduces the cost of implementing and maintaining a dashboard, as using these solutions reduces the number of resources required to do so. Instead of paying expensive licensing fees, organizations can allocate their budgets to customizations, support and other essential areas.
Customizability
Dashboards based on open-source software offer a great deal of flexibility and can be customized to meet the needs of the user. The source code for the application can be accessed by developers, modified, and new features can be added according to their requirements. A dashboard can be customized at this level of customization in order to align with the unique business processes and workflows that an organization employs.
Community-driven development
In many open-source projects, there are vibrant communities of developers and contributors. It is through this community involvement that continuous development, bug fixes, and improvements can be achieved. As a result, organizations using open-source dashboards will be able to take advantage of a wide range of features and enhancements that have been added by the community, which will ensure that the software remains up-to-date and relevant for as long as possible.
Security and transparency
It is important to consider that open-source technologies allow the community to transparently examine the source code, making it easier to identify and patch security vulnerabilities as soon as they arise. As a result of having many eyes on the code, better security practices can be ensured. In addition, organizations can perform their own security audits or hire a third-party expert to assess the code, providing an additional layer of assurance.
Integration and extensibility
It is common for open-source dashboards to provide APIs (Application Programming Interfaces) and to support a number of integration options. As a result, it is easier to connect with other systems, databases, or tools that are part of an organization's infrastructure, thus allowing better integration. By integrating data from a variety of sources seamlessly, a comprehensive dashboard can be created, which includes a variety of data from different sources and allows data to be visualized in one place. Wide adoption and ecosystem
As a result of the widespread adoption of open-source dashboard software, most of these tools have fostered active ecosystems to support them. This means that there is an extensive amount of documentation, tutorials, forums, and community-led support available across many tools.
What concerns are there about open-source programs?
A common concern regarding open-source programs is security. While open-source software can be very secure, it could be vulnerable to security flaws and vulnerabilities, just like proprietary software. Timely patching and vulnerability management are necessary to maintain the security of open-source components.
What recommendations are provided for users to select the most suitable dashboard tool based on their specific needs and preferences?
To select the most suitable dashboard tool based on your specific needs and preferences, it is recommended to first evaluate a wide range of dashboard tools available. Consider the purpose of the dashboard, the features it offers, the types of data it can handle, and the target users it is designed for. Recognize that no single dashboard tool is universally perfect for all users, as each tool comes with its own set of advantages and limitations.
Therefore, it is crucial to identify the features that are essential for your work requirements and preferences. Consider factors such as data visualization options, customization capabilities, ease of use, integration with other tools, scalability, and support services. By understanding your specific needs and priorities, you can make an informed decision to choose the dashboard tool that aligns best with your requirements and enhances your data visualization experience.
1. Monitor OpenStack Instances

This dashboard makes use of Graphite, which is a monitoring and graphing tool which can be used to track and visualize the performance of computers in the cloud. OpenStack performance tracking provides insight into the performance of OpenStack instances and ensures that the application and service run smoothly on the cloud infrastructure as well as the OpenStack infrastructure as a whole.
2. Monitoring Use Container Engine for Kubernetes (OKE)

This dashboard uses Prometheus, which is an open-source monitoring and alerting toolkit developed initially for SoundCloud and is now used for a wide range of metrics projects. Among the most popular uses of this tool is for monitoring systems and applications in environments using cloud-native technologies. By monitoring OKE with Prometheus, users will be able to get a better understanding of the health and performance of their Use Container Engines for Kubernetes.
3. Visualise Log Data
In order to create this dashboard, OpenSearch is used. OpenSearch is an open-source search engine, created by Amazon, that’s used to search different sources of information, such as websites, databases, and other data repositories. By visualizing log data, we can learn a lot about the performance of systems and applications, and dashboards can prove extremely useful when it comes to identifying any issues or problems. A dashboard like this can be used to monitor error logs and to track errors over time, making it easier for you to determine when an error started and how it has progressed as a result of the error.
4. SIEM Dashboard
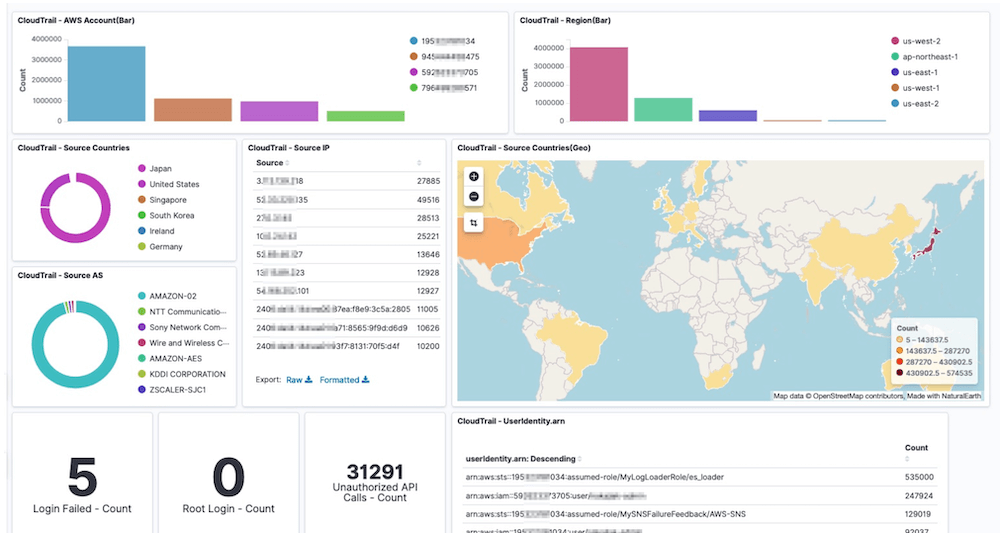
A dashboard such as this one makes use of Kibana, an open-source tool for data visualization and exploration, which is part of the Elastic Stack. In order to improve their organisation's observability, security analysts can use this dashboard to get started with implementing SIEM tools in order to protect their wider security. Furthermore, this dashboard can also be configured so that it shows what processes are currently running by name, as well as the top processes based on how many event logs are being generated.
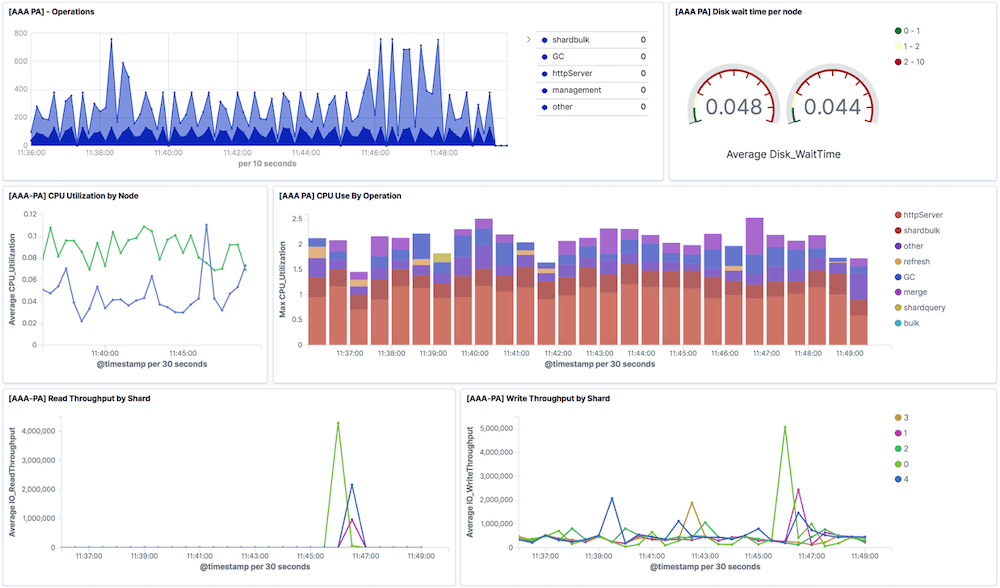
5. System Monitoring

The backend of this dashboard relies on InfluxDB, an open-source time series database that was designed to handle high write and query loads for time-stamped data. In addition to being optimized for time-series data, InfluxDB also provides fast query response times, regardless of how large your dataset is. To be able to track and analyze the performance of the system in real-time, this is crucial in order to monitor and analyze its performance. As a supplement to InfluxDB, Grafana, another open-source visualization tool, is also used in this dashboard in order to display system monitoring metrics.
6. Marketing

This marketing dashboard is from PlainAdmin, an open-source solution based on Vanilla Javascript, Bootstrap 5 and HTML 5. PlainAdmin is supplied with over 300 UI elements, such as common applications, forms, graphs and supporting plugins, providing you with extensive customizability.
7. DORA Metrics
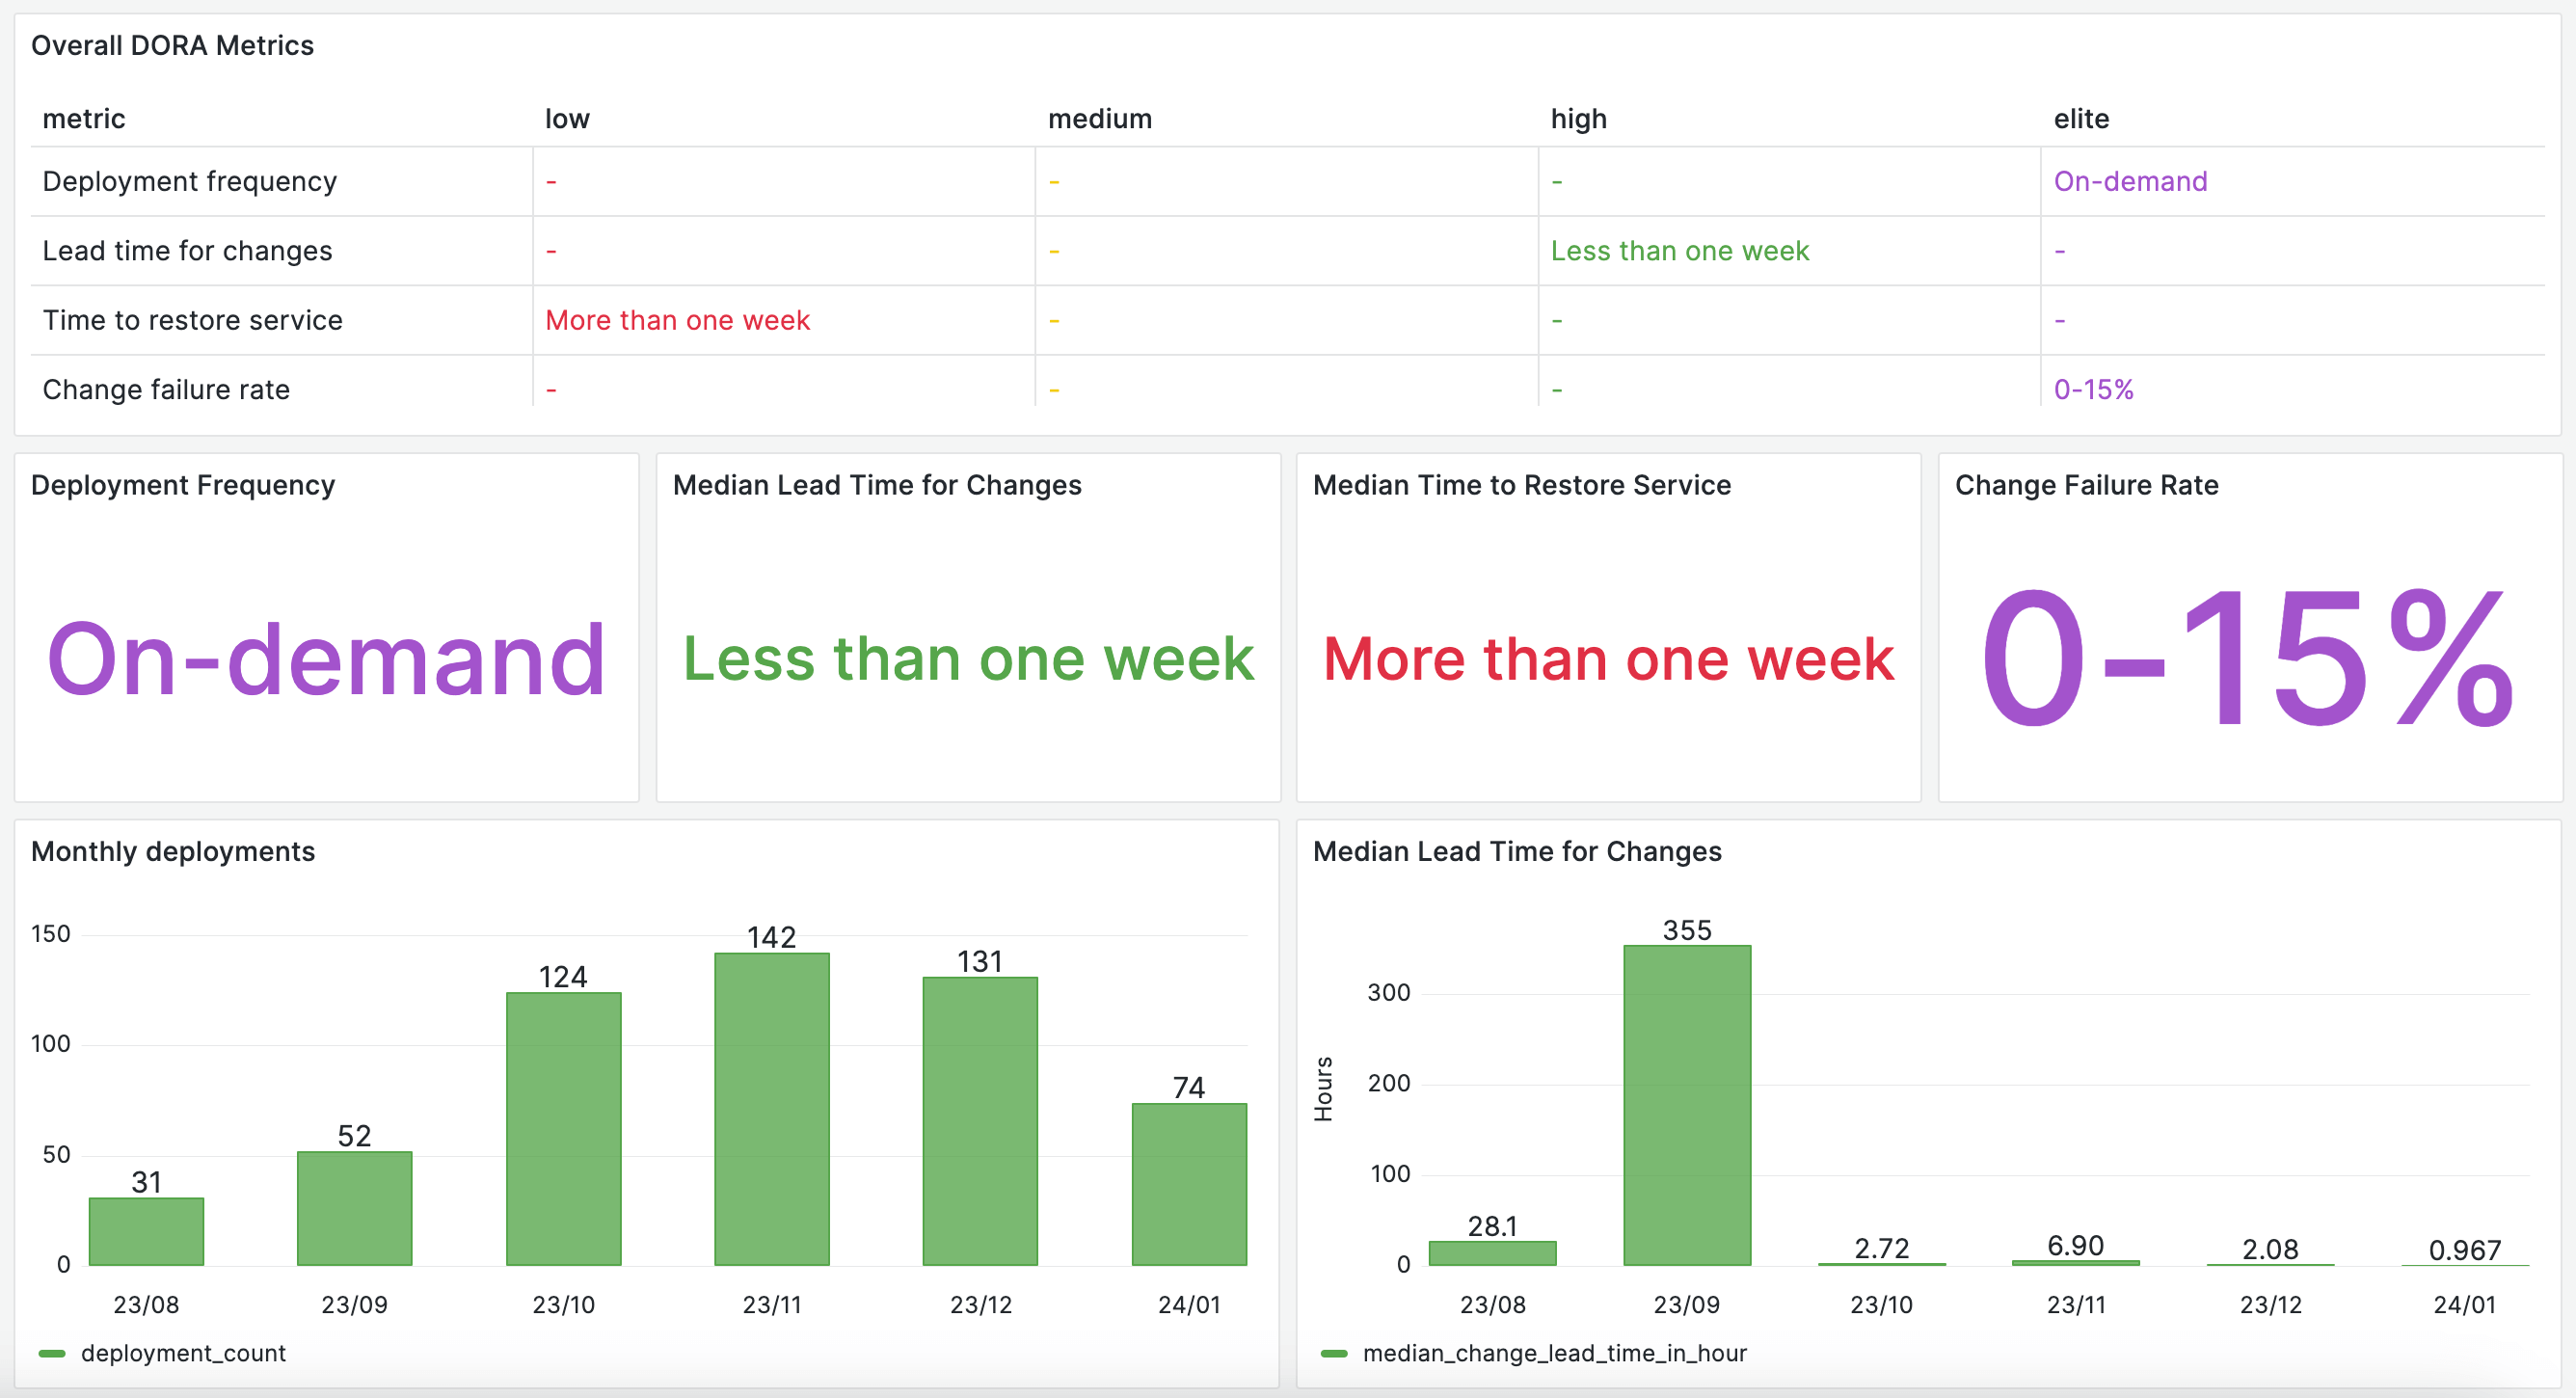
This dashboard presents DORA metrics, provided by Apache DevLake. Apache DevLake ingests, examines, and visualizes the fragmented data from DevOps tools to attain insights for engineering excellence. DevOps Research and Assessment (DORA) highlighted four key metrics that aim to indicate the performance of a software development team. These four metrics are deployment frequency, lead time for changes, change failuree rate, and time to restore service.
8. MySQL, PostgreSQL, and Microsoft SQL Server

With QueryTree you can produce simple yet powerful reports and dashboards, enabling you to gain insights from your application's database. Utilizing QueryTree you can connect to MySQL, PostgreSQL, or Microsoft SQL Server databases using secure encrypted connections. The solution requires little to no technical knowledge as you use the simple drag and drop interface to build queries and reports.
9. eCommerce
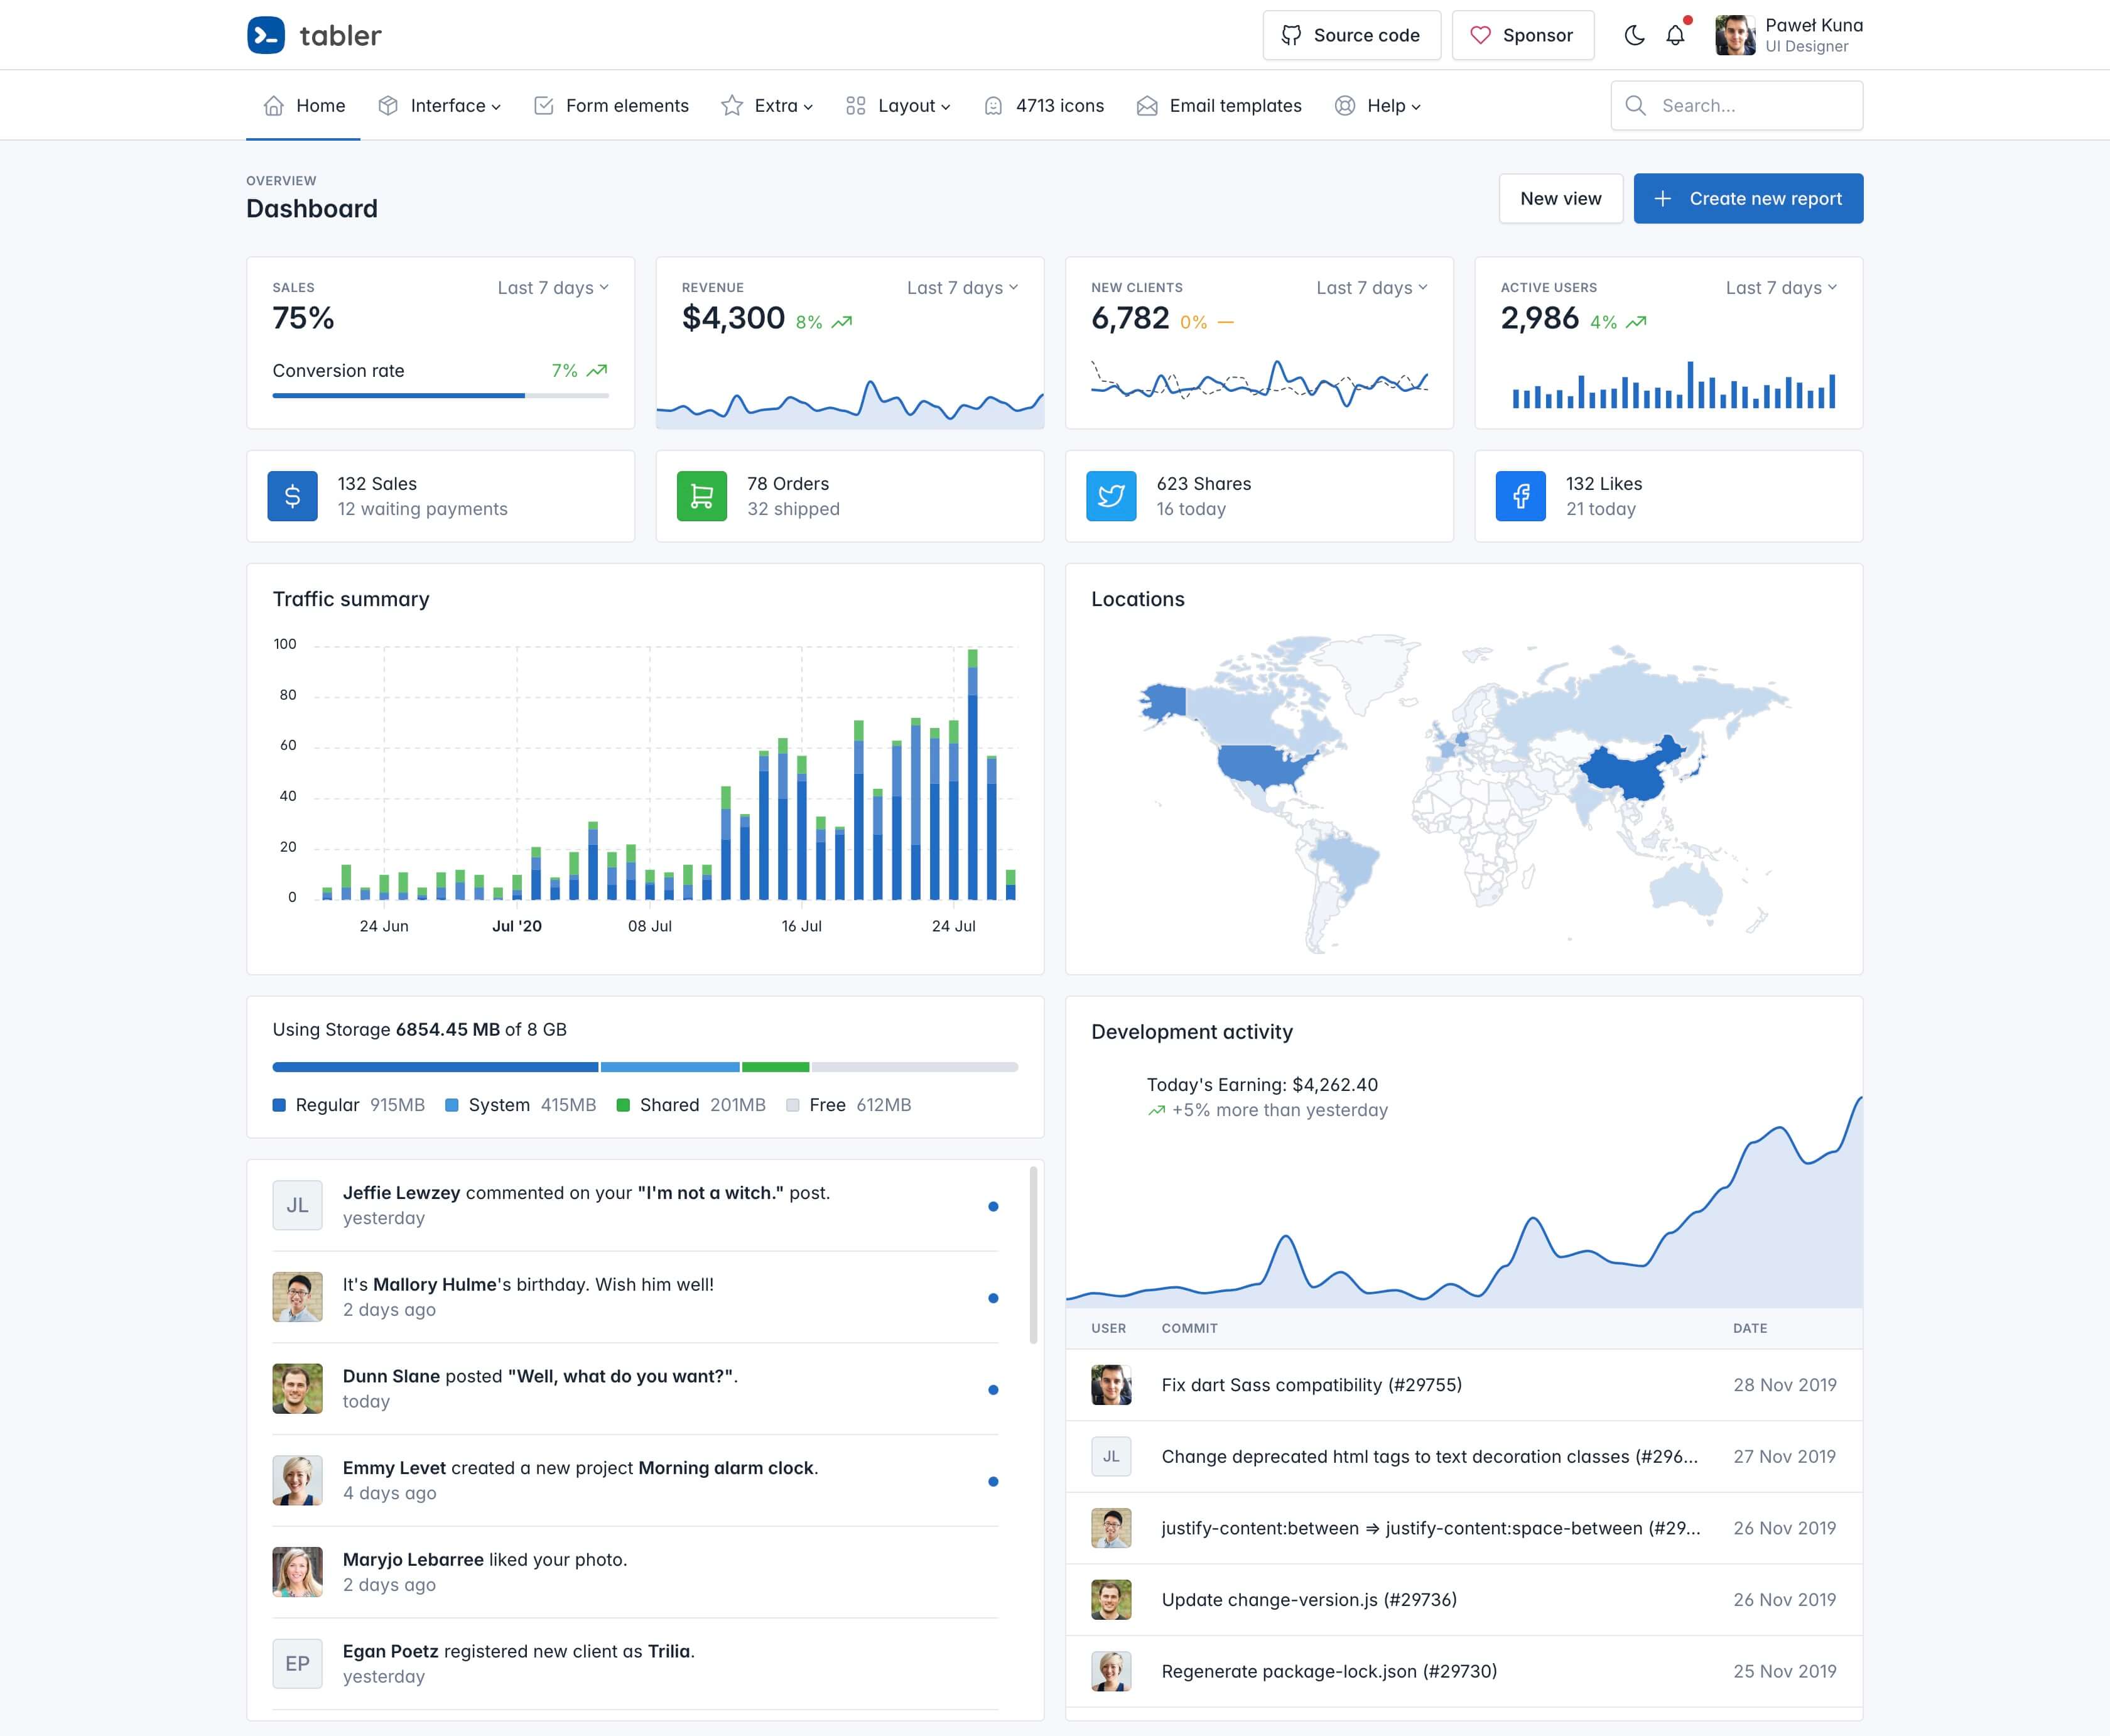
To create this eCommerce dashboard, Tabler is utilized. Tabler is a responsive, modern, and user-friendly tool that provides numerous dashboards. The tabler theme operates effectively with the latest desktop and mobile browsers. This particular solution follows Bootstraps guidelines ensuring your integration is as simple as possible.
10. React.js
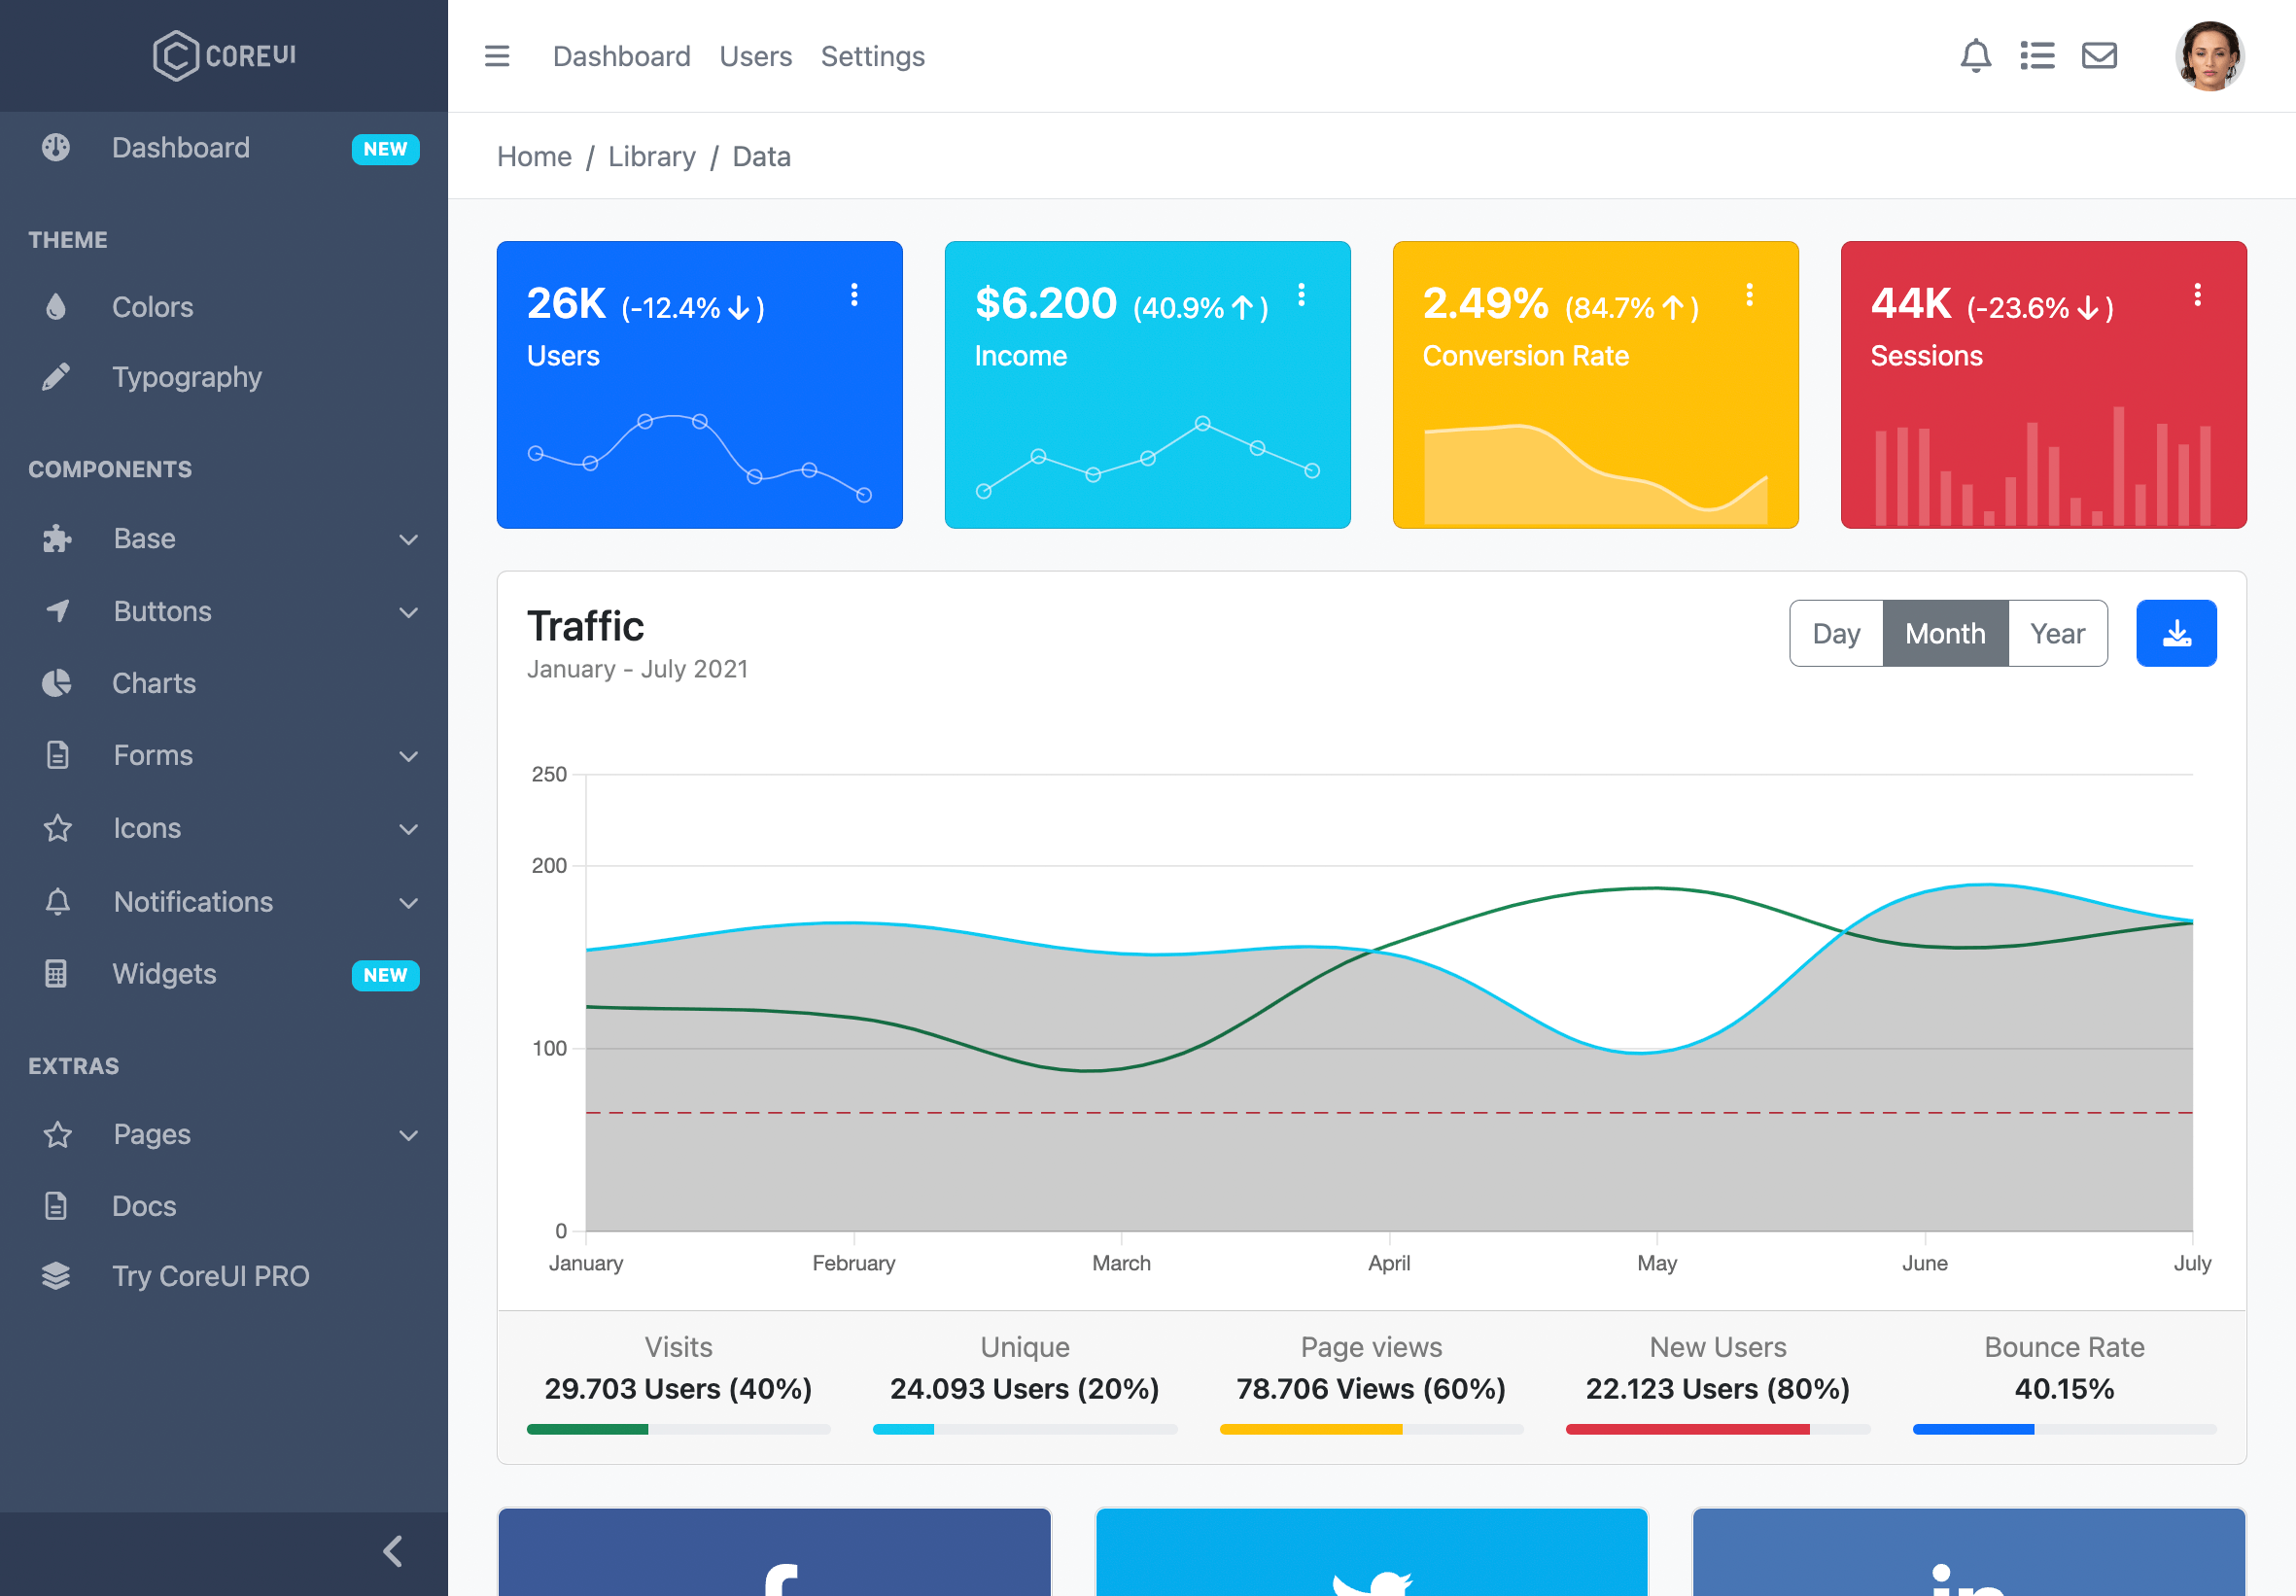
This dashboard for React.js is designed using CoreUI. CoreUI provides an open-source React dashboard template built on the enterprise-grade, hand-crafted UI Components Libarary. The solution provides a powerful, user-friendly UI to assist you in building web apps faster than before. Their templates are designed by designers and coded by developers, so they provide great design and high quality clean code.
If you want to get started with using the leading open-source dashboard soluitions, OpenSearch, Grafana, Prometheus, or Kibana then why not sign up for a free 14-day trial of the Logit.io platform or contact us if you have any questions regarding our platform? You can experience all of these tools and more fully hosted in a centralised location that provides a single source of truth across all of your key infrastructure. By opting for hosted solutions, you don't have to concern yourself with time-consuming and complex configuration and maintenace as this will be handled by us. This allows you to focus on your organizations operations.
Unlock complete visibility with hosted ELK, Grafana, and Prometheus-backed Observability
Start Free TrialIf you found this article informative then why not read about game analytics or see our InfluxDB dashboards next?