Resources
9 min read
Last updated:
OpenSearch dashboards are a powerful tool for visualising and exploring data stored in an OpenSearch-compatible data store such as Elasticsearch. With OpenSearch's intuitive interface and advanced analytical tools, this visualisation tool makes it easy to gain insights into your data and monitor and alert upon key metrics.
Throughout this article, we'll look at some of the most impressive OpenSearch dashboard examples that showcase it’s capabilities and versatility.
Contents
What are Opensearch Dashboards?
OpenSearch dashboards enable users to interact with data stored in OpenSearch-compatible databases, such as Elasticsearch, through its graphical interface. Users can manipulate data in these dashboards to gain new insights and view data in a variety of formats, including charts, graphs, and tables.
OpenSearch dashboards offer users the ability to easily visualize large amounts of data in an easy-to-understand and meaningful manner. If you have log data stored in Elasticsearch, for example, you can display the data in a line chart that shows the number of log entries over time. Hence, it is easier to spot trends and patterns in data than it would otherwise be without the use of this data visualisation tool.
Users have access to a range of analytical tools in OpenSearch dashboards, including filtering, aggregation, and drill-down capabilities. Through these tools, users can gain a deeper understanding of the information by focusing on specific aspects of the data. For example, if you have website traffic data stored in Elasticsearch, you can use an OpenSearch dashboard to filter the data based on specific criteria such as geographical location, browser type, or referral source.
Users can also customize OpenSearch dashboards according to their specific needs and requirements. You can create custom visualisations, alter the design and layout of the dashboard, and add more data sources. In summary, OpenSearch dashboards enable users to visualize and explore data stored in OpenSearch-compatible data stores.
1. Visualise Log Data
 Credit: OpenSearch
The visualisation of log data can highlight a lot of information about the performance of systems and applications, and dashboards can help you identify any issues or problems quickly.
Using this OpenSearch dashboard, you can monitor error logs and track errors over time, making it easier to identify when a problem has started and how it has evolved.
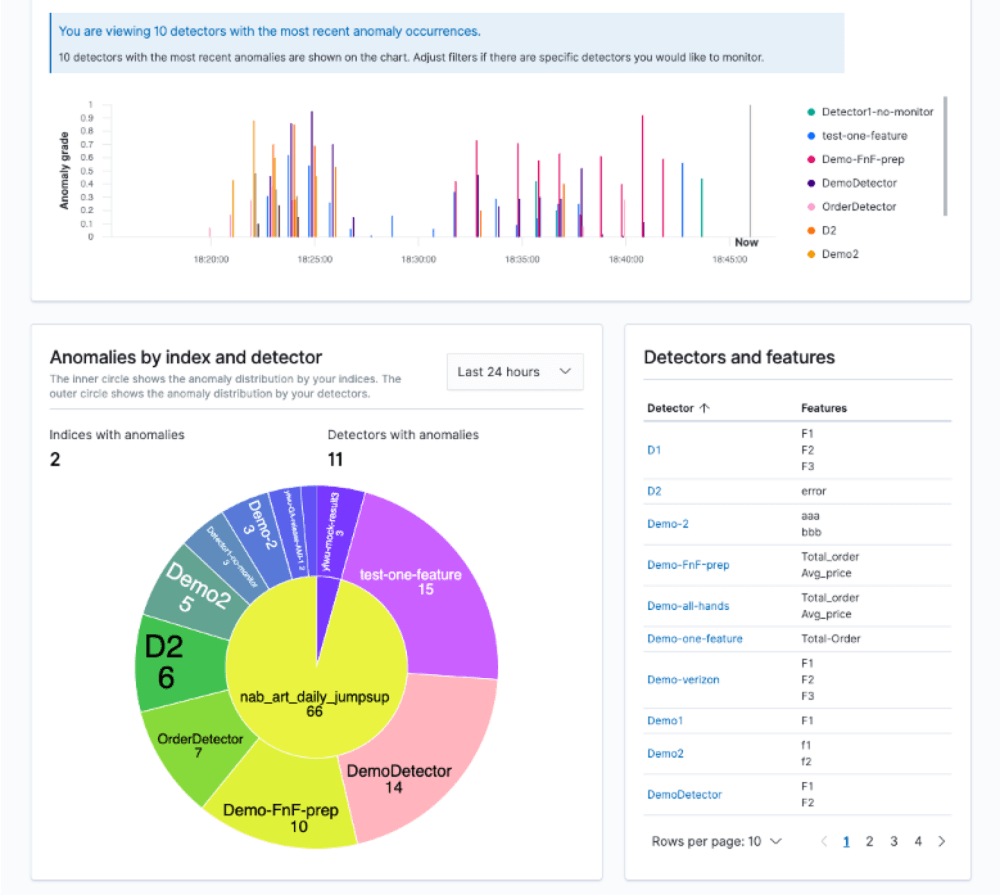
2. Anomaly Detection
 Credit: Jey Vell and Jon Handler
By detecting patterns or behaviors that deviate from the expected norm, anomaly detection can be used as an early warning system. An alert can be generated by the system when an anomaly is detected, allowing you to take action before it becomes more serious.
When monitoring the performance of a web server, anomaly detection can be used to detect sudden spikes in traffic or a decrease in response time. If this occurs, there may be a problem with the server, such as a resource bottleneck or a problem with the infrastructure. Detecting the problem early allows you to resolve it before it affects the server's performance or impacts the user's experience.
Unlock complete visibility with hosted ELK, Grafana, and Prometheus-backed Observability
Start Free Trial3. Performance monitoring
 Credit: OpenSearch
By providing insight into how systems and applications are functioning in real-time, performance monitoring provides valuable information that can be used to improve debugging. Performance metrics such as response time, resource utilization, and error rates can help you identify areas where performance is not meeting expectations, and guide your debugging efforts accordingly.
When monitoring the performance of a web application, for example, you can analyze performance metrics to determine which parts of the application are slow. Information like this can assist you in identifying the problem's root cause and provide guidance on how to resolve it.
Monitoring performance can also reveal how changes to systems and applications impact performance. Using performance monitoring, for instance, you can determine if changes to an application have had the desired effect after they are made.
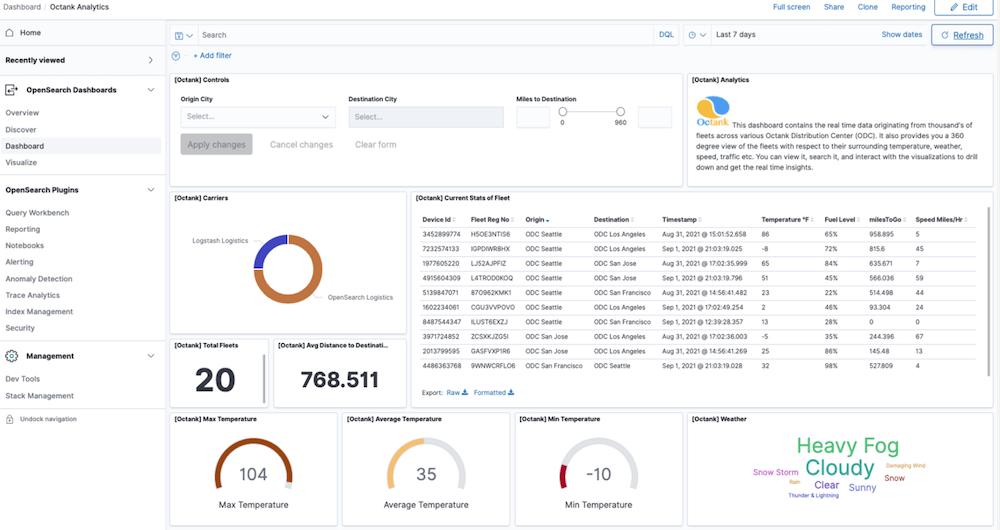
4. Fleet Management Dashboard
 Credit: OpenSearch
The performance of a fleet of vehicles or assets can be measured in real-time using a fleet management dashboard, which enables managers to make data-driven decisions about how best to optimize fleet performance. A fleet management dashboard can increase operational efficiency in the following ways:
Optimising routes and reducing travel time is possible with a fleet management dashboard, which provides information about the location and movement of vehicles. In order to select the fastest and most efficient routes for your vehicles, you can use real-time traffic information and vehicle location data.
You can also use a fleet management dashboard to identify opportunities for more efficient scheduling by analyzing the utilization of assets and vehicles. Using idle time data, you can determine which vehicles are underutilized and allocate them to routes that require more use.
Monitoring fuel consumption allows you to identify areas for fuel efficiency improvement. The fuel consumption of individual vehicles can be monitored and compared to industry benchmarks to determine which vehicles are consuming more fuel than usual.
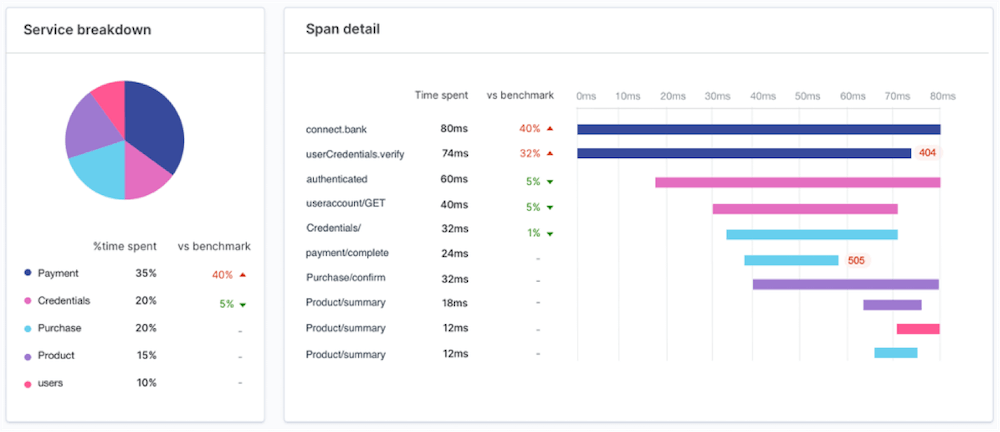
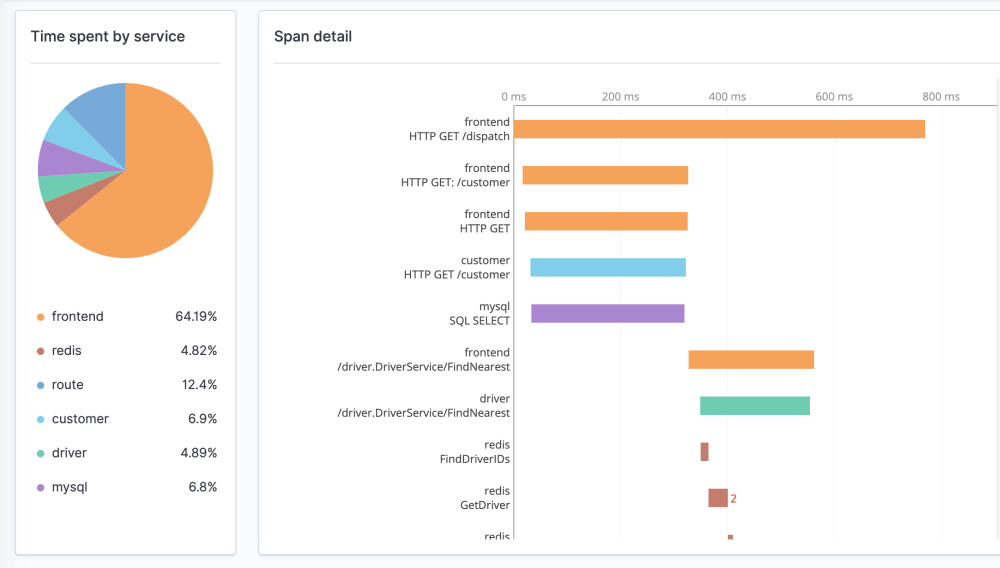
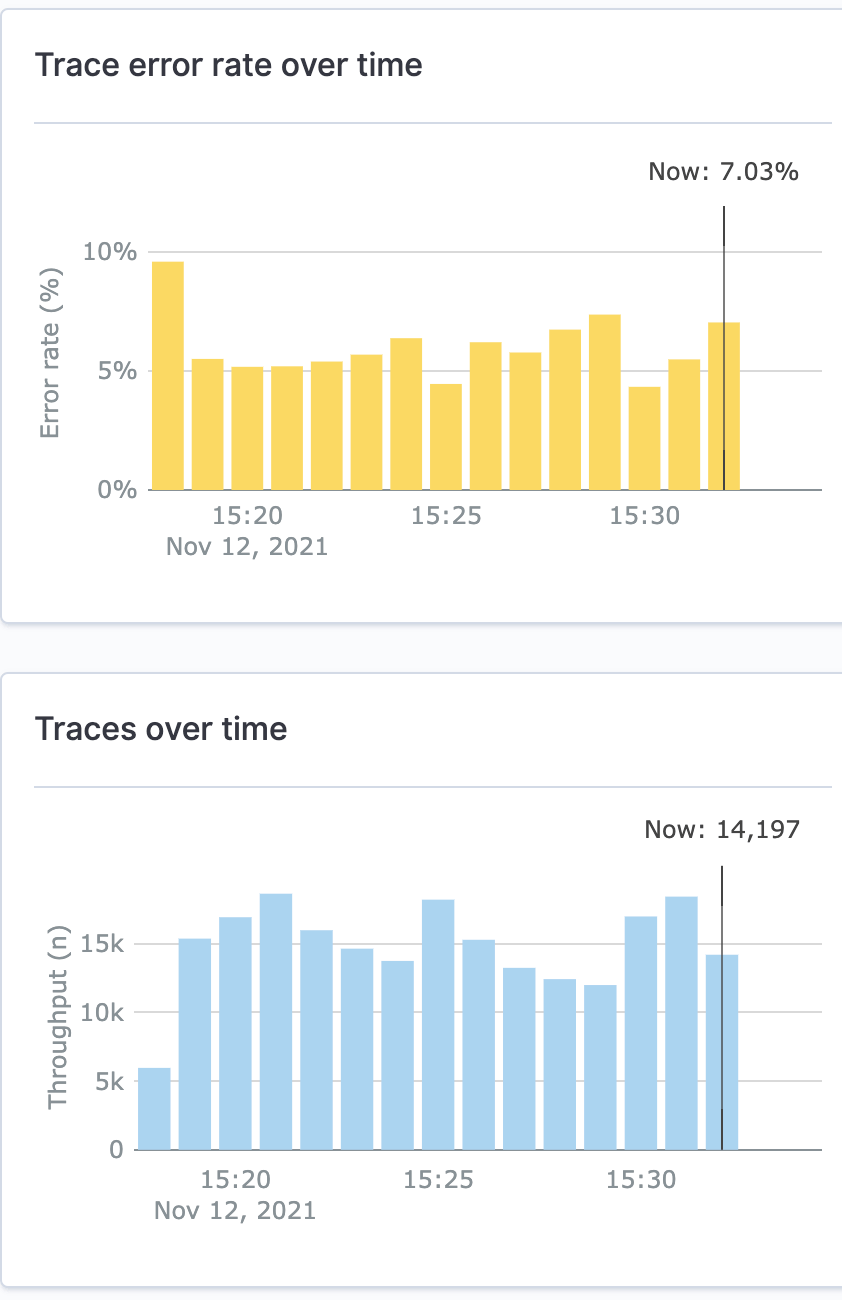
5. Tracing
Credit: OpenSearch
In a distributed system, distributed tracing provides detailed information about the flow of requests and responses between microservices. Tracking this information will help you identify issues quicker and more accurately.
Distributed tracing aims to provide a complete view of the interactions between microservices, allowing you to see how each microservice is affecting the others. This information can help you understand the relationships between microservices and identify interdependencies that may be contributing to the issue.
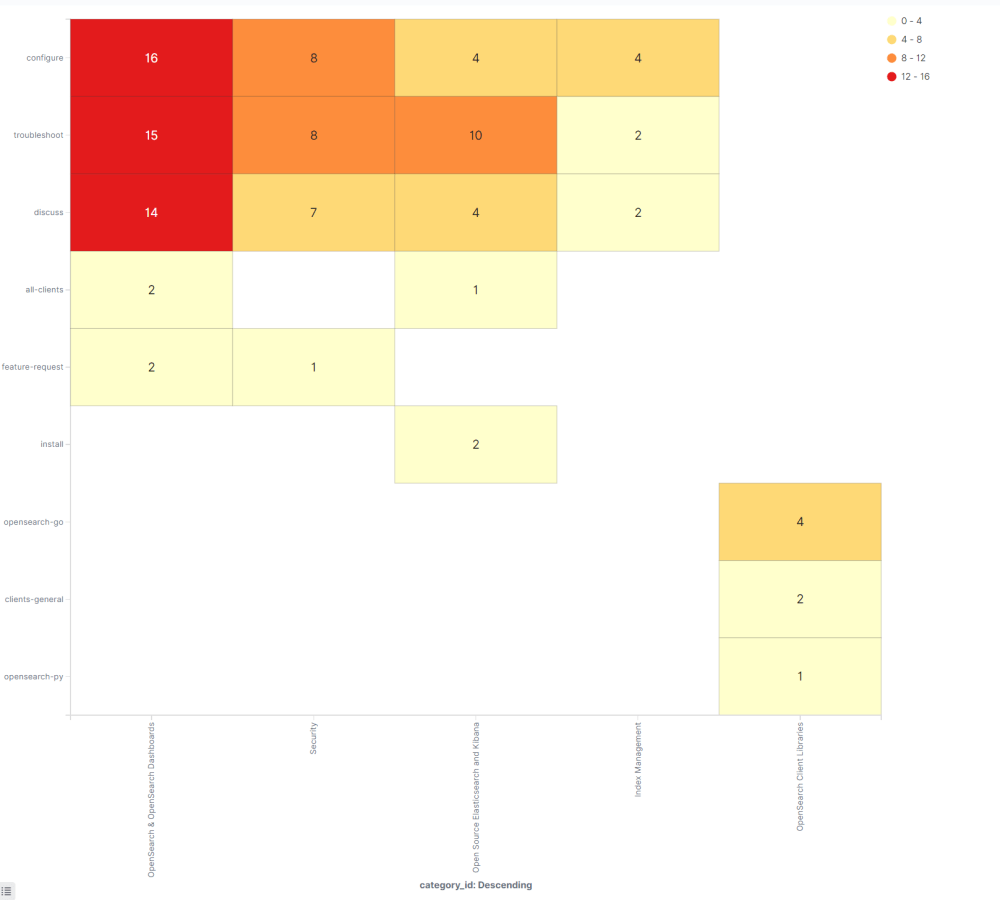
6. Content Compass Heatmap
 Credit: Nate Boot
A content compass heatmap is a graphical representation of user behavior on a website. You can use it to understand how users interact with your content by seeing where they click on a website.
A content compass heatmap typically uses color to indicate the level of engagement, with warmer colors indicating areas of high engagement and cooler colors indicating areas of low engagement. Red areas of a website may be represented by a lot of clicks, while blue areas may be represented by only a few clicks.
Content compass heatmaps provide a variety of useful information. Using the information, you can learn which areas of your website are attracting the most attention, and which areas are being overlooked. This information can then be used to optimize your website by making changes to the content or layout to increase engagement.
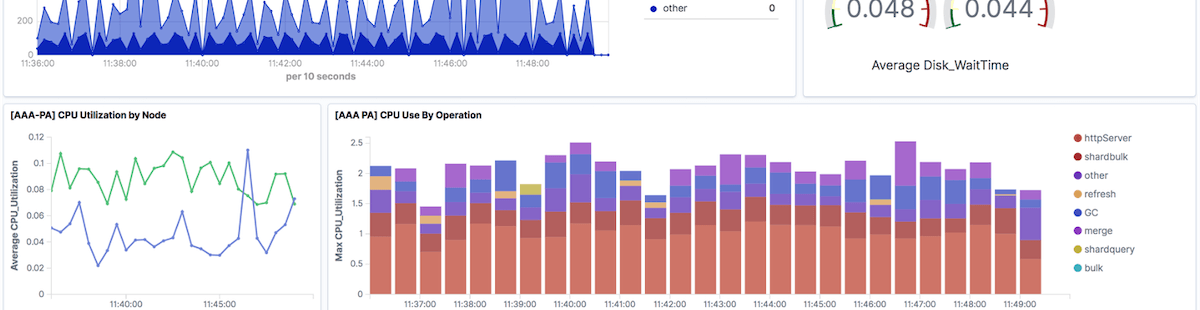
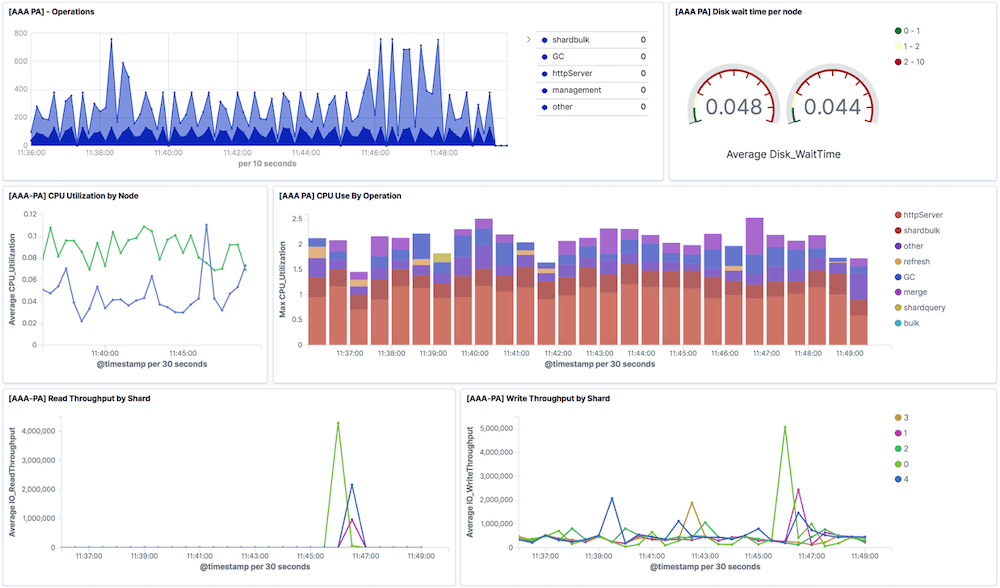
7. CPU Performance
 Credit: OpenSearch
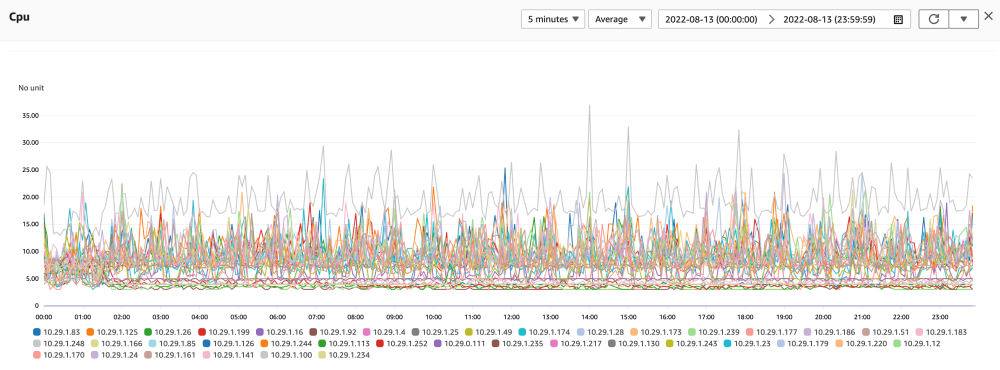
Monitoring CPU performance is helpful for capacity planning because it provides information about the current and future resource requirements of your systems. When you monitor CPU usage over time, you can identify trends in resource utilization and decide when to add or remove resources based on the available data.
A consistently high CPU usage, for example, may indicate that your systems need more processing power. This may enable you to handle your workloads more efficiently. Conversely, if CPU usage is consistently low, you may have excess capacity and can reduce the number of resources used.
In addition to identifying trends in resource utilization, monitoring CPU performance can also help you understand the resource utilization of individual processes or applications. If you monitor CPU usage for individual processes, you can identify which processes are consuming the most resources, and make changes to these processes to improve performance and reduce resource utilization.
8. Airline Flight Metrics Dashboard
 Credit: OpenSearch
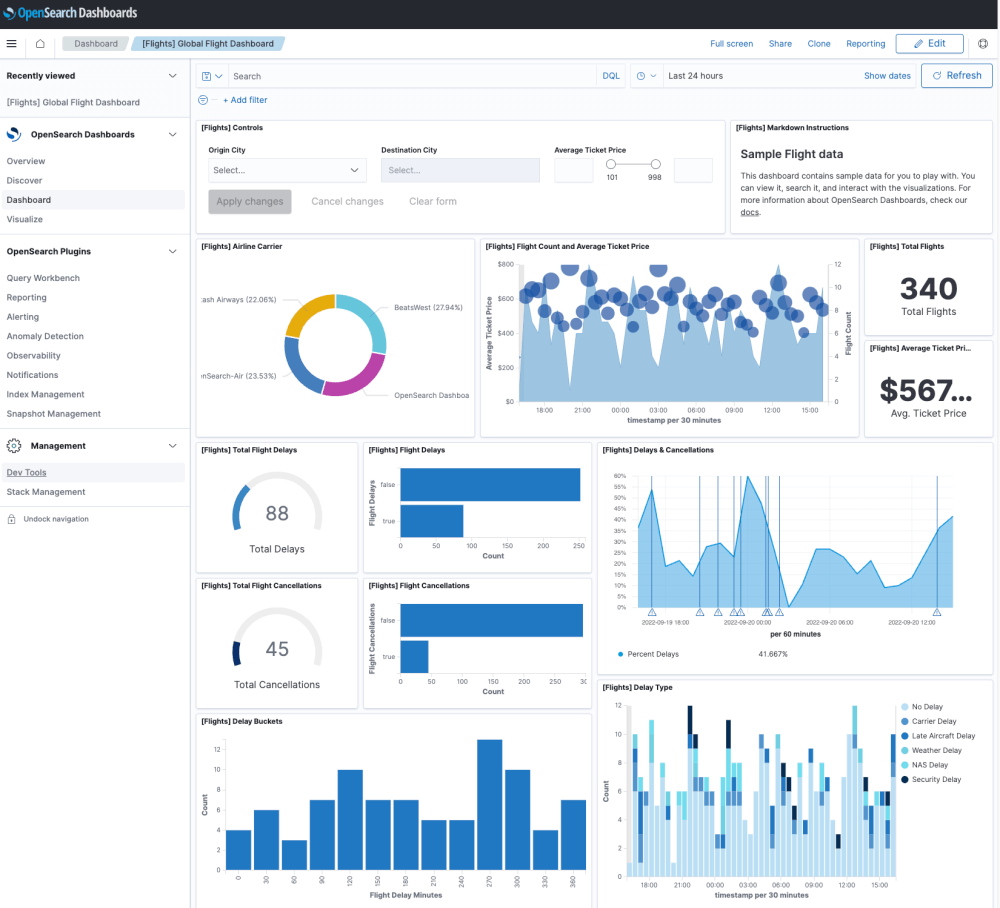
For flight performance monitoring, monitoring an airline's flight metrics dashboard is useful because it provides real-time information about the airline's flight operations.
Besides providing flight performance data, this airline flight metrics dashboards can also provide customer experience data. To identify areas for improvement and to ensure that they are providing a high level of service to their customers, airlines can monitor their on-time performance, baggage handling, and passenger satisfaction.
9. Customer Support Calls
 Credit: AWS
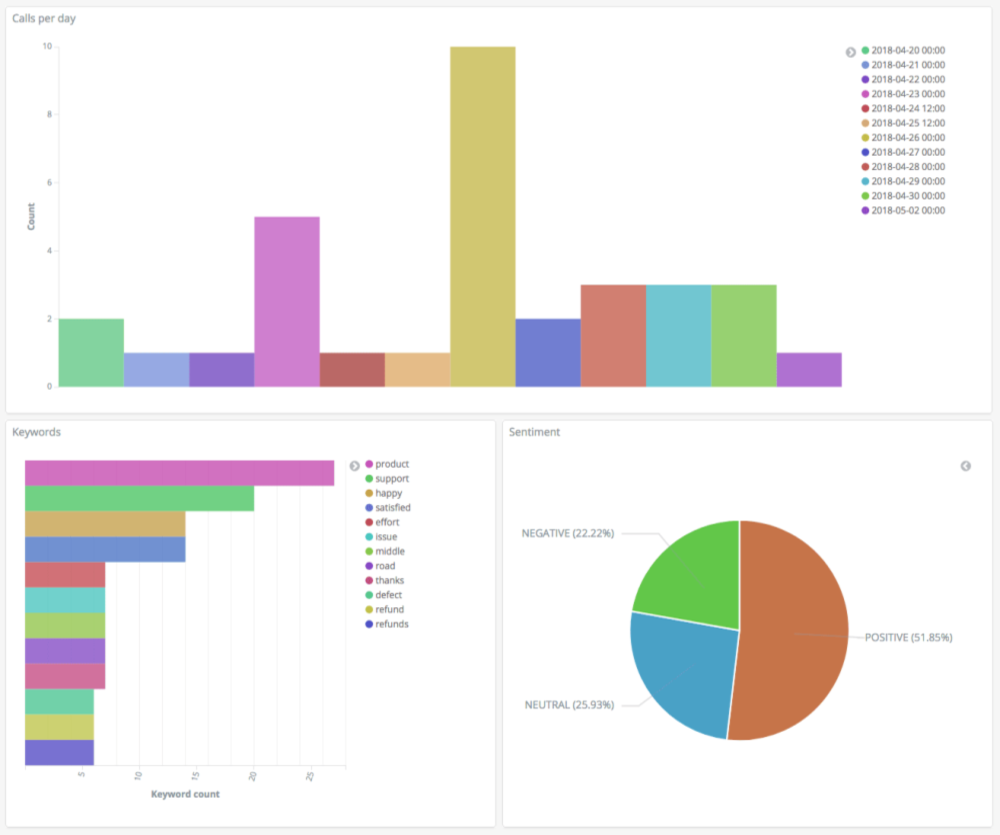
Analyzing customer support calls is vital for improving your organizations offerings. However, this can be challenging to derive insights from and particularly time-consuming as a it means processing an extensive amount of qualitative data. Therefore, utilizing this OpenSearch dashboard can streamline the process. The dashboard provides a hollistic view of your customer support call data enabling you to quickly begin examining the data and derviving insights. With this dashboard you can view metrics such as sentiment, keywords, and calls per day.
10. TuneInsights
 Credit: Sparab16
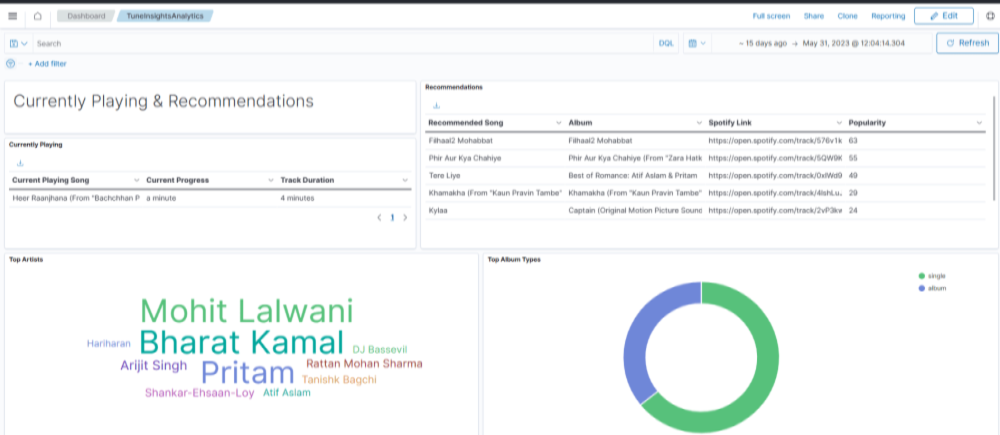
This OpenSearch dashboard data is pulled from TuneInsights. TuneInsights is a streaming data pipeline that uses Apache Kafka to collect and process data from Spotify API. The dashboard enables users to visualize their Spotify playback data to help them examine and comprehend trends, patterns, and user behavior on Spotify. This dashboard provides a range of metrics relating to your Spotify analytics such as top artists, currently playing, and recommendations.
11. Wikistream
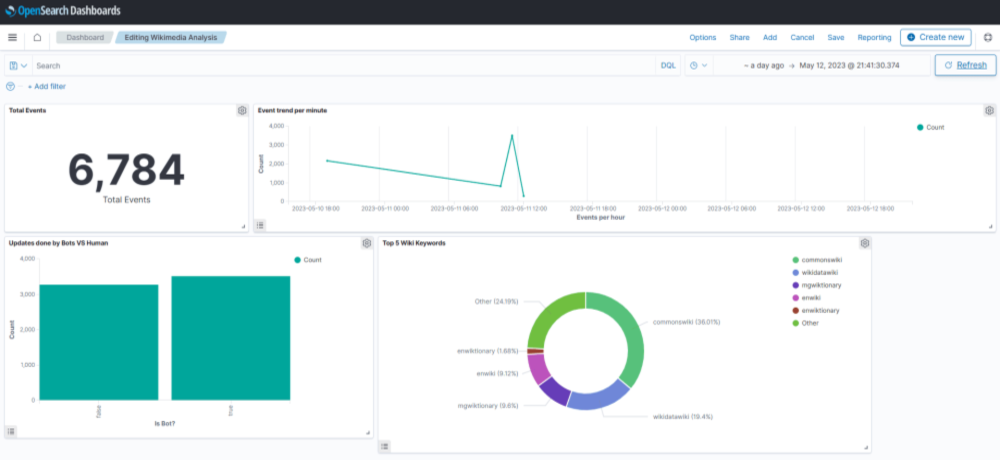 Credit: Sparab16
This dashboard is similar to the previous example, TuneInsights. It. utilizes Wikistream, a streaming data pipeline that uses Apache Kafka to collect and process data from Wikimedia. The dashboard aims to provide real-time insights and analytics on Wikimedia data using Opensearch Dashboards. With this dashboard you can view metrics relating to Wikimedia like total events, top 5 wiki keywords, and event trend per minute.
12. Dev.to Analytics
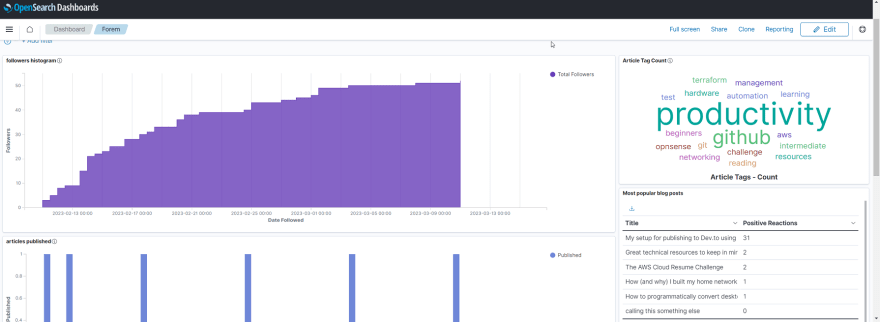 Credit: Jack Lewis
This OpenSearch dashboard example presents data collected from the website Dev.to. The dashboard can be used for a different website to provide you with data relating to your website visitors. Also, you can utilize the filters to set the date range to analyze historic data as well as real-time data. The dashboard allows you to monitor metrics such as followers, articles published, and article tag count.
13. Web Traffic
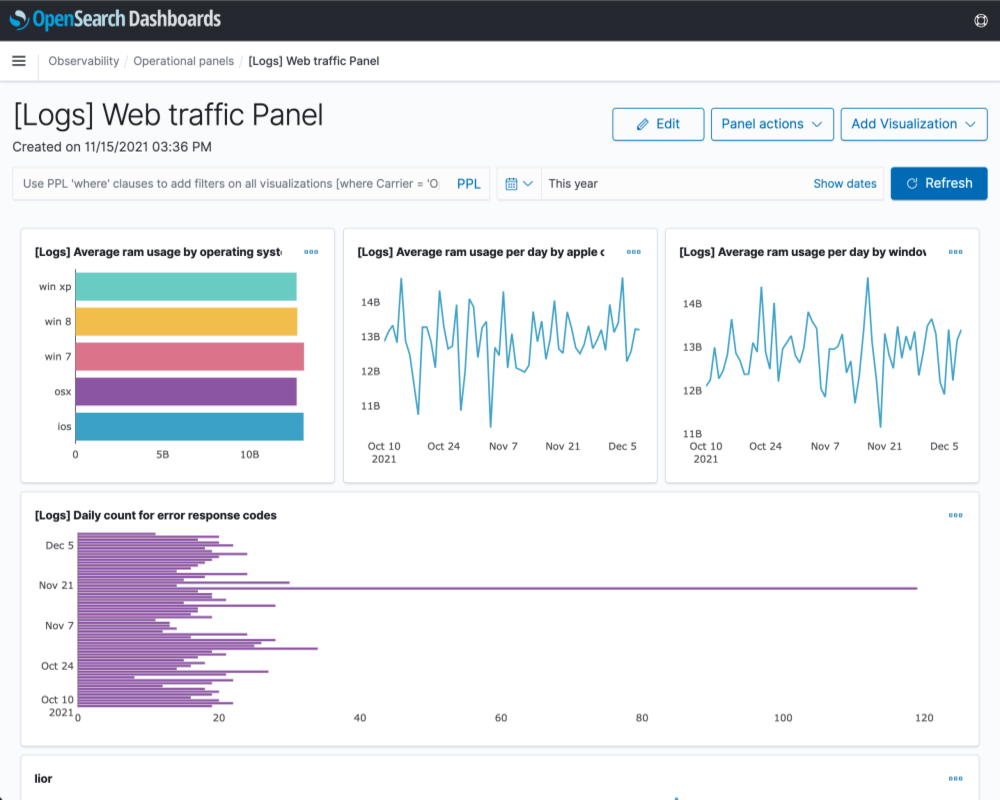 Credit: OpenSearch
By collecting specific log data and utilizing OpenSearch Event Analytics to turn data-driven events into visualizations you can create this OpenSearch dashboard to monitor your web traffic. The dashboard provides you with a comprehensive overview of your web traffic by monitoring numerous metrics including but not limited to average RAM usage by operating system, daily count for error response codes, and average ram usage per day by windows.
14. Auditbeat
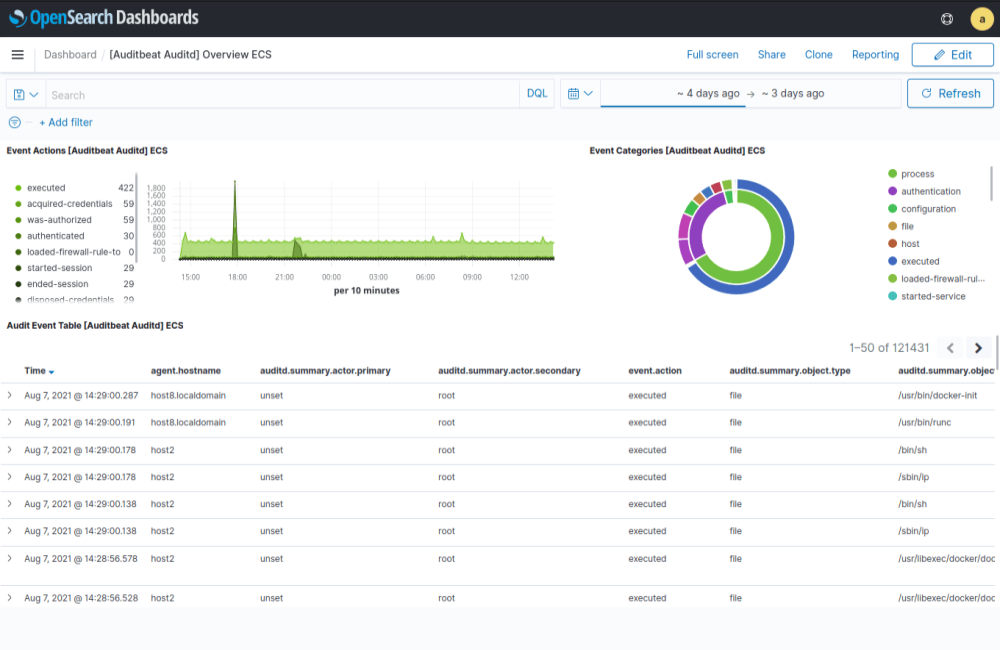 Credit: OVH Cloud
Auditbeat is a lightweight open-source data shipper that is part of the Elastic Stack (previously known as the ELK Stack), which also includes Elasticsearch, Logstash, and Kibana. Auditbeat enables you to monitor user activity and processes and examine your event data in the Elastic Stack without touching auditd. The tool is a useful for improving the security and monitoring capabilities of Linux systems by capturing and analyzing audit events.
With this OpenSearch dashboard example you can effectively monitor metrics relating to Auditbeat. Some of the metrics that you can monitor with this dashboard are event categories, audit events, and event actions.
Want to get started with creating your own OpenSearch dashboards? Then sign up today for our hosted OpenSearch service and start creating dashboards within minutes with our 14-day free trial, no credit card required.
If you enjoyed this post then why not check out our guide to OpenSearch vs Elasticsearch or our cheat sheet to Kubectl?