Resources
7 min read
Leveraging your company data is crucial to drive informed decision-making. To achieve this numerous organizations opt for business intelligence platforms, as they enable teams to quickly and easily access this data, and present it in an easy-to-digest format, such as dashboards. One of the most common choices for a business intelligence platform is Microsoft Power BI
Power BI is a powerful business intelligence and analytics tool, developed by Microsoft. The tool offers an organization the ability to quickly and easily visualize and analyze all organizational data for the easy extraction of actionable insights. Also, Power BI supports a huge number of data sources, like databases and cloud services, Excel spreadsheets, and many others that will help in binding such data sources into unified, interactive reports and dashboards.
Power BI has grown to be one of the most popular business intelligence tools due to the advantages that it offers, such as its user-friendly interface, machine learning, and collaboration and sharing capabilities. However, the tool isn’t the perfect solution for all organizations.
Firstly, While Power BI offers a free version with limited capabilities, the full-featured Power BI Pro and Premium licenses can be costly for smaller organizations or individual users. As well as this, while integration with Microsoft products like Azure and Office 365 is a strength, it also ties Power BI closely to the Microsoft ecosystem. This dependency may limit flexibility for organizations using non-Microsoft technologies or platforms.
These drawbacks have led to organizations searching for Power BI alternatives, but this process can be challenging and time-consuming. So, to support your research this article will outline the leading Power BI alternatives.
OpenSearch vs Power BI
While OpenSearch and Power BI primarily serve differing functions, there are key similarities in areas where OpenSearch excels as a Power BI alternative. The following are specific areas where hosted OpenSearch alone works well as an in place replacement for Power BI.
Real-Time Data Monitoring and Analytics
Organizations must process data in real-time in order to gain operational insights and make decisions quickly. This has been the foundation of OpenSearch in terms of ingesting real-time data and delivering real-time insights on dashboards. This makes the solution perfect for scenarios like monitoring server or application performance, IoT data, and any use cases where immediate feedback is needed.
Custom Dashboards for Specific Metrics
Building customized dashboards to monitor particular metrics and KPIs is crucial to practically all organizations. With OpenSearch Dashboards users attain a facility for implementing custom and interactive dashboards. In contrast to Power BI, which has much more sophisticated visualization options available, OpenSearch may be used for the dashboarding of metrics tracking related to sales performance, operational efficiency, and user engagement.
Search-Driven Data Exploration
Organizations often require quick and efficient search capabilities to discover and analyze vast amounts of unstructured or semi-structured data. One of the outstanding capabilities of OpenSearch is its search functionality which can be used for exploring enormous datasets. This becomes relevant in several scenarios, from customer feedback analysis to document search or the exploration of unstructured data.
Advantages of OpenSearch over Power BI
- Real-time Capabilities: OpenSearch is designed for real-time data ingestion and analysis; hence, it is more applicable in scenarios where views are formed on the spot.
- Scalability: A standout feature of OpenSearch is that it can easily support huge volumes of data, mostly log and event data.
- Search Functionality: The solution has powerful search functionality, making OpenSearch particularly useful when working with large datasets.
- Customization: OpenSearch provides extensive possibilities for customizing dashboards and visualizations.
Power BI Alternatives
Hosted OpenSearch from Logit.io
Whilst a drawback of OpenSearch is it’s not as easy to launch when compared to Power BI, the usability of OpenSearch can be enhanced by opting for a hosted solution, such as Hosted OpenSearch from Logit.io. With Hosted OpenSearch you can easily gain from using the best features of the tool without the time-consuming and challenging task of configuration and maintenance as this is all handled by Logit.io. If you’re interested in finding out more about Hosted OpenSearch, feel free to contact us or begin exploring the platform for yourself with a 14-day free trial.
Request a Demo
Want to learn more about Logit.io's powerful observability platform? Book a demo and we'll walk you through the extensive capabilities and discuss your requirements in detail.
Datawrapper
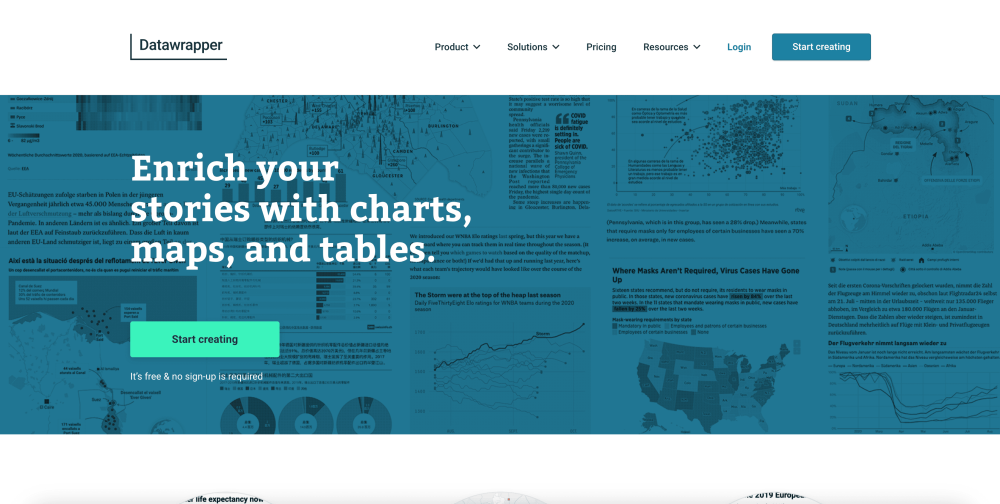
The first tool included in our list of Power BI alternatives is Datawrapper. Datawrapper offers users the ability to create charts, maps, and tables with no code or design skills being required. With this tool, whichever plan you opt for, you will have access to unlimited visualizations, the ability to export every visualization as PNG, SVG, or PDF, and continue working with tools like Adobe Illustrator, as well as design responsive readable visualizations for all devices.
MicroStrategy

The next Zabbix alternative is MicroStrategy, a powerful platform that utilizes AI to enable you to quickly create dashboards and visualizations. With MicroStrategy, users have access to their own AI assistant directly embedded within apps. By using natural language, they can ask questions about the dashboard or underlying data without the need to navigate complex interfaces or menus manually. As well as this, the auto dashboard feature is designed with intent, based on the questions you ask and the available datasets.
Tableau
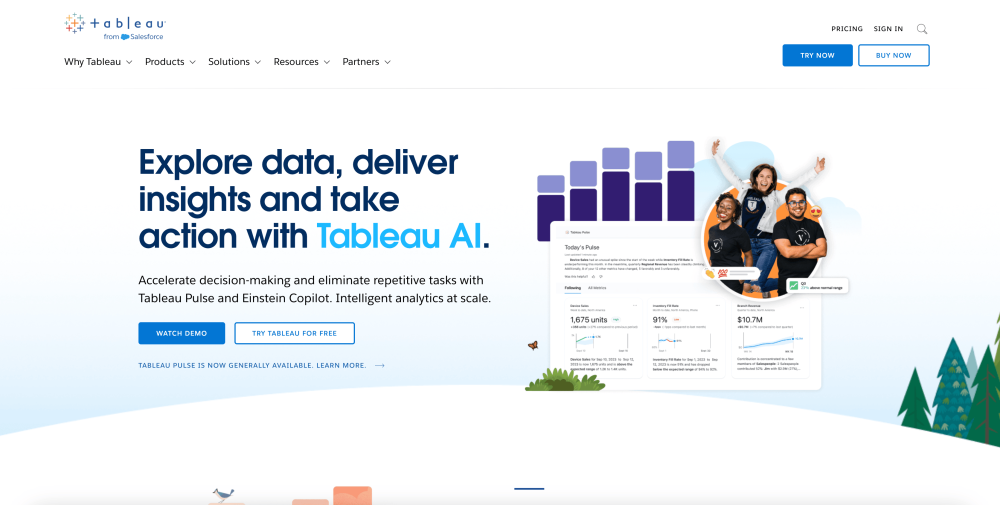
Tableau is a popular Business Intelligence and data visualization platform that serves as a Power BI alternative. The interface has intuitive and interactive dashboards with drag-and-drop options, which allow end-users to easily perform their tasks of analysis and visualization across diverse sources of information. Its major features include real-time data analytics, efficient data blending, and seamless integration across multiple databases and cloud services.
SAP BusinessObjects Business Intelligence
SAP BusinessObjects Business Intelligence is a comprehensive suite designed for data reporting, visualization, and sharing. Serving as the on-premise BI layer of SAP’s Business Technology Platform, it transforms data into actionable insights accessible anytime, anywhere. With this solution, users can create impactful visualizations, dashboards, and applications to evaluate risk, enhance efficiency, and uncover opportunities.
GoodData
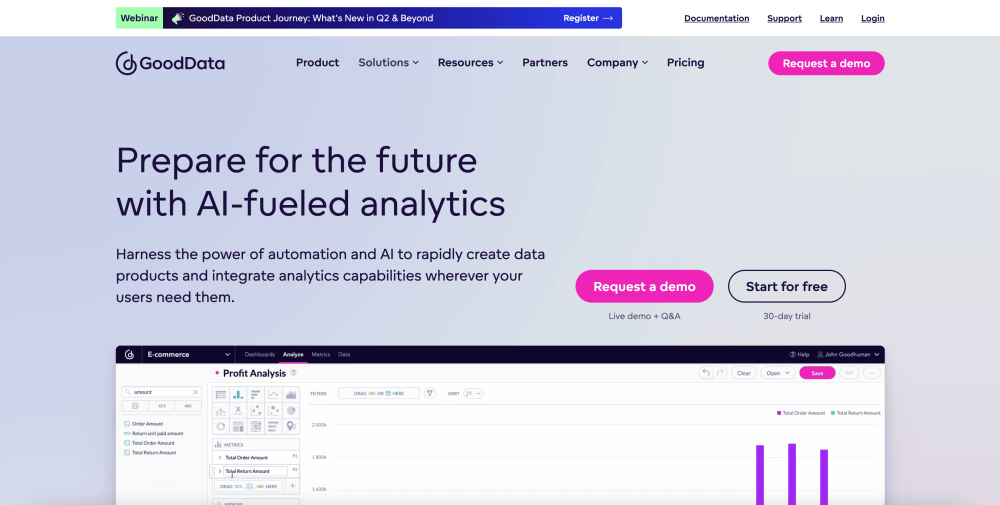
Continuing with our list of the leading Power BI alternatives the next tool is GoodData, an AI-powered analytics platform. The new analytics engine behind GoodData is FlexQuery, which enables analytics and business intelligence engineers to integrate, transform, and enhance data for use in dashboards, custom applications, and AI/ML projects. With this solution, you can embed interactive charts and dashboards into your apps, web portals, and workflows so they can be utilized anywhere.
Metabase
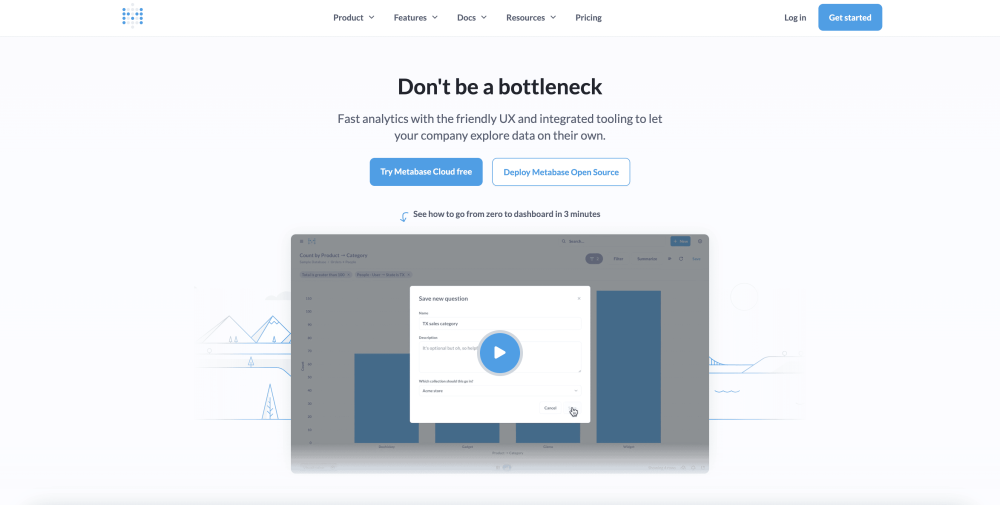
Another Power BI alternative is Metabase, an open source, fast, and simple-to-use analytics platform. With this solution, you simply connect to your data stack and present your data in a familiar interface using spreadsheet-like controls, such as sorting and filtering. Also, if your team requires advanced analytics Metabase includes a full SQL editor enabling you to dive deeper into your data. Lastly, you can easily share your dashboards with links or embed them directly wherever you need them.
Sisense
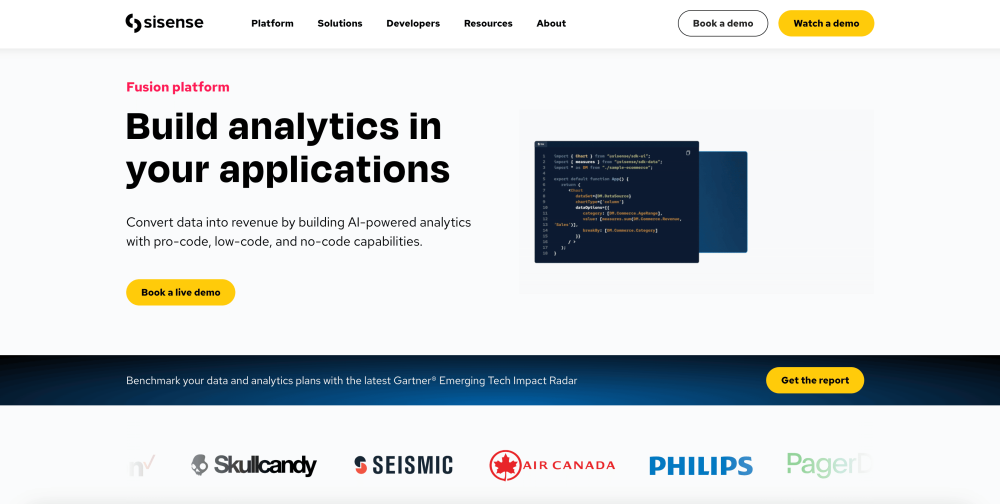
Sisense is a robust business intelligence and analytics platform, that comes with high-powered data integration tools that not only connect but also bring together seamless data from a number of sources. Its in-chip technology provides faster processing, customizable dashboards, and advanced analytics with AI-driven insights. Sisense's user-friendly interface and ability to handle large datasets have made the solution a popular choice.
Apache Superset
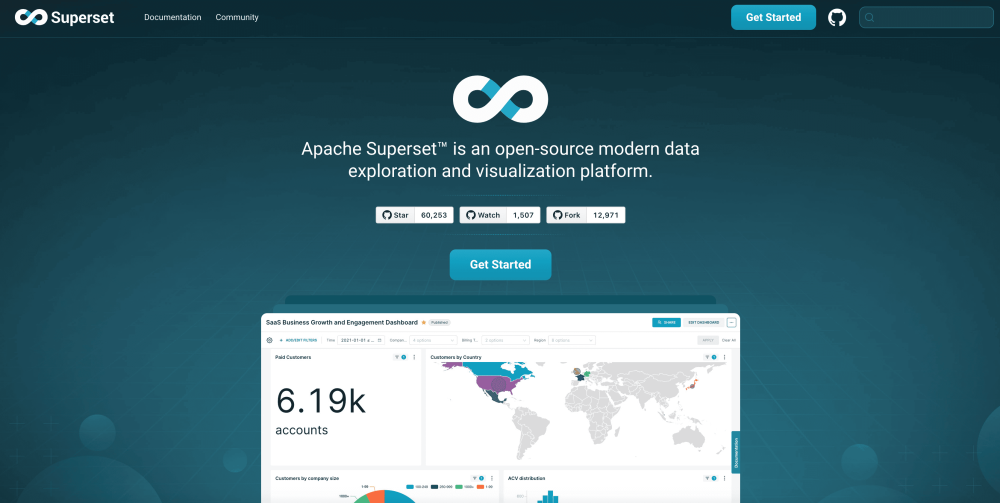
Apache Superset is a fast, lightweight, and intuitive open source data exploration and visualization platform. With this solution it’s simple to explore your data, using either the simple no-code viz builder or state-of-the-art SQL IDE. Also, it's lightweight and highly scalable, leveraging the power of your existing data infrastructure without requiring yet another ingestion layer. Lastly, Apache Superset comes with 40+ pre-installed visualization types.
DoubleCloud
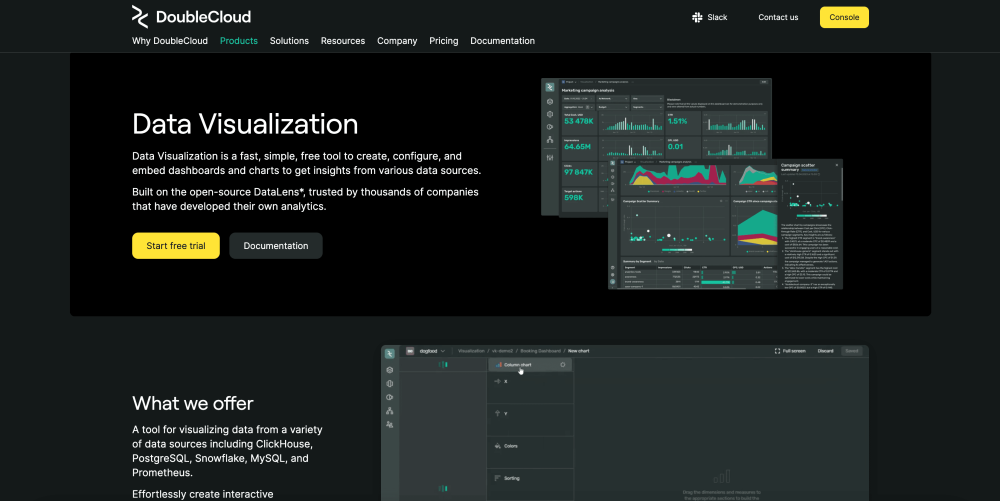
DoubleCloud offers a free data visualization tool built on the open-source DataLens, which enables users to view and analyze data from various data sources such as ClickHouse, PostgreSQL, Snowflake, MySQL, and Prometheus. This solution offers the ability to integrate or embed charts directly into your customer-facing or partner-facing application. As well as this, DoubleCloud data visualization is integrated with ChatGPT-4 to offer ready-made conclusions from your charts in one click.
Streamlit
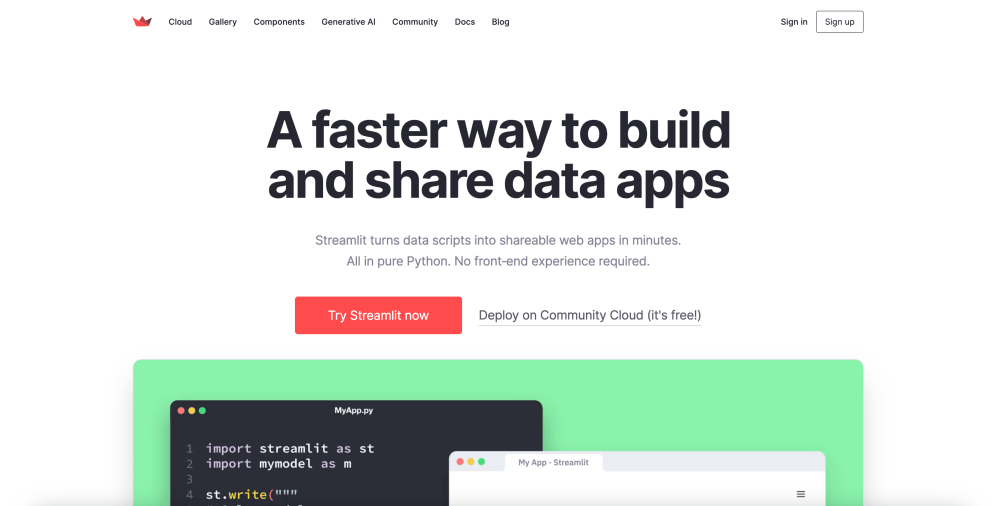
Streamlit serves as an open source tool that supports the building of apps faster by turning data scripts into shareable web apps in pure Python. This solution is valuable as a Power BI alternative as it can be utilized for data visualization capabilities, you can utilize the source code for specific visualizations created by the Streamlit community to use them for your own needs. The solution also works with everything in the AI ecosystem.
Loopple
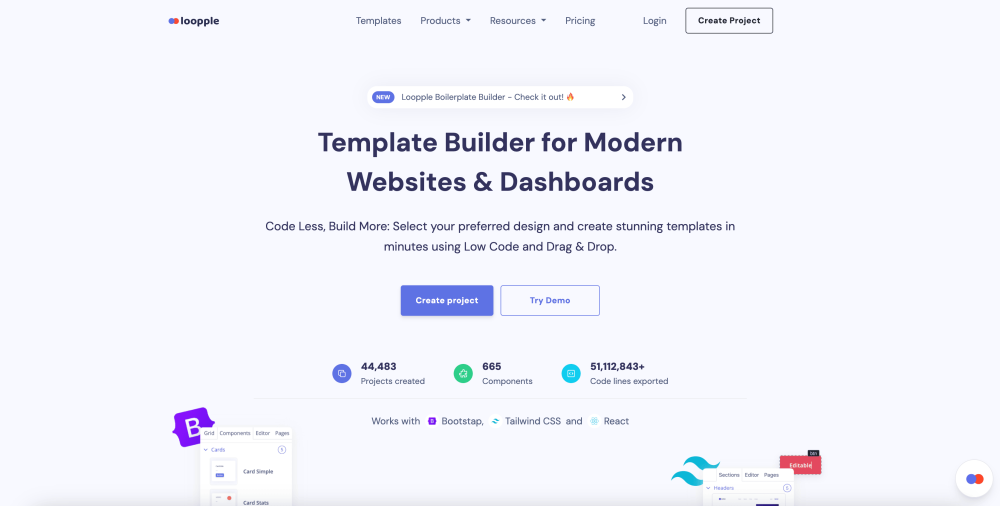
The next alternative included in our list is Loopple, a data visualization tool with minimal code and a drag-and-drop design. With this solution users can create website and dashboard templates using popular frameworks such as Bootstrap, Tailwind CSS, and Chakra UI, allowing for greater flexibility and customization. Also, Loople provides over 650 meticulously designed components and sections, offering users the tools to create powerful dashboards.
Looker Studio

The last Power BI alternative included in our list is Looker Studio. Looker Studio is a powerful data analytics and visualization platform. The solution is entirely browser-based, so there is no installation or setup, and the user interface is straightforward allowing you to begin creating interactive dashboards almost immediately. Also, Looker Studio offers advanced analytics capabilities, including predictive modeling and machine learning integrations with flexible deployment options.
If you've enjoyed this article why not read The Top 30 Business Intellignce (BI) Tools or The Best ELK Dashboard Examples next?
