
Resources
5 min read
Last updated:
As a software engineer running applications in production, it is essential to monitor this environment to maintain the health of your applications. Production monitoring software and systems are used to improve observability so that you can better understand your operating environment and visualise performance issues easily.
In the manufacturing industry, production monitoring is defined as software that involves making a record of the performance of a manufacturing production line within an industrial facility.
For this article, when we refer to production monitoring we are referring to the concept of monitoring production environments. A production environment is the live version of a release of software which is actively being used by real users.
Whilst open-source tools such as Grafana and Prometheus can be used together for production monitoring, these two freely available solutions can quickly become difficult to scale for larger organisations handling a lot of data across multiple disparate regions.
In this guide, we’ll cover the best proprietary and open-source production monitoring tools and software you can start using to improve your ability to troubleshoot applications and improve both application performance and end-user experience.
Datadog
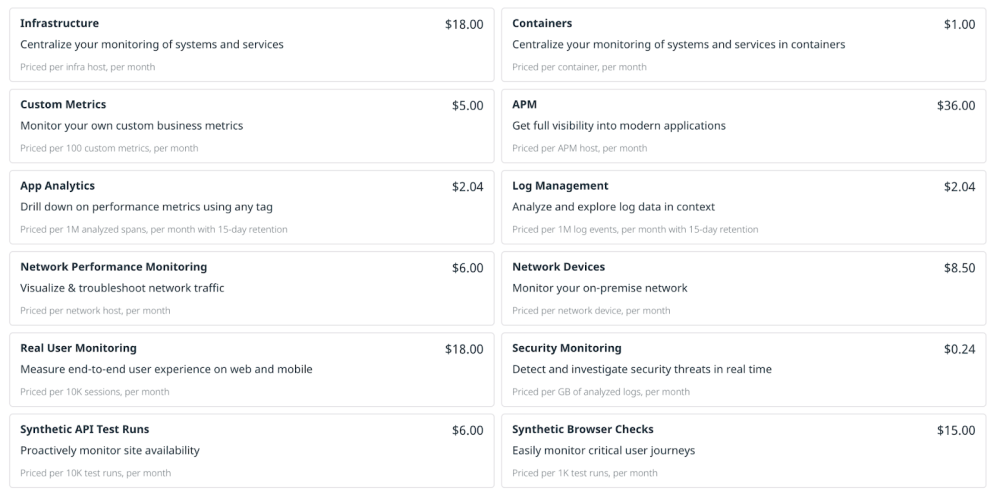 Datadog's monitoring solution allows users to monitor production logs and gather insights from metrics, traces and applications. By using Datadog to profile your production code you can tell whether or not your application is consuming too much CPU or memory.
Features include:
- Triage issues using error tracking
- Monitoring of uptime SLAs
- Parse on ingestion of logs
- Threat detection
- Serverless
- Alerting
Splunk
 The Splunk platform is readily suited to monitoring across production, test and development environments as well as the monitoring of microservices in production.
As staging environments vary greatly from production, API testing is fundamental to make sure that errors don't end up affecting the end-user. By using Splunk for both API and production monitoring you can work to ensure that you can deliver users the best experience of your site or platform.
Features include:
- Customised dashboards and data visualisations
- Machine learning analytics
- Application delivery
- GDPR compliant
Logit.io
Logit.io’s production monitoring solution combines the best elements of hosted Prometheus and Grafana into a single observability platform so that you can debug in production and see how efficiently resources are being utilised across any application. Monitor any service in production that creates telemetry data, even Python in production as well as containerised applications (including Docker).
Collect metrics, logs, events and traces from your applications and visualise these fully within Logit.io. Once you use one of our simple data forwarders you can use your metrics to build out reports and dashboards whilst also being able to create monitors and alerts all within a single platform.
Features include:
- Hosted Prometheus and Grafana
- Complete production monitoring
- Readily scale your monitoring
- Hundreds of integrations
- Compliance & auditing
- Scheduled reports
Logz.io
If a unified platform is one of your requirements for selecting an observability solution then Logz.io may be a good fit for your monitoring needs as their service helps users to detect and solve issues in production
Key functions necessary to maintain the stability of cloud operations include the ability to sustain, build and monitor in production as well as being able to take the steps necessary to fix issues affecting production environments. As well as production monitoring, this platform is also able to handle log management, SIEM and metrics management.
Features include:
- Trace and log correlation
- Automatic parsing
- Log visualisation
- Extensive API
- Audit trail
Mezmo
 Mezmo (formerly known as LogDNA) gives users the ability to troubleshoot in production and it is fully compatible with ingesting data from a variety of sources including data from programming languages, platforms and operating systems.
If you are looking to improve both your Mean Time To Detection (MTTD) and Mean Time To Recovery (MTTR) then being able to highlight production incidents using Mezmo’s intuitive search capacities will save your engineers many hours of manual parsing.
Features include:
- Unlimited data sources
- Debug in production
- Long-term retention
- Automatic parsing
- Data streaming
Graylog
 Graylog enables its users to run the open-source edition of this software for monitoring production environments so that engineers can improve their ongoing visibility of errors. Notifications for this service can be triggered upon specific events occurring (such as performance counter hits or HTTP response error codes).
As part of their enterprise solution, Graylog offers users the opportunity to archive their logged data within the platform. By allowing users to optimise their data storage methods, they can work to ensure that production systems run more efficiently by using fewer unnecessary resources.
Features include:
- Intuitive event correlation
- Lightning-fast search
- Content packs
Blackfire
 The production monitoring solution offered by Blackfire is configured so that IT and operations leads can easily identify and understand what is causing performance bottlenecks within their infrastructure.
This APM tool provides streaming of live metrics from your production applications in real-time. This allows you to readily view slow transactions and see all running background jobs alongside any third-party calls.
Features include:
- Distributing profiling
- Unlimited users
- Periodic builds
Dataset
 Users that require large-scale production monitoring may find Dataset's platform (formally known as Scalyr) to offer the scalability they require for the effective processing of many terabytes of data.
Without a robust practice of monitoring, you limit your ability to test in production and instead work off the basis that you hope your latest release simply works. By using a tool such as Dataset, you can configure the alerts that you want to be triggered in the event that errors do end up occurring.
Features include:
- NoSQL columnar database
- Enterprise level security
- Unlimited dashboards
- No limit on containers
- Metrics analysis
Evidently AI
 For monitoring machine learning in production, Evidently AI provides an open-source solution to evaluate ML (machine learning) model quality and aggregate performance statistics so that if a failure occurs, it is easier to pinpoint what exactly went wrong.
The Evidently AI platform has also recently launched a number of platform improvements including a new library of testing documentation, the ability to add custom text comments and use colour schemes.
Features include:
- Monitor machine learning models
- Data health snapshots
- Data drifting
Sumo Logic
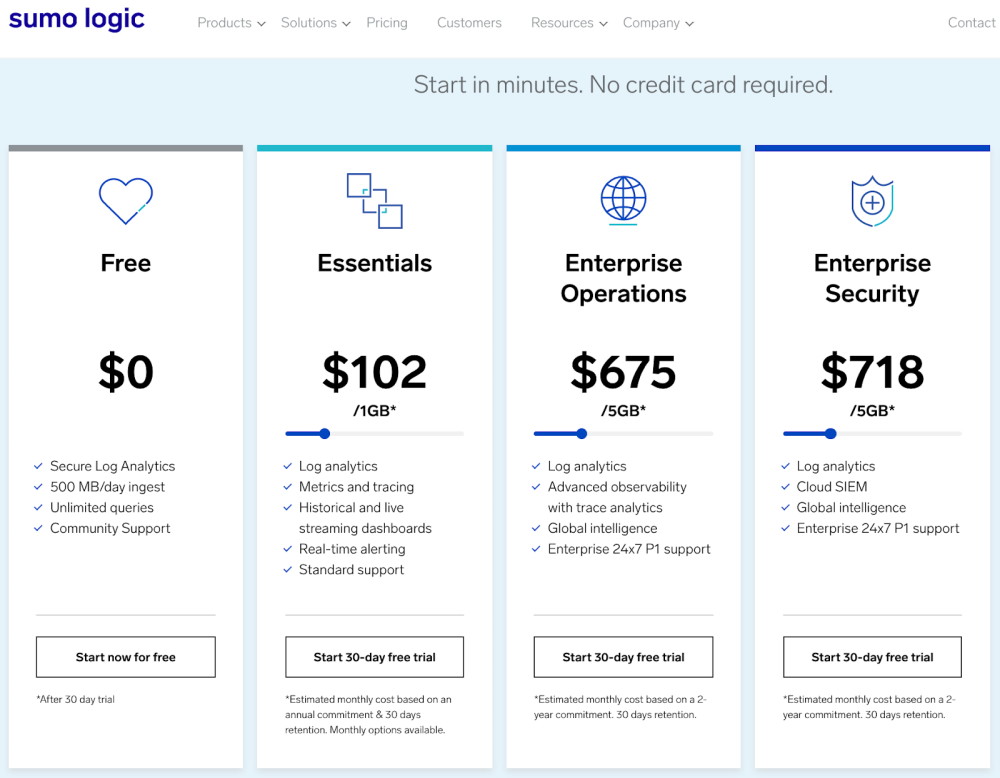 Sumo Logic’s production monitoring features allow users to gain visibility and experience the benefits of being proactively notified about critical production issues. As the platform offers pre-configured alerts, it is easier and faster to use their robust alerting templates rather than writing these from scratch yourself.
By using monitors across all of your hosts you can make sure that you are the first to know about any errors that could adversely affect your production environment. Configuring a Sumo Logic dashboard for this use case should include key metrics such as CPU, memory, network and TCP connections spanning all of your hosts. This will allow you to identify system abnormalities occurring over time.
Features include:
- Detect high-speed direct threats
- Automated data tagging
- Unlimited querying
- Unlimited queries
- Tracing
If you enjoyed this comparison guide then why not check out our previous comparison guide to the best Splunk alternatives?