Resources
5 min read
Last updated:
Prometheus is one of the leading open-source monitoring frameworks around today. It is well known for its operational simplicity, and for being highly available by default. It is the second project hosted by the Cloud Native Computing Foundation (CNFC) and was accepted into the programme on May 9, 2016.
Prometheus is completely based on time series data collection and uses both a dimensional data model and flexible query language (PromQL). Prometheus is built to work in dynamic environments (such as K8s clusters) and also has integrated alerting as one of its core features.
As Prometheus stores time-series metrics locally it is well worth understanding that if you wish to retain in excess of over a million samples for long term retention (as may be required by many regulatory bodies) then you may quickly run into issues scaling Prometheus reliably.
As the original founders of Prometheus have often stated themselves, long term storage and scalability are not the core focuses of Prometheus so other solutions and workarounds should be considered as part of using this monitoring stack long term.
In this guide, we are looking at some of the leading managed Prometheus tools that can be configured to launch within minutes to give you a hosted and scalable solution for complete time series metrics management.
Contents
1. Grafana Cloud
 This time series metric monitoring solution provided by Grafana Cloud allows for users to get started with a free account that can track up to 10,000 time-series metrics with 14 days retention but does cap team size limit to just three members.
Grafana Cloud can easily be used as a tool to provide a centralised view for querying numerous instances of Prometheus to offer global visibility on the status of your time-series metrics.
Key Features:
- Graphite datastore
- Usage-based billing
- Query metrics centrally
- Thirteen months metrics retention
2. AWS
 The Prometheus monitoring solution offered by AWS is highly suited for monitoring cloud-native applications and also supports the use of Prometheus's native language, PromQL.
This managed time-series metrics monitoring solution also gives teams the ability to integrate operations alongside Amazon Elastic Kubernetes Service (Amazon EKS) and Amazon Elastic Container Service (Amazon ECS).
Key Features:
- Automatically scaling
- AWS backed security
- Gain performance visibility
- Integrated with Amazon Elastic Kubernetes Service
3. Google Cloud
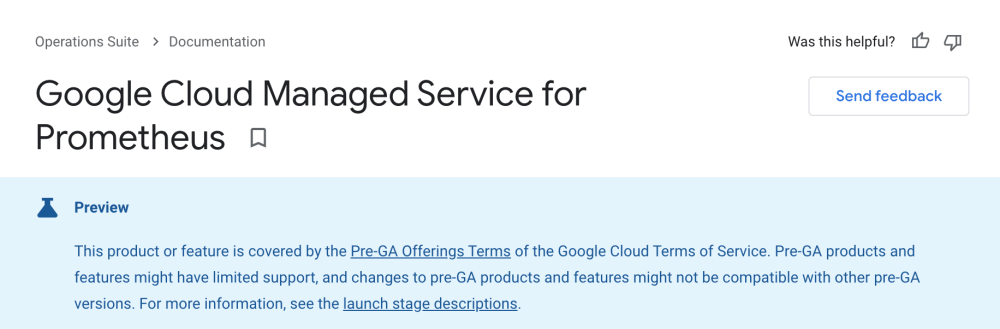 Google Cloud’s Prometheus monitoring tool looks set to provide a wealth of value for existing Google Cloud Platform customers by eliminating the need to use services such as Thanos (a popular stand in which provides long term storage capabilities for Prometheus).
It is important to note that this service has not yet reached general availability so may be difficult for new users to get started with.
Key Features:
- Alert on workloads
- Prometheus query API support
- Managed collectors for Kubernetes
4. Logz.io
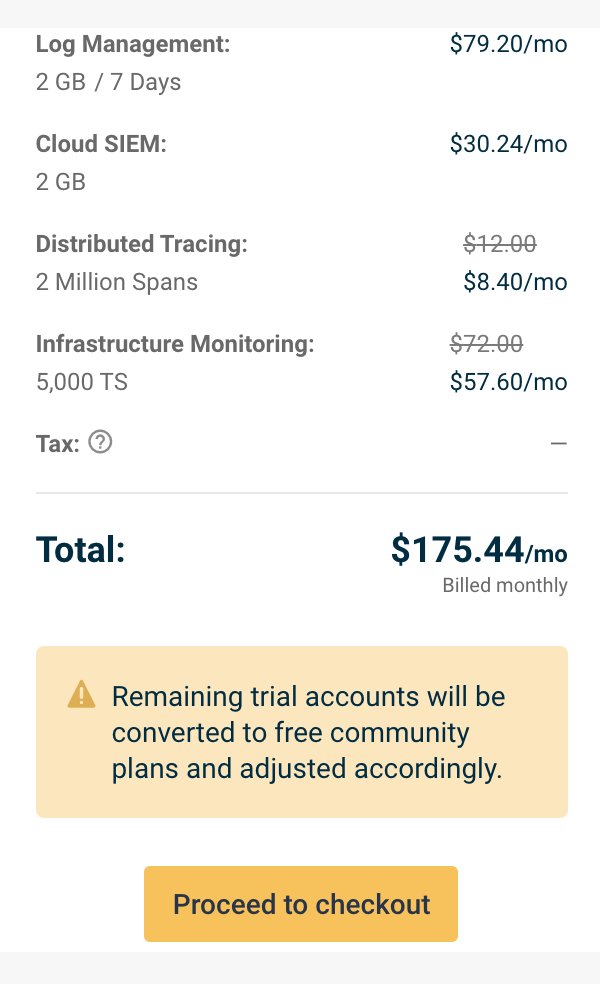 Logz.io is a logging solution that enables its users to monitor metrics as part of their infrastructure monitoring solution. Unlike some of the other tools cited in this article, Logz.io is a relative newcomer in the hosted Prometheus space as they’ve only recently announced full support for PromQL in January of this year.
Key Features:
- Audit trail
- Drop filters
- Collect metrics
- Log and metrics correlation
- Volume analysis & reporting
5. Logit.io
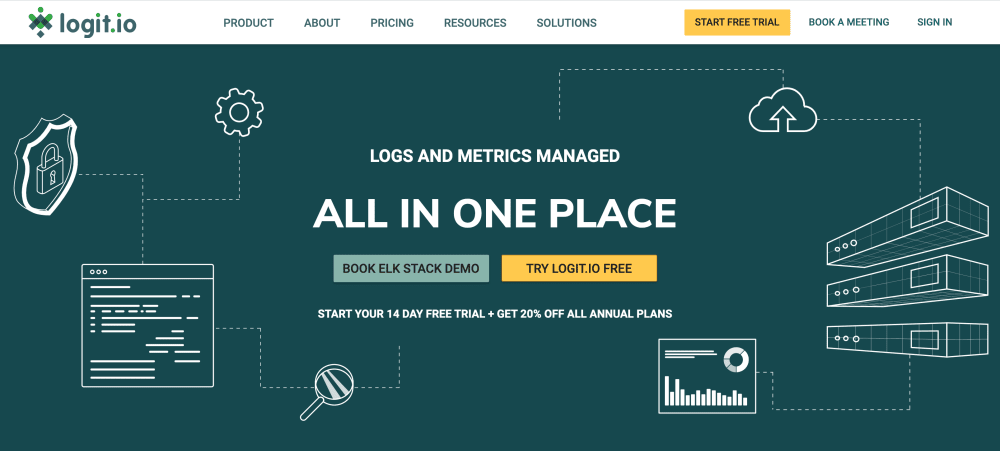 The Logit.io managed service for Prometheus is designed to remove operational toll
so that you can scale your Prometheus based monitoring and finally perform global querying as well as storing metrics for long term retention.
The Logit.io managed service for Prometheus is designed to remove operational toll
so that you can scale your Prometheus based monitoring and finally perform global querying as well as storing metrics for long term retention.
Our platform enables users to collect metrics at an incredible scale with zero operational overhead, this puts global monitoring and alerting within reach for enterprise-level organisations.
The Logit.io Prometheus as a Service solution starts from just $15 a month for 5,000 ingested metrics and is an in-place replacement for running your own Prometheus servers which means you can keep using your existing Prometheus alerts and your existing Grafana dashboards by migrating them to our platform. We also fully support the ingestion of data from any application that uses PromQL to query metrics.
Logit.io is also rated 5/5 stars on Capterra, Software Advice and Gartner.
Key Features:
- Cloud monitoring
- Open cloud metrics including Prometheus, Open Telemetry, APM and Grafana
- Real-time alerting
- Metrics as a service
- Infrastructure monitoring
- Fully managed upgrade paths
- Enterprise uptime SLAs available to 99.999%
- Automatic scaling and High Availability
- Highly available data centres in EU, UK and US regions
6. Hosted Metrics
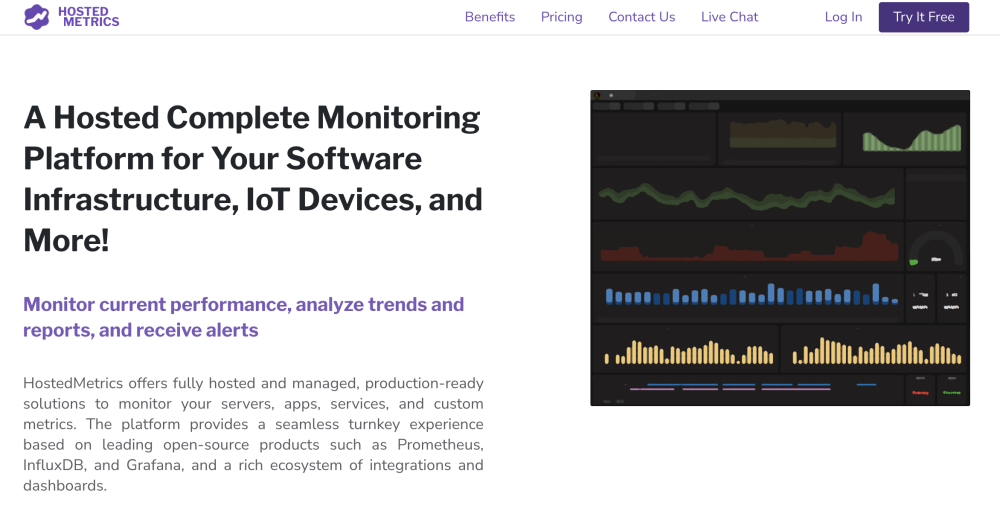 The hosted Prometheus service offered by Hosted Metrics enables users to analyse trends by providing a seamless turnkey experience that supports Prometheus in addition to InfluxDB and Grafana. This hosted Prometheus platform also enables customers to use tags and key-value pairs as part of their Prometheus setup.
Key Features:
- IoT monitoring
- White-labelling
- Access auditing
- Four team member limit
7. MetricFire
 MetricFire’s monitoring system makes Prometheus scaling simple by providing their users with long term data retention and three-fold redundancy. The MetricFire managed service provides an alternative to open-source Prometheus that is fully suited for scraping metrics and also has the benefit of being backed by engineer led support.
Key Features:
- Unlimited alerts
- Hosted monitoring
- Seamless upgrades
- First-line technical support
8. Sysdig
 Sysdig Monitor gives users a suitable solution in order to provide further visibility of Kubernetes and create a high-level view of containerised operations. In recent months, Sysdig has announced plans to bring on board a number of Cloud Native data sources along with the addition of preconfigured dashboards and monitor creation.
Key Features:
- Create custom alerts
- Collect custom metrics
- Infrastructure monitoring
- Curated Prometheus exporters
9. Chronosphere
 The Chronosphere platform offers hosted Prometheus to users that want to build a unified and global view of their infrastructure. Their platform has been tailored to provide engineers with an alternative to the increased overheads caused by running too many instances of Prometheus at once.
Chronosphere has also recently launched a new query builder for users to chart Prometheus data within PromQL in order to aid with PromQL's high barrier to entry.
Key Features:
- Embedded Grafana
- Centralised platform
- One-click deployment
- Cloud-native monitoring
- Support for Prometheus labels
10. Byblos
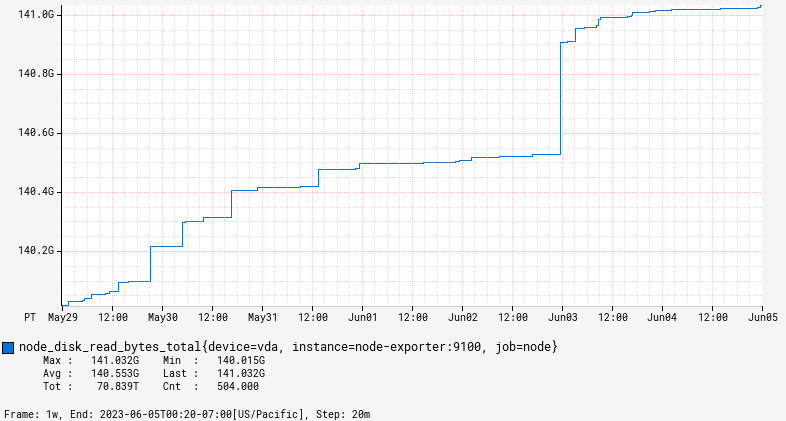 Byblos sets itself apart from other open-source dashboarding tools by generating static PNG images instead of dynamic graphs based upon Prometheus queries. This unique feature allows the PNG graphs to be seamlessly embedded in various platforms that accept images, such as emails and websites. Additionally, these PNG graphs can be effortlessly downloaded and shared with others, offering a convenient and versatile way to distribute data visuals.
11. ChatGPT Powered Bot For Prometheus

This helpful alert translating bot, powered by Robusta.dev, interacts with OpenAI through queries, seeking guidance on resolving the alerts. Prometheus utilizes a webhook receiver to forward alerts to the bot. The bot's implementation then leverages Robusta.dev, an open source platform dedicated to handling Kubernetes alerts to provide users with more clarity.
If you enjoyed this article then why not take a look at our Promql cheat sheet or our post on the best Splunk alternatives.