
Resources
5 min read
Utilizing real-user metrics from your applications frontend can provide a significant advantage to your company. Real user metrics offer insights into how users interact with your product or service. By monitoring metrics like page load times, response times, and overall performance, you can highlight areas where users could be experiencing frustration or encountering problems. This information can then be utilized to make targeted improvements to enhance the user experience.
To streamline the process of monitoring real user metrics, real user monitoring tools are available. These tools intend to bridge the gap between application performance metrics and the impact on real users. With real user monitoring tools, you can utilize accurate performance data to gain insights into user behavior, identify performance issues, and prioritize performance optimization. To assist you in selecting the most appropriate tool for your organization we have compiled a list of the leading real-user monitoring tools which also includes a number of open source solutions.
Contents
What is Real User Monitoring?
Real User Monitoring (RUM) is a process used to collect and examine data about how actual users interact with a website, web application, or digital service in real time. Unlike synthetic testing, which simulates user interactions, RUM collects data directly from users' browsers or devices as they navigate and use the digital platform.
Request Metrics
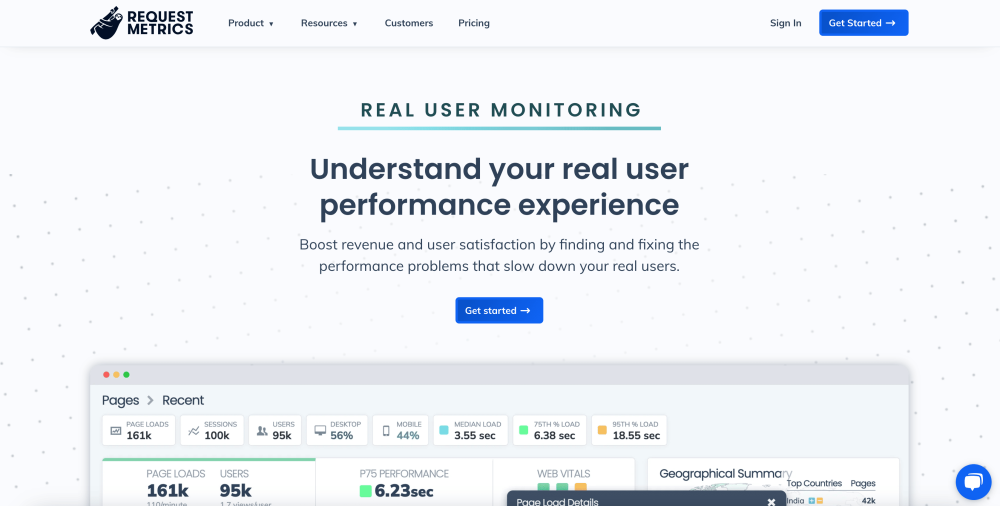
Request Metric’s real user monitoring solution focuses on website monitoring and intends to be a fast and easy-to-use tool for monitoring real user metrics. The tool solely focuses on understanding the performance as experienced by real users rather than attempting to comprehend every aspect of every part of a system. Request Metrics’ solution is intended for the small but busy software teams that don’t have the option to spend all their time and budget on software suites.
Key Features:
- Simple design and user-friendly, no data science training required.
- Can be utilized through a Chrome extension.
- Clickable report details.
- Effective search and filtering capabilities.
BasicRUM
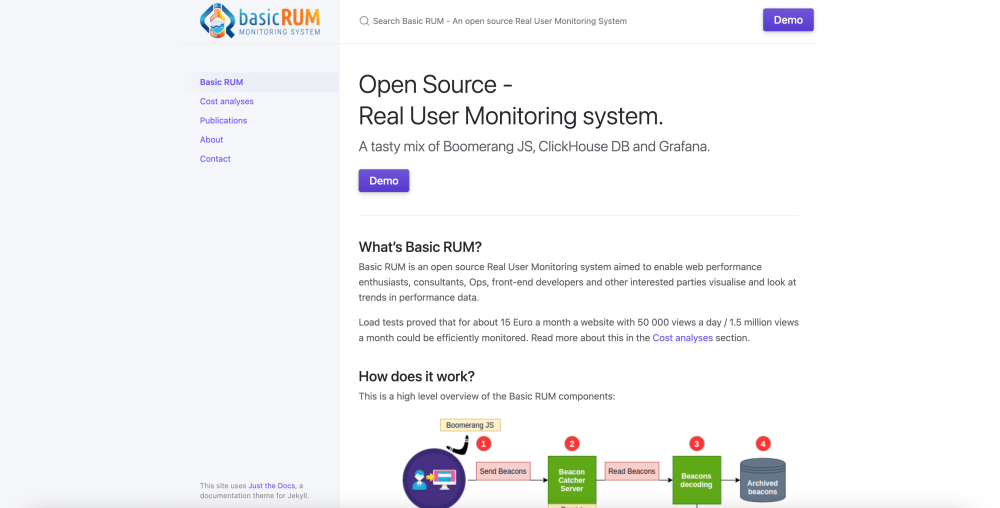
BasicRUM is a simple open-source real-user monitoring tool. The solution enables users to view numerous performance metrics relating to their website and visualize these metrics with powerful Grafana dashboards for effective analysis. Data is collected by Boomerang JS and then stored with ClickHouse DB before being sent to Grafana to visualize.
Key Features:
- Powerful Grafana dashboards.
- Open-source.
- ClickHouse DB for performance data storage.
- Data collection with Boomerang JS.
Logit.io
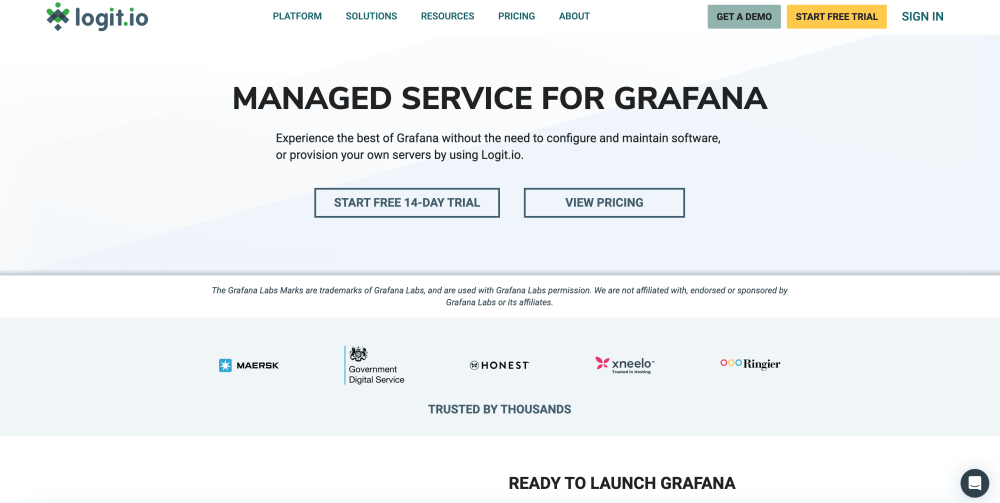
For real user monitoring, your objective may be to leverage frontend browser testing for production, observability and monitoring. Here, you could utilize nightwatchjs_exporter to collect the results of Nightwatch.js tests and visualiz them for effective real user monitoring in Logit.io's Hosted Prometheus solution.
Logit.io offers a comprehensive Hosted Prometheus solution which enables you to pull data from numerous databases to visualize it for effective analysis and experience the best of Prometheus without the need to configure and maintain software.
Key Features:
- Gain the best features of Grafana without configuration and maintenance.
- Integrate with key cloud platforms such as AWS and GCP.
- Rapid deployment.
- Launch managed Grafana side by side with Kibana as a Service.
ITRS Uptrends
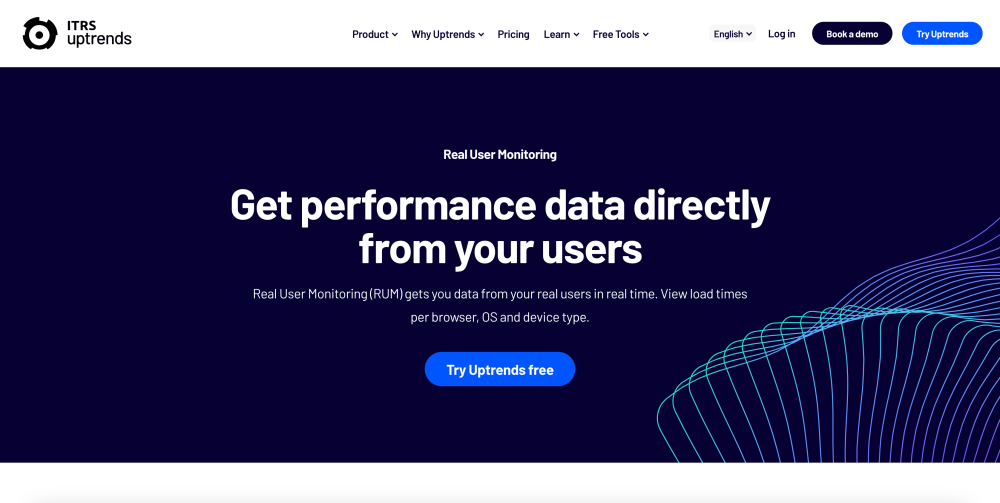
ITRS Uptrends provides a real-user monitoring tool that provides insights in real-time and combines both real-user monitoring and synthetic monitoring to offer a complete overview. The tool begins collecting data almost instantly once the script has been implemented, allowing you to begin analyzing your real user monitoring metrics. This analysis can be conducted by utilizing the dashboards such as world maps and browser usage.
Key Features:
- Combines real user monitoring and synthetic monitoring.
- Monitor website speed per country.
- Dashboards such as world maps and browser usage.
- Monitor page views vs performance.
Germain UX
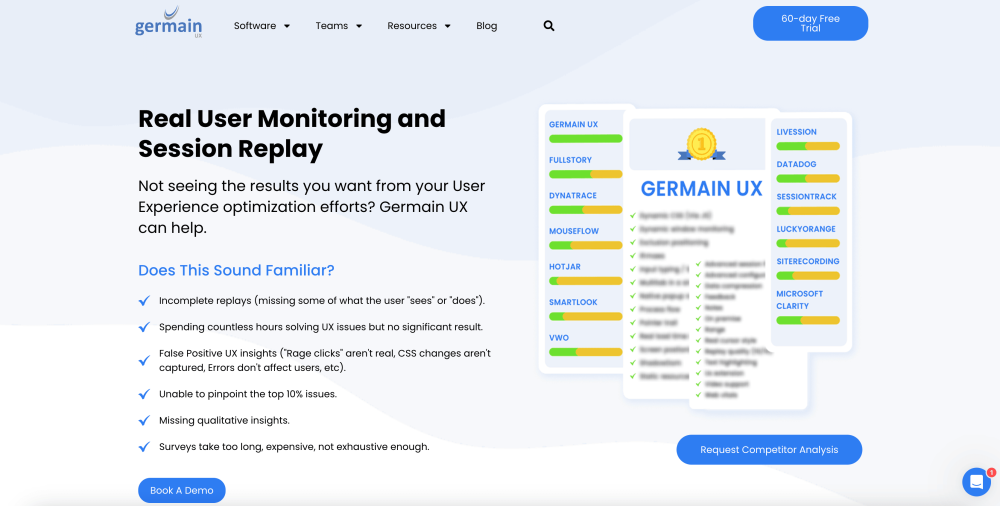
Real user monitoring from Germain UX provides the insights that you’d expect from this type of tool but with one standout feature. This feature is complete session replay that records and enables you to replay everything a user sees and does, offering an extensive analysis of the user experience and user behavior. The solution also offers in-depth behavior analysis, quick user survey popups to attain real-time feedback and insights, and is particularly customizable.
Key Features:
- Complete session replay.
- Fully searchable.
- User surveys.
- Collects qualitative and quantitative data.
Raygun
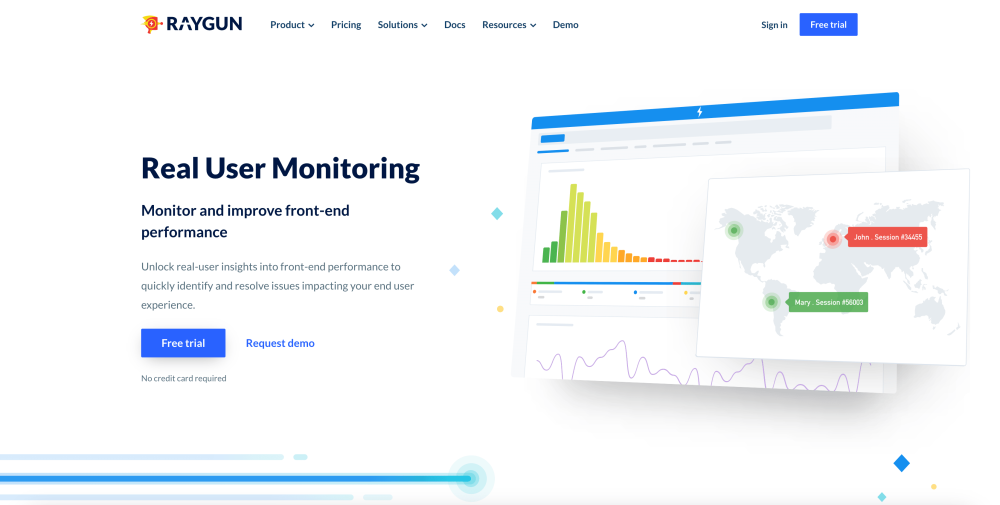
With Rayguns real user monitoring tool you can gain extensive visibility into your applications' frontend performance. The solution has language support for JavaScript, Angular, Xamarin, React, iOS, and Android. You can simply drill down into slow pages, attain instance-level diagnostics, and locate the root cause of poor performance.
Key Features:
- Language support for JavaScript, Angular, Xamarin, React, iOS, and Android.
- Performance tracking.
- Crash reporting support for all major languages.
- Customer Experience Monitoring.
Cassian
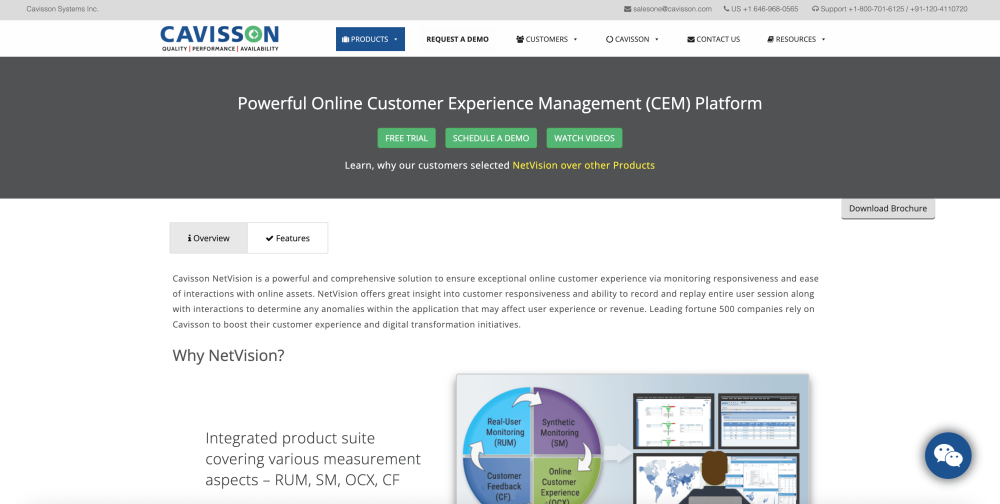
Cassion’s solution is an online customer experience platform that encompasses real user monitoring, synthetic monitoring, online customer experience, and customer feedback offering extensive analysis of how users interact with your service. The tool also provides machine learning-based anomaly detection and alerting. As well as real-time analysis of performance, availability, conversions, and revenue.
Key Features:
- Integrated product suite: Synthetic Monitoring (SM), Real-User Monitoring (RUM), Online Customer Experience (OCX), Customer Feedback (CF).
- Machine learning-based anomaly detection and alerting.
- Real-time analysis.
- Correlate bad user experience with network, application, server, or database health.
Pingdom
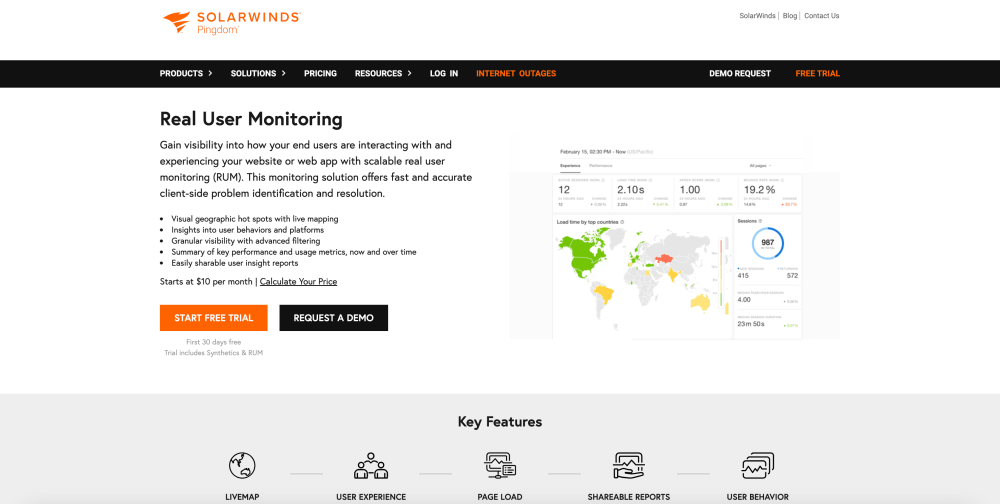
Using Pingdom, you have the ability to filter data based on specific user segments, allowing you to delve deeper into the regional performance of your website. By establishing performance benchmarks aligned with your desired standards, you can ensure the delivery of an optimal site experience to your most valuable users.
Key Features:
- Shareable reports.
- Website and server monitoring.
- User Experience monitoring.
- Mobile accessibility.
Loado
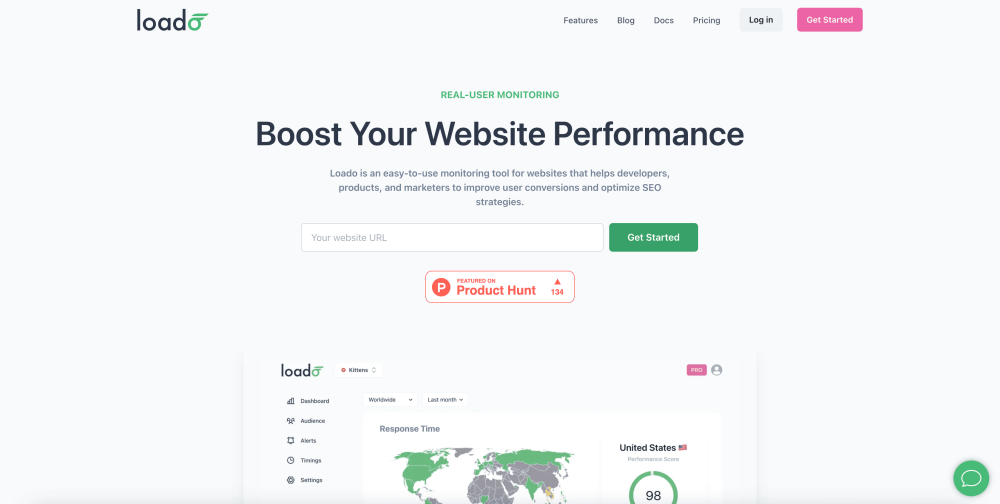
Loado is a real user monitoring tool for websites that helps marketers, as well as developers, improve user conversions and enhance SEO strategies. You can monitor and assess Core Web Vitals, guaranteeing your website maintains a competitive edge and meets the benchmarks for website performance and user experience.
Key Features:
- Receive alerts via email.
- Detailed SEO audit report.
- Real user score.
- User Timing API.
Datadog
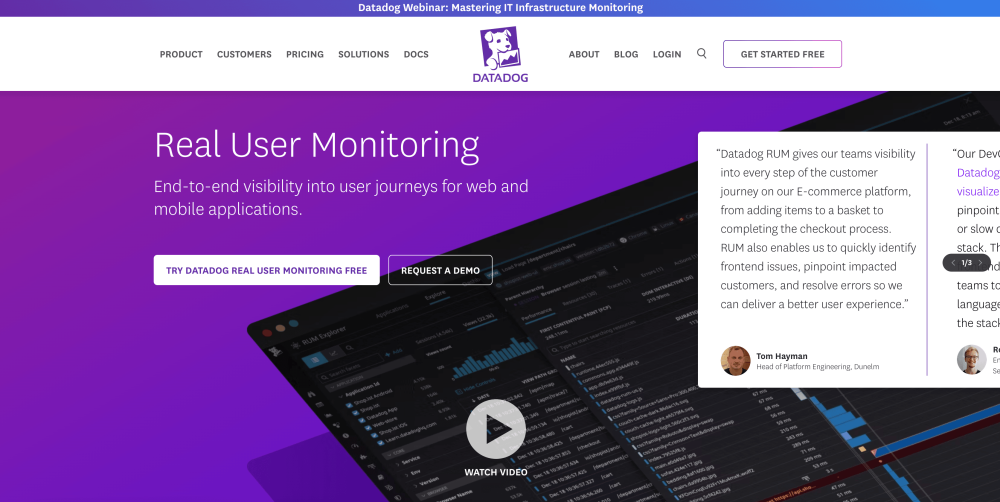
Datadog's real user monitoring tool offers comprehensive insight into the real-time behavior and actions of individual users. This solution caters to four distinct use cases for monitoring web and mobile applications. It enables you to observe specific user paths and their interactions with your application, monitoring performance metrics and capturing detailed session information including duration, visited pages, loaded resources, and more.
Key Features:
- Integration with logs, APM, and profiler.
- Error tracking and crash reporting
- Web and mobile vitals.
- Explorer and visualizations.
If you've enjoyed this artile why not read The Top 8 Network Monitoring Tools or Top Data Visualization Tools for 2024 next?