Resources
4 min read
You're mostly likely already tracking numerous business critical metrics but you may not be aware of how to make this process quicker and simpler. Analytics dashboards are graphical user interfaces (GUIs) that offer visual representations of data collected from multiple sources, such as databases, websites, applications, or other data repositories. These dashboards can make it much easier to derive insights from your analysis compared to examining numbers and metrics.
This guide lists the leading analytics dashboard examples, created using varying tools and sources, to reduce the amount of time and effort your team exerts discovering examples worth replicating.
Contents
Wagtail Google Analytics
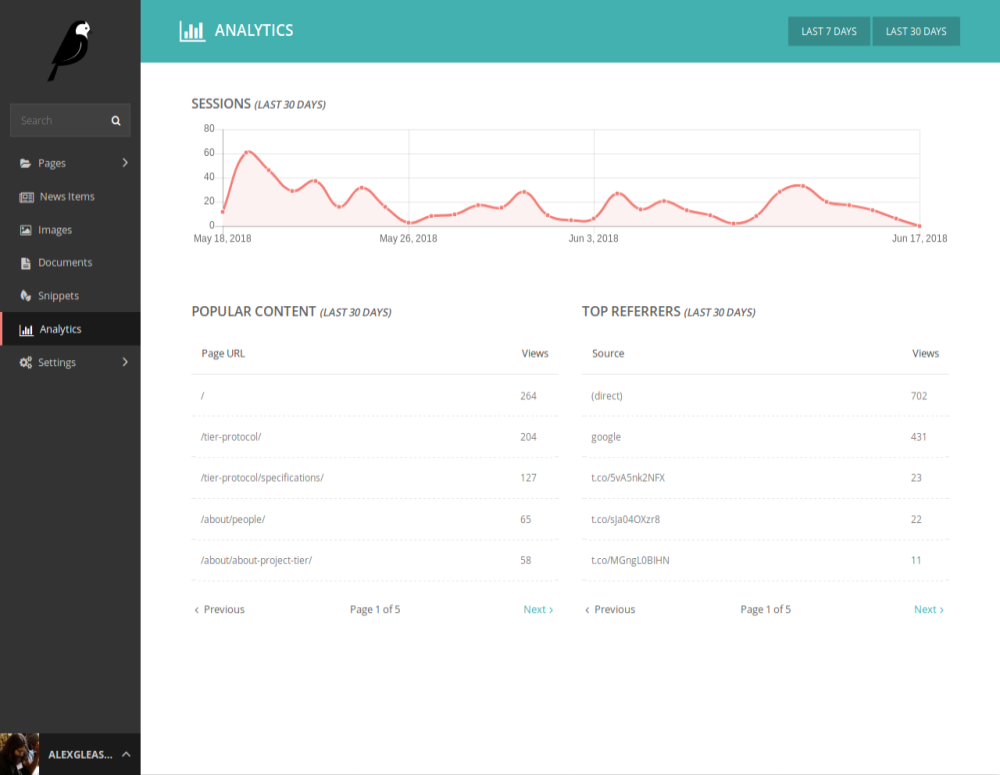
Effectively present and analyze your Google Analytics data with this Wagtail analytics dashboard. Wagtail is a free open-source content management system (CMS) written in Python, commonly favored by websites that utilize the Django web framework. This dashboard presents numerous metrics realting to your Google Analytics data such as sessions, popular content, and top referrers.
Klipfolio Social Media Dashboard
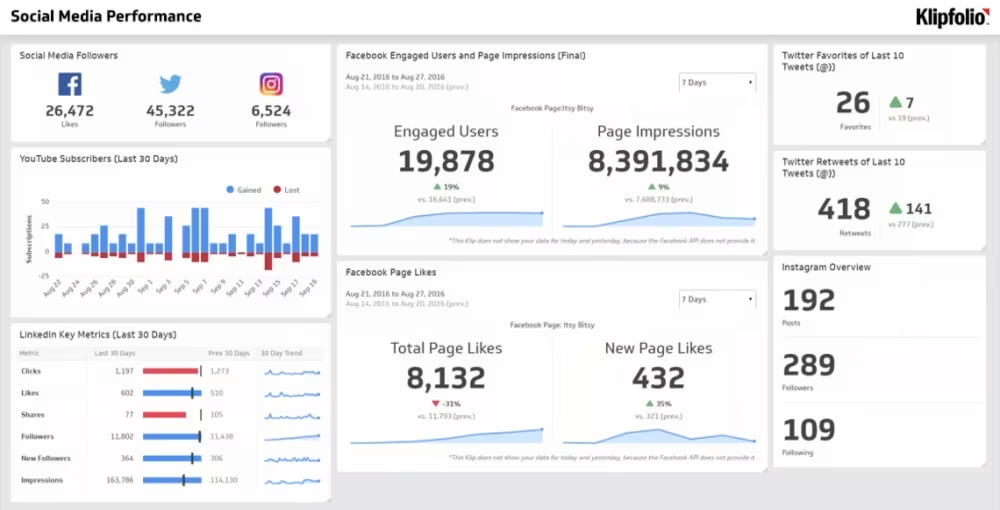
Monitoring metrics across numerous social media channels enables you to compare the performance of your content and campaigns across different platforms. This comparison assists in identifying which channels are the most effective for reaching your target audience and which may need adjustments or additional resources. This social media dashboard was designed by Klipfolio, which aims to assist data teams in providing curated, trusted data and straightforward self-serve analytics to business users and decision makers.
AWS Simple Email Service
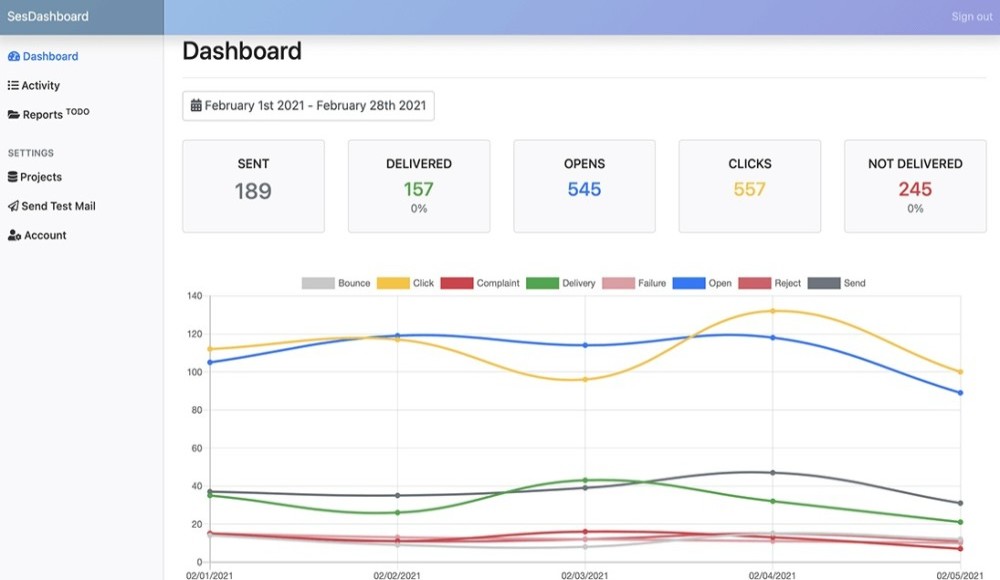
Utilizing this analytics dashboard enables you to track your AWS Simple Email Service metrics. AWS Simple Email Service prides itself as a cost-effective flexible, and scalable email service provider. The dashboard was built with SesDashboard, a free self-hosted solution which works as stand-alone app, no existing code needs to be changed. With this dashboard, acting as an email tracker, you can visualize metrics such as emails sent, emails delivered, and emails opened.
Improvado Amazon Dashboard
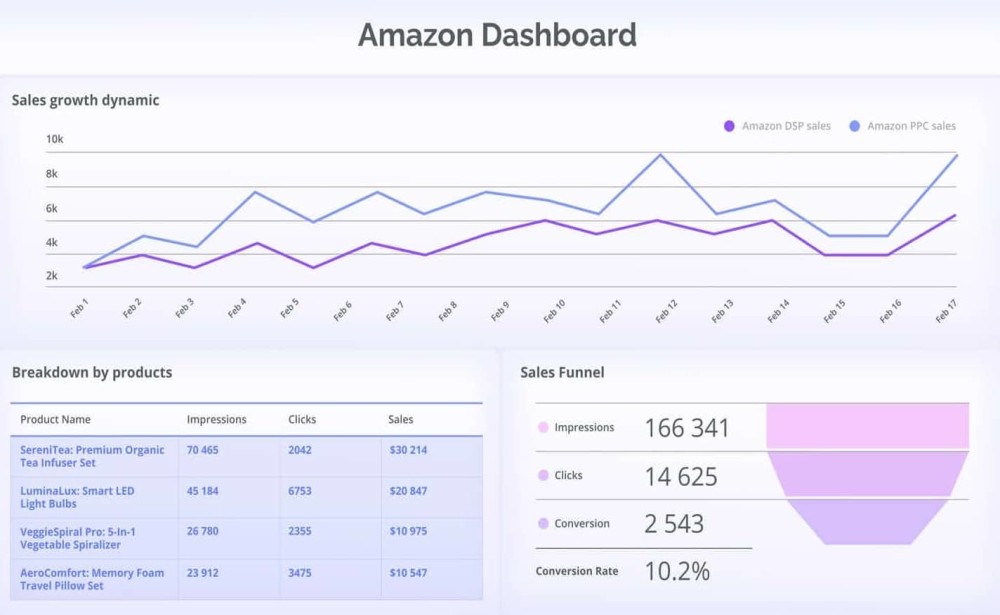
With this analytics dashboard, designed by Improvado, you can dive into online sales by drilling-down into conversions generated by organic and paid traffic. Improvado aims to help you turn data into action and make informed decisions with its full-cycle analytics solution. With this dashboard you can view a variety of metrics such as total sales generated by organic traffic, overall number of sessions on your listings, and total product sales.
Databox GA4 Acquisition
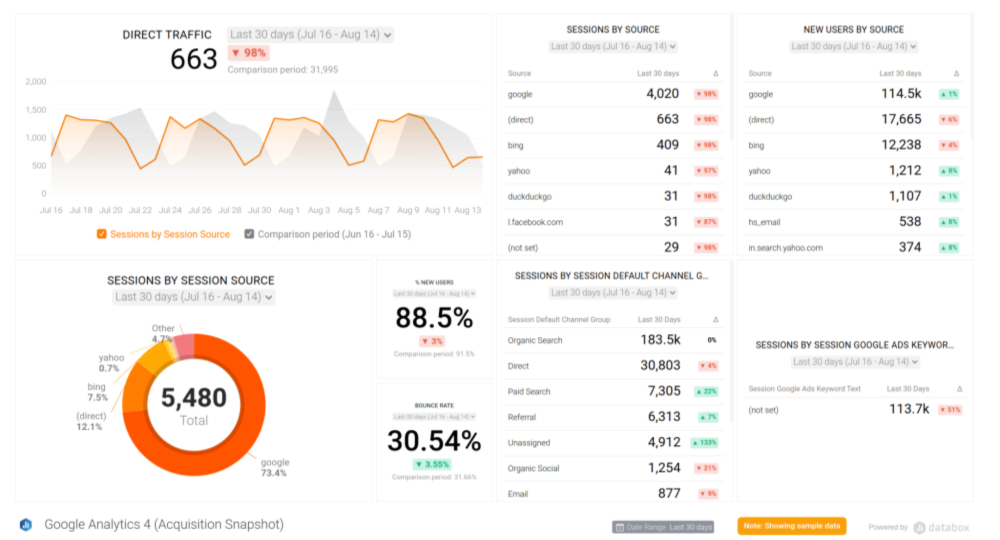
Research shows that over 70% of marketers have found moving to Google Analytics 4 challenging. This is partly due to the addition of new metrics leading to more data. However, with this GA4 acquisition dashboard from Databox you can begin to turn this data into insights. With this analytics dashboard you can view metrics such as direct traffic, sessions by source, and bounce rate.
Metabase Company Analytics
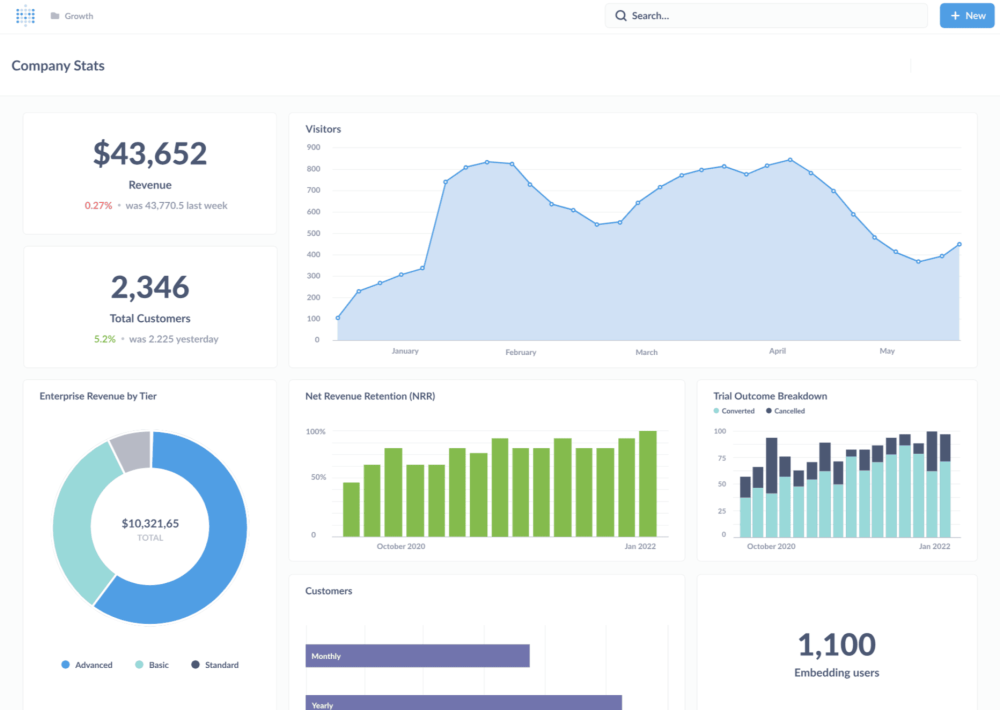
This analytics dashboard presents numerous metrics relating to your company's performance and offers complete visbility. This dashboard has been built with Metabase. Metabase provides fast analytics with a simple UX and integrated tooling to let you explore data on your own. This dashboard provides metrics such as number of visitors, total revenue and total customers.
Databox Conversion Report
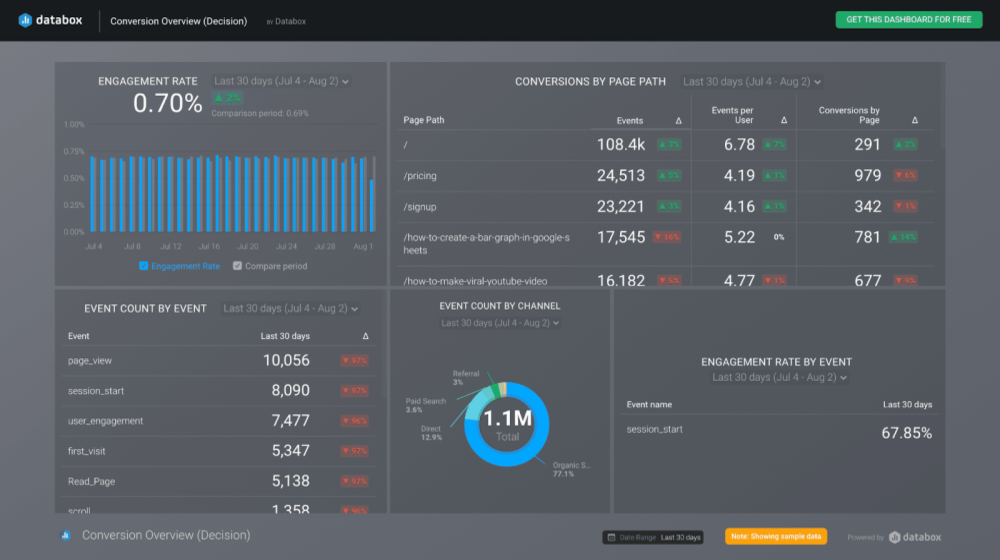
This is another example of an analytics dashboard utilizing Google Analytics 4 data, built with Databox. In this example, to produce a conversion dashboard. Databox is an all-in-one platform that aims to enable users to turn data into insights. With this dashboard you can view a range of metrics including but not limited to engagement rate, event count by channel, and conversions by page path.
PowerBI Business Intelligence Analytics
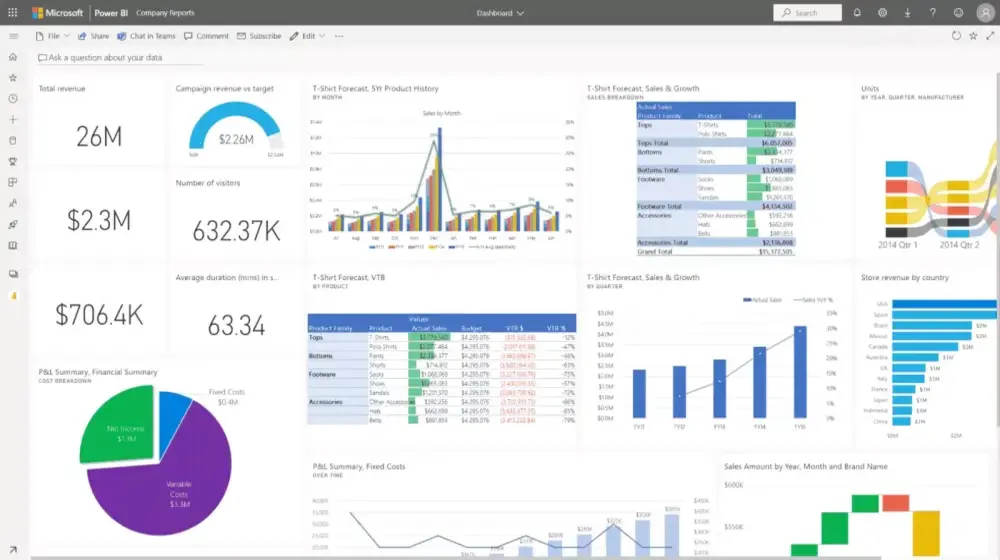
With PowerBI you can connect, combine, and analyze your entire database in order to track key business metrics. Simply connect Excel queries, data models, and reports to the dashboard and begin visualizing your data. By utilizing this dashboard you can monitor metrics such as total revenue, campaign revenue vs target, and the number of visitors.
Geckoboard Shopify
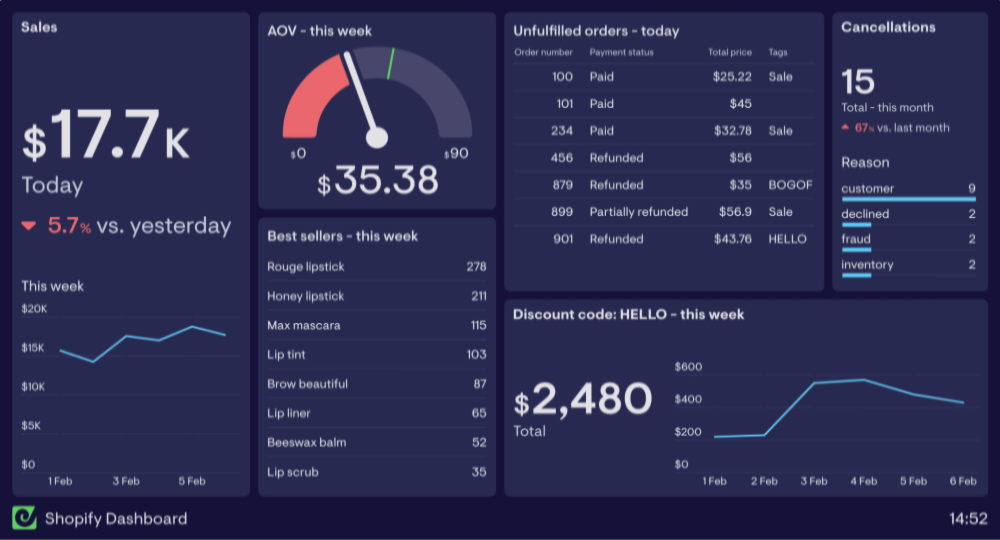
This analytics dashboard is similar to the eCommerce dashboard but it's designed for a specific scenario, websites built with Shopify. This dashboard has been designed by Geckoboard. Geckoboard enables users to track all their important KPIs on one easy-to-read dashboard. With this example you can visualize metrics such as total sales, discount codes, and cancellations.
Userpilot Usage Analytics
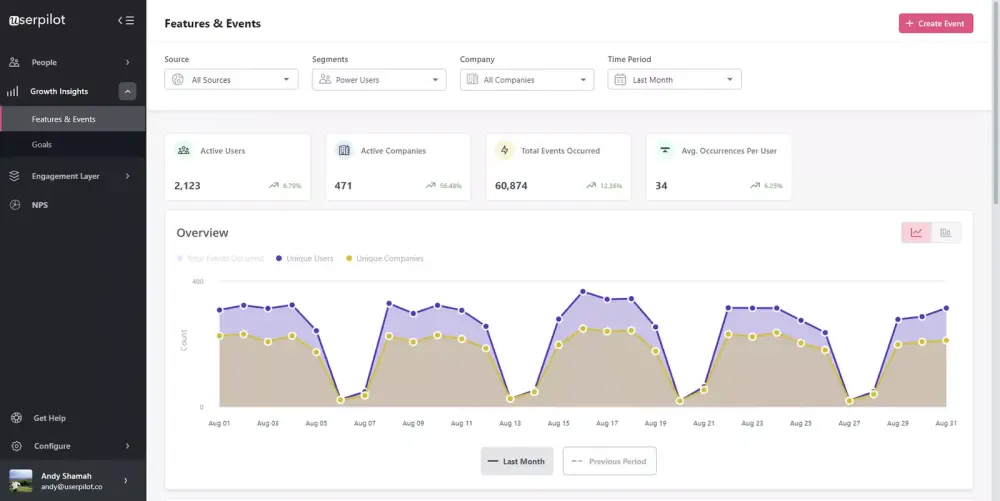
This analytics dashboard provides visualizations of your in-app product usage analytics and enables you to view how and when customers are using your product. Built with Userpilot, a solution that aims to help product teams deliver personalized in-app experiences to improve growth metrics, this dashboard presents metrics such as active users, total events occured, and average occurences per user.
Improvado Lead Generation Analytics
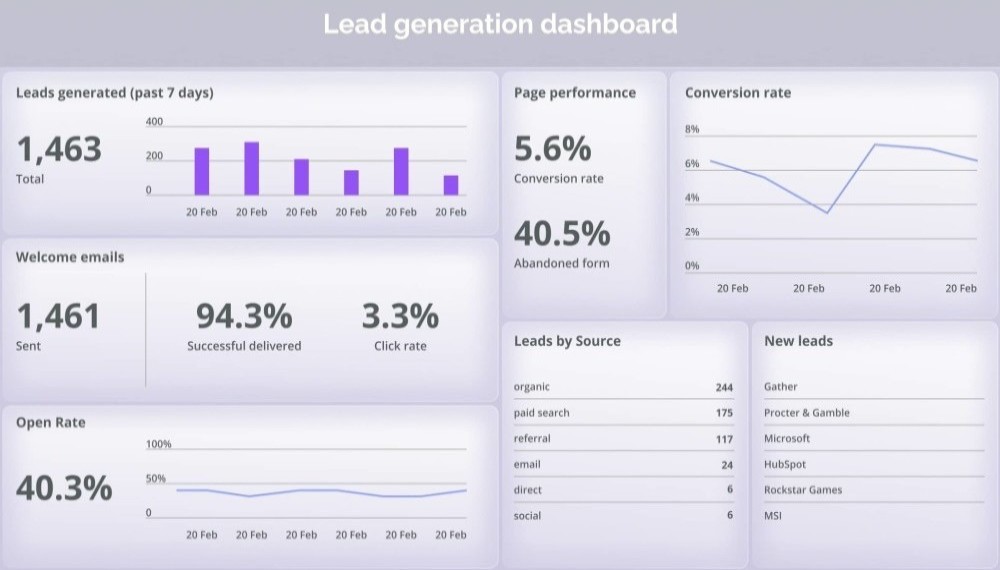
There are numerous types of traffic, channels, and sources that need to be monitored to measure the efficiency of your lead generation campaigns. This makes tracking all this data particularly complex. However, this analytics dashboard for lead generation aims to streamline this. The dashboard, created with Improvado, collects data about lead generation from varying sources and presents them on a single pane of glass in real-time. This enables efficient and accurate analysis.
If you've enjoyed this article why not read The Top 30 Grafana Dashboard Examples or The Top 15 Splunk Dashboard Examples next?
