
Resources
5 min read
Dashboards provide an enhanced view of your most critical business metrics. With the majority utilizing both real-time and historical data, they enable you to promptly respond to current trends as well as accurately forecast for the future. Also, reporting dashboards excel when compared to static reports, in regards to presenting data and objectives to stakeholders. When presenting your organization's performance, various stakeholders may have further questions that you had not prepared for, but with a reporting dashboard, you can quickly and easily find and visualize real-time data that you had not included in your original dashboard.
Contents
What is Dashboard Reporting?
Dashboard reporting presents key performance indicators (KPIs) and other important business metrics visually on a single screen or platform. It is a tool utilized to monitor, examine, and showcase data related to an organization's performance in a concise and easily understandable manner. Dashboards provide a real-time or near-real-time snapshot of relevant data, enabling decision-makers to easily assess the current state of their business. As well as this, users can fully interact with the dashboard by selecting a specific metric, graph, or chart and drill down for further analysis.
Sales Monitoring
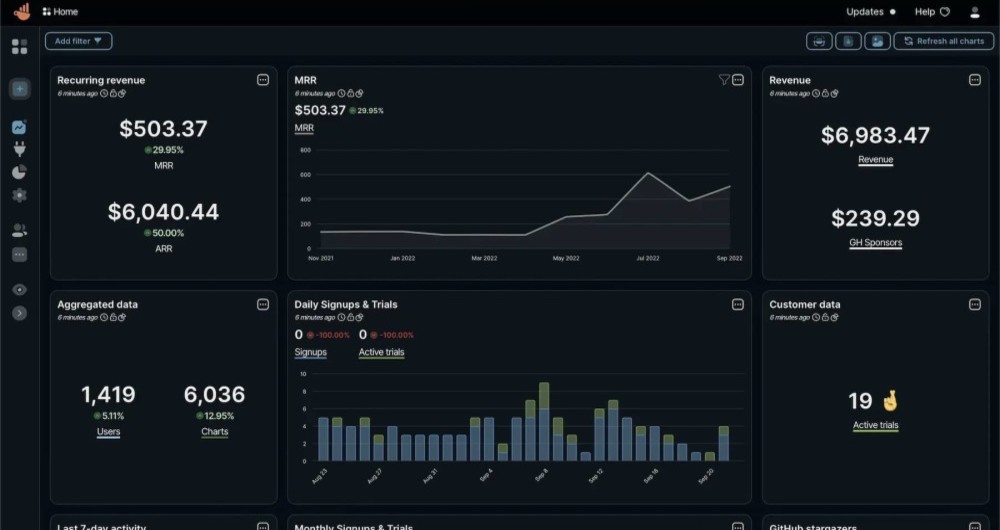
This reporting dashboard is built with Chartbrew, an open-source web application that connects directly to databases and APIs and uses the data to design charts. For this example, the dashboard presents various statistics sent from an organization's sales. With this reporting dashboard, you can view metrics such as daily signups & trials, revenue, and customer data, as well as others.
Phishing Emails
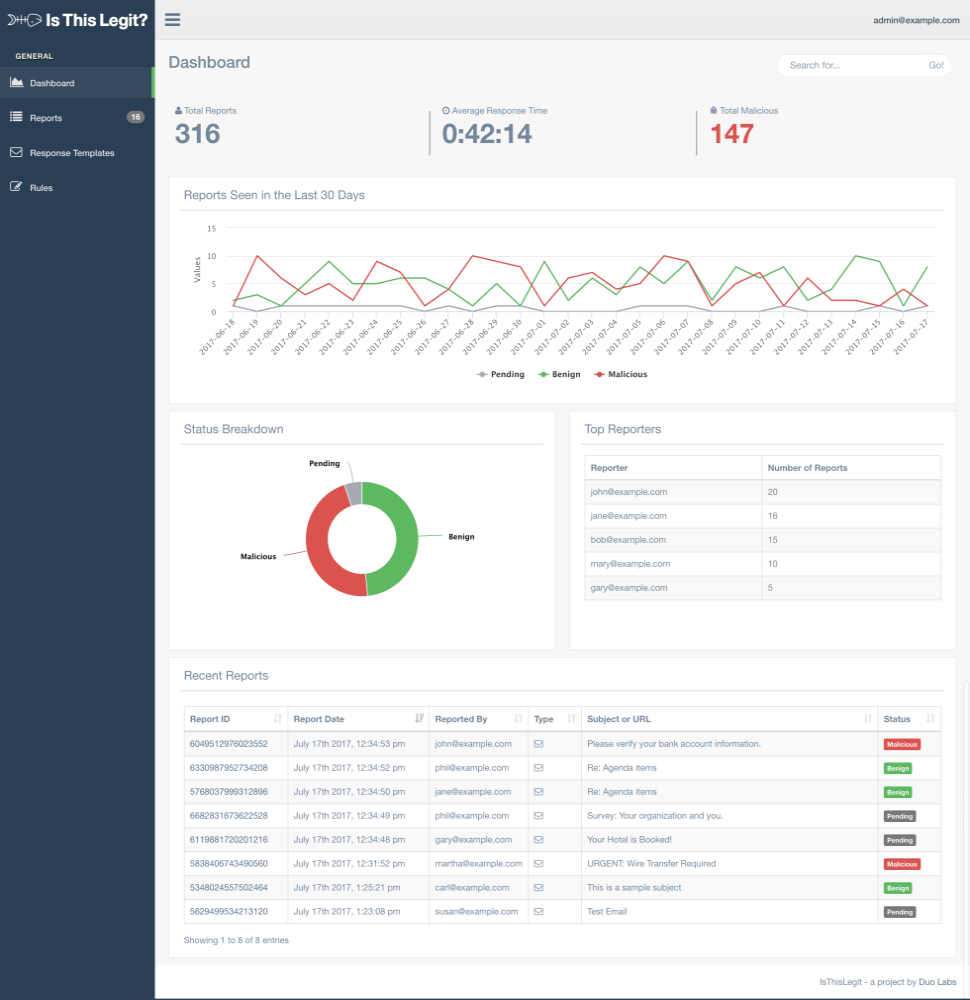
This reporting dashboard is built with Is This Legit which is a dashboard and chrome extension that collects, analyses, and responds to reported phishing emails. The dashboard is effective for highlighting how frequently your organization receives these malicious emails, and if I specific employee is receiving the majority of the phishing emails. Enabling you to easily mitigate the impact.
Server Performance
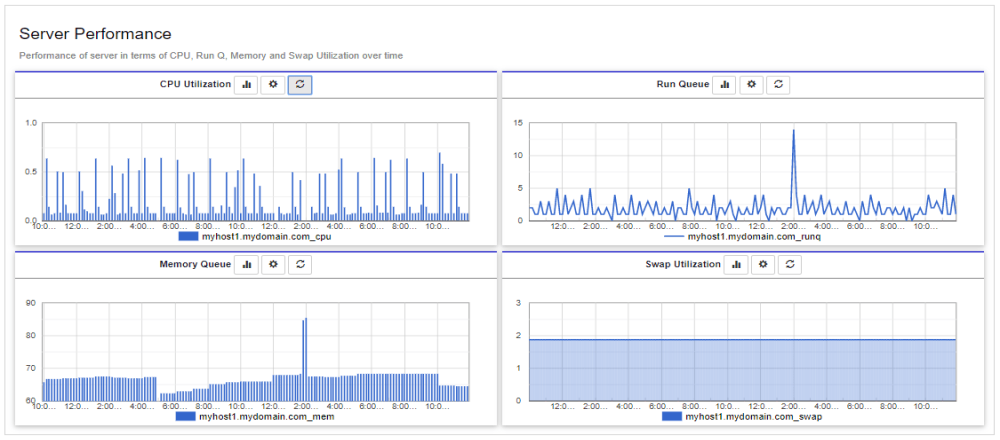
This server performance reporting dashboard is built with the open-source tool Query2Report. It’s a business intelligence platform that enables users to create reports and dashboards for business analytics or enterprise reporting. For this example, the server performance dashboard shows metrics such as CPU utilization, run queue, and others.
AWS
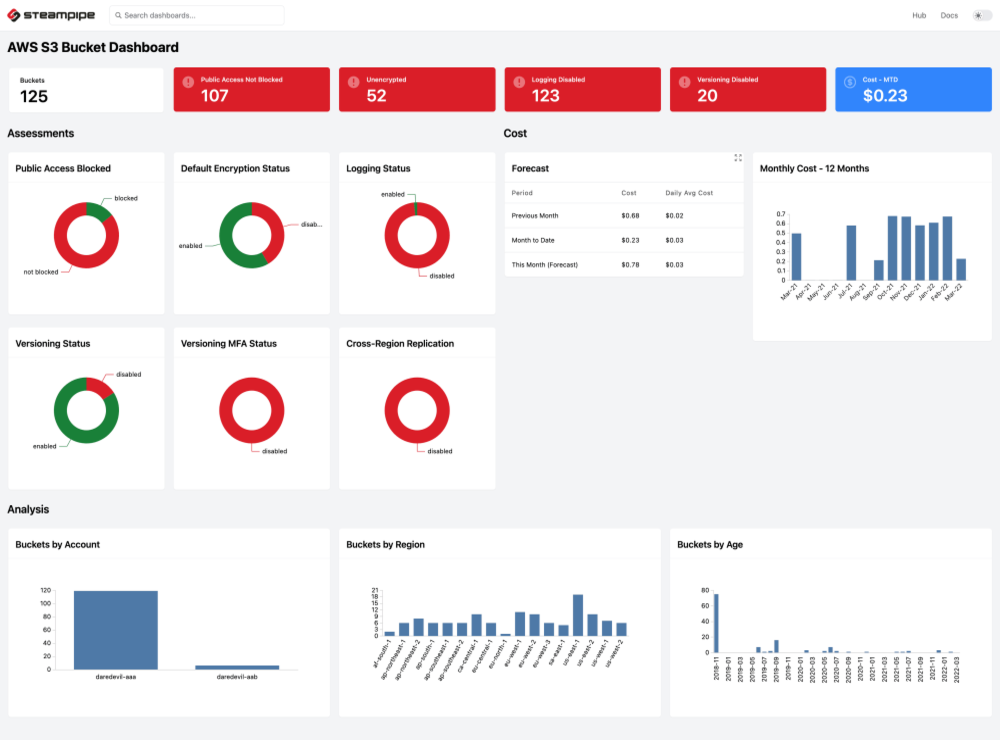
Utilizing a Steampipe mod, this dashboard visualizes and reports metrics from all of your AWS accounts. Steampipe is an open-source tool built on SQL. The dashboard is specified using a "low code" HCL format. This makes it simple to inspect, modify, and compose new dashboards to meet specific compliance and security objectives for your organization. With this reporting dashboard example, you can view metrics like the logging status, number of buckets, and monthly cost.
Auditd
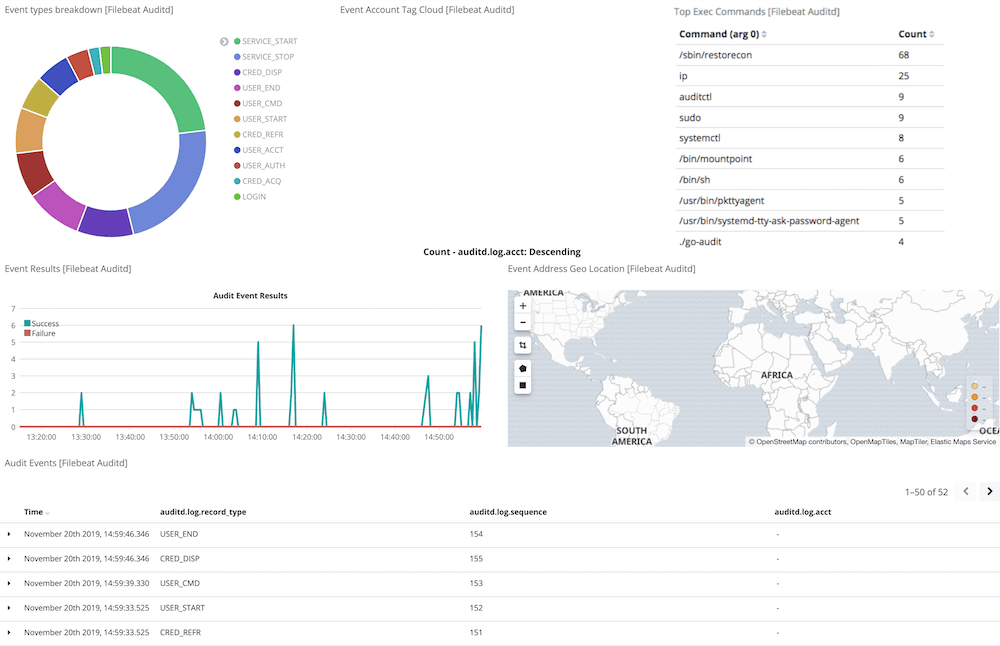
This dashboard presents metrics for Auditd and is designed using Logit.io, a scalable, compliant and affordable observability platform. With Logit.io, you can produce numerous reporting dashboards that meet the exact needs of your team or organization. This specific example focuses on Auditd, a user-space component of the Linux Auditing System, responsible for collecting and writing audit log file records to the disk. If you wish to find out more about the extensive capabilties of Logit.io, don't hesitate to begin exploring the platform for yourself with a free 14-day trial.
Nmap XML
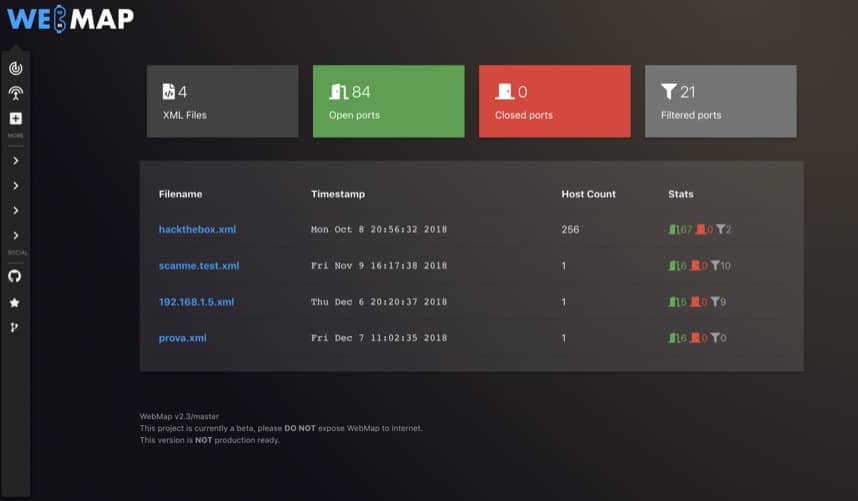
WeMap, built on RESTful API, enables you to create dashboards and reports for Nmap XMLs. By utilizing this dashboard you can run and schedule Nmap scans directly from the dashboard, analyze a single host by clicking on its IP address, and easily search for CVEs and exploits based on CPE collected by Nmap.
PuppetDB
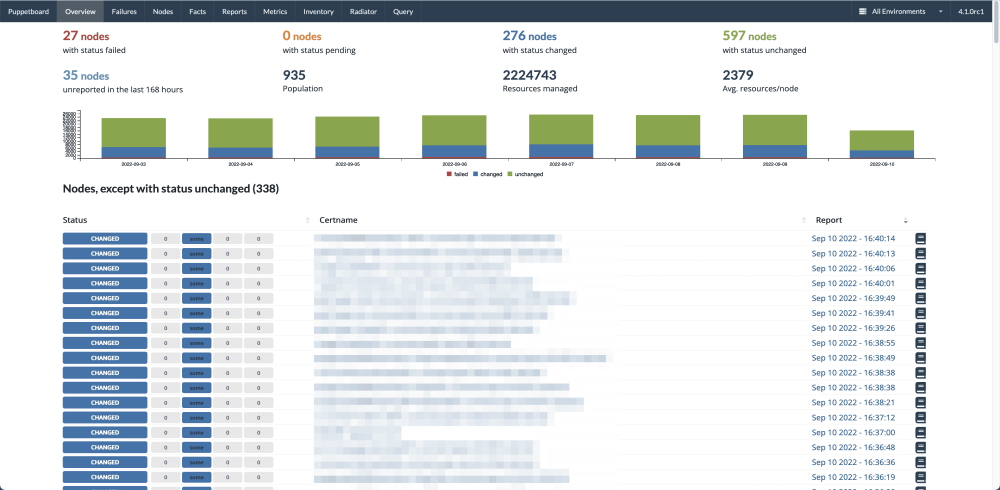
Designed with Puppetboard, which is intended to replace the reporting functionality of Puppet Enterprise, this dashboard presents a variety of metrics relating to the PuppetDB open-source project. All of the data generated by Puppet (for example facts, catalogs, reports) is stored in PuppetDB. This reporting dashboard shows metrics such as nodes with failed status’, nodes with status pending, and nodes with changed status’.
HR Monitoring
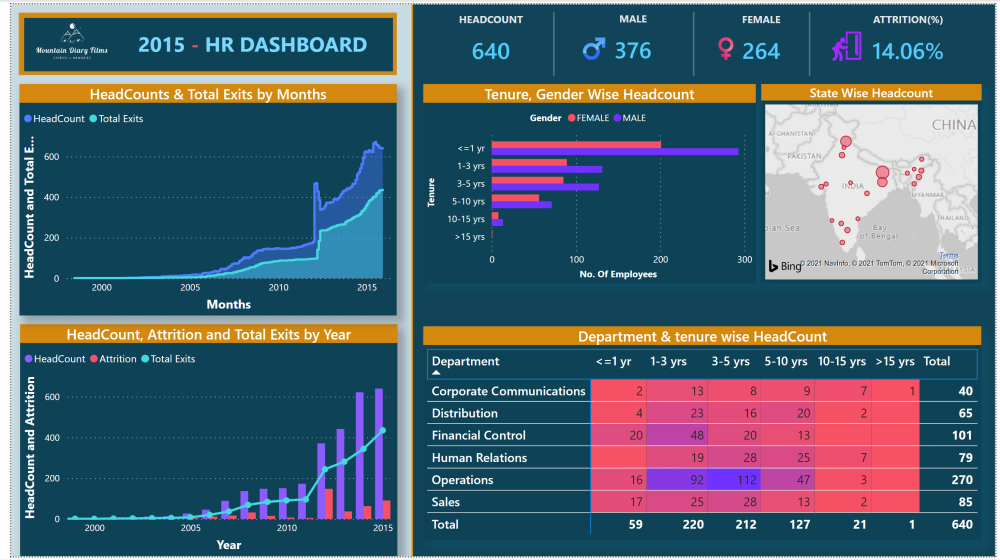
This HR monitoring dashboard, created with Power BI, provides a holistic view of employee attribution rate. The reporting dashboard utilizes charts and graphs alongside statistics to offer context to the user. This dashboard presents a range of metrics such as attribution (as a percentage), headcount, and number of employees by tenure.
Cashflow
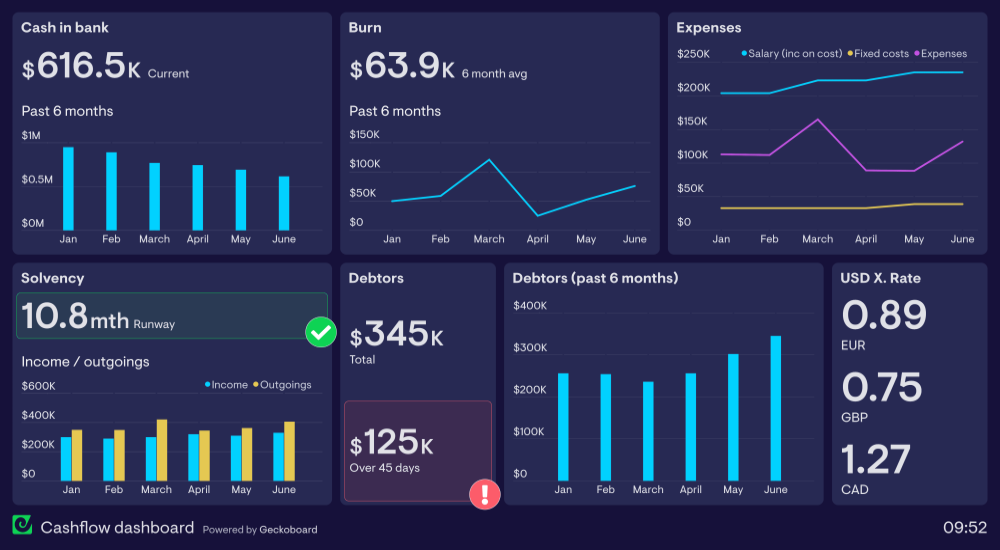
Designed with Geckoboard, this finance reporting dashboard focuses on an organization's cash flow. It monitors and presents a business’ immediate spending power and cash, and can be used to drive better-informed decisions. With this dashboard view metrics including but not limited to cash in bank, solvency, and expenses.
Business Intelligence
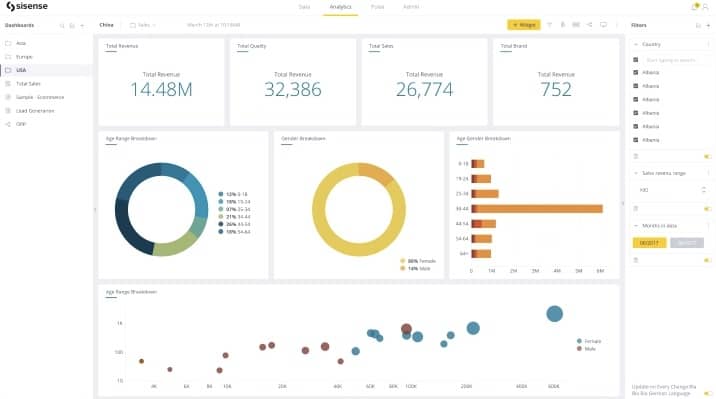
Created with Sisense, this is an example of a business intelligence (BI) reporting dashboard. BI dashboards present complex data in easy-to-understand ways so that users can discover patterns, trends, and anomalies. This dashboard provides metrics such as total revenue, total sales, and gender breakdown.
Ads Monitoring
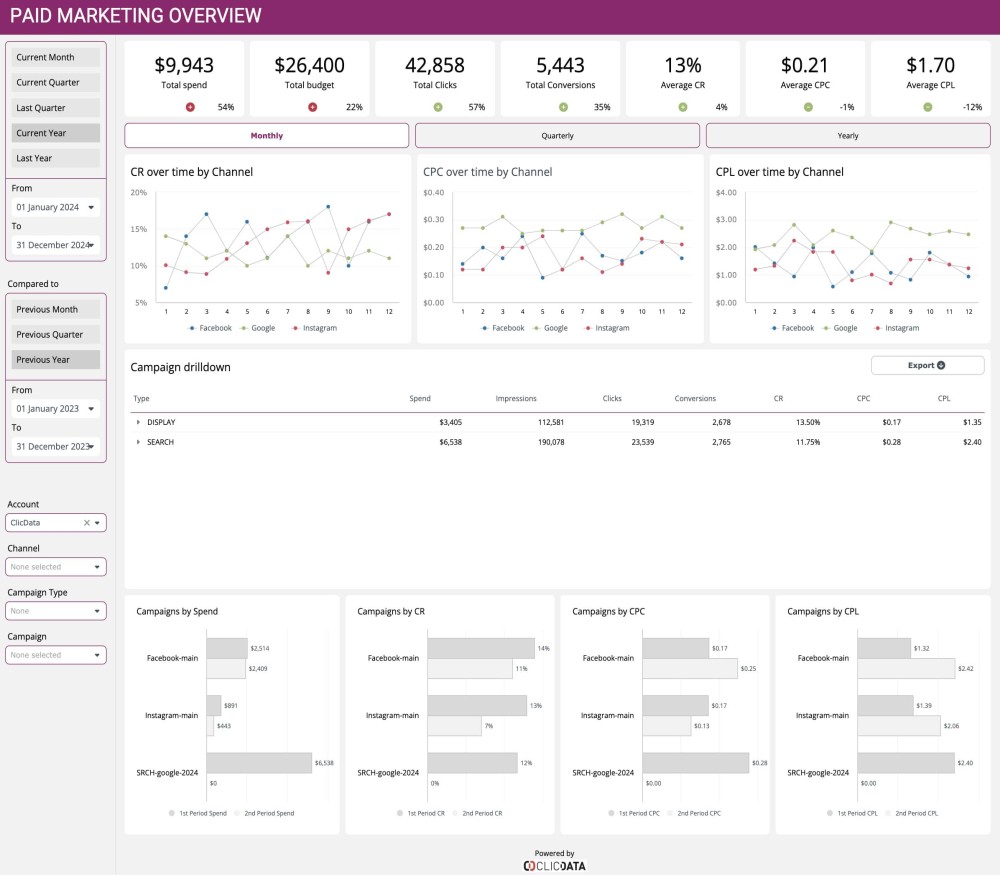
This reporting dashboard was created with ClicData and presents an overview of your paid marketing (ads) campaigns. The dashboard enables you to monitor important metrics like total spend vs budget, clicks, conversions, average CPC, and CPL over time. Also, you can filter by channel, account, or campaign type.
Project Management
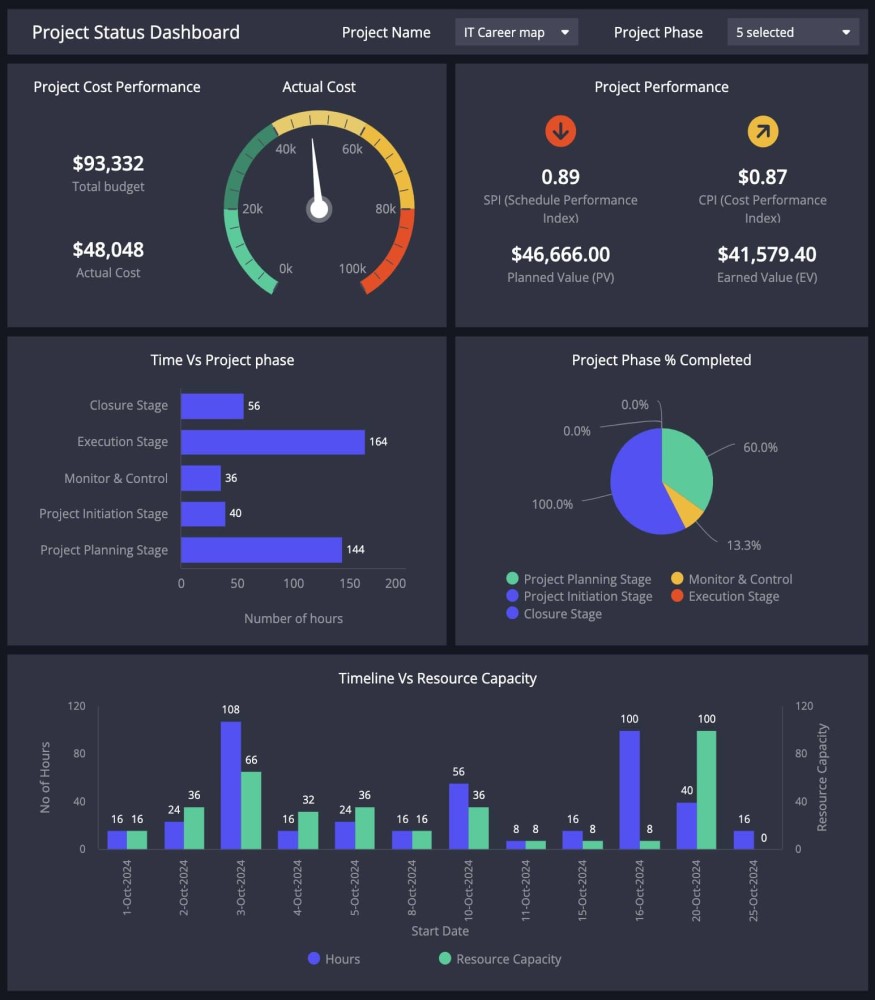
This reporting dashboard is a great tool, particularly for project managers as it presents a variety of metrics relating to project performance. The dashboard was designed with CIicData and enables users to utilize indicators to quickly compare actual performance to pre-defined goals. With this dashboard, you can view metrics like project phase completed, project performance, and actual cost.
eCommerce Sales Performance
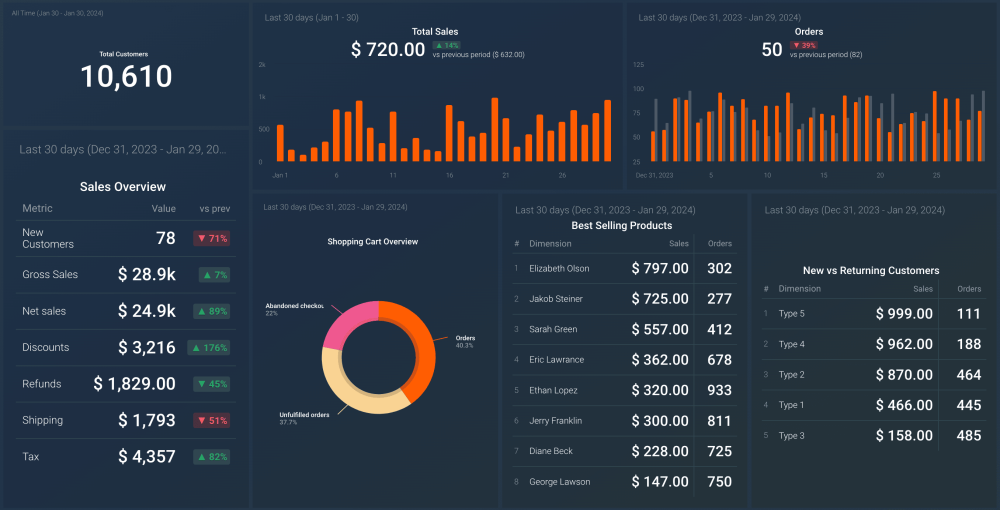
This dashboard, designed with Databox, visualizes metrics relating to your eCommerce performance, particularly sales. It provides a detailed overview of your total sales by including important metrics like cart abandonments, discounts, and returns, to ensure you view the complete picture.
If you've enjoyed this article why not learn How To Build A Dashboard or read about The Top 15 Splunk Dashboard Examples next?