Resources, ELK
9 min read
Last updated:
Kibana is a popular user interface used for data visualisation and for creating detailed reporting dashboards. This piece of software notably makes up a key part of the Elastic Stack alongside Elasticsearch and the extract, transform and load (ETL) tool, Logstash.
In this comprehensive introduction to Kibana, we are covering all of the basics that you will need to know as a user considering using Kibana for your log data visualisation and reporting needs.
This guide includes a brief history of the tool and clarification on its open-source status, as well as the use cases that you will likely encounter Kibana being well suited to handle.
Contents
- What Is Kibana?
- What Is A Kibana Dashboard?
- What Is Kibana Used For?
- How Many Versions Of Kibana Have There Been?
- Is Kibana Open Source?
- What are Open Search Dashboards?
- What Is KQL?
- How Can I Still Use Older Versions Of Kibana?
- What are some examples of organizations that trust and use Kibana?
- What access control and security features does Kibana offer?
- How can Kibana be used for monitoring and taking action on alerts?
- How does Kibana optimize search experiences for customers and users?
- What features does Kibana offer for overseeing and managing data?
- What advanced analytical capabilities does Kibana offer?
- What are the core concepts of data analysis using Kibana?
What Is Kibana?
Kibana is the formerly open-source visualisation user interface that allows users to produce visualisations, reports and dashboards from a variety of data sources.
Kibana was initially developed in 2013 by Rashid Khan, who in addition to Kibana is also the creator of the tools, Timelion and Canvas. Kibana makes up the data visualisation arm of the ELK stack (whose two remaining components include Logstash and Elasticsearch).
What Is A Kibana Dashboard?
Kibana dashboards provide an intuitive way of relaying data to the user by allowing them to combine a variety of different data visualisations and saved searches into a dynamically updating view that can be referred to at any point.
Kibana dashboards are fully customisable and compatible with displaying data in of the following formats; line and pie charts, gauges, data tables, heat maps, line graphs, coordinate maps and tag clouds.
What Is Kibana Used For?
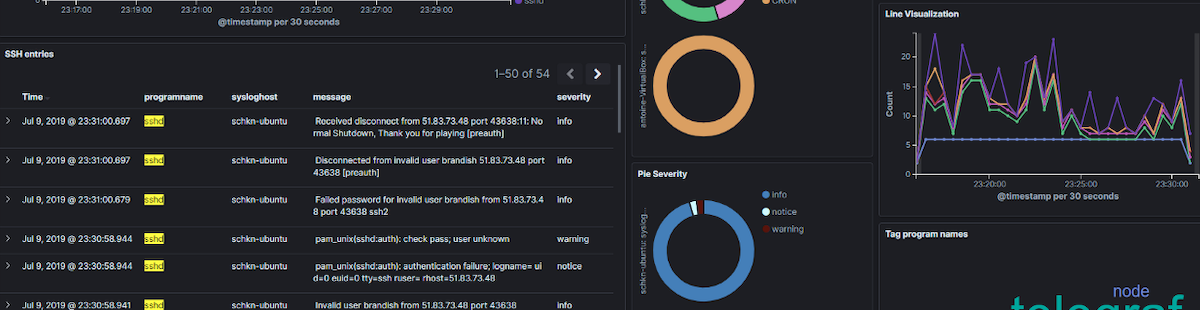
Due to its support for unstructured and semi-structured data, one of the leading use cases for Kibana is log and metrics analysis. Some of the most popular additional use cases for Kibana include the following, which have been listed alongside visual examples in our guide to Kibana dashboard examples:
- Centralised analytics dashboard for microservices
- Understanding user behaviour
- Jenkins application monitoring
- Measuring sales performance
- Resource allocation reporting
- Data streaming dashboard
- Monitoring website uptime
- Automated test tracking
- Global data monitoring
- Vulnerability scanning
- SIEM as a Service
- Firewall monitoring
- Tracking sign ups
- Linux monitoring
Some other more underutilised use cases for Kibana include its data visualisation capabilities for compliance auditing, IT operations monitoring and application performance monitoring.
How Many Versions Of Kibana Have There Been?
It was announced on the 18th of March 2014, that Kibana 3.0.0 was made generally available, from here there have been over thirty-five new releases of the data visualisation solution. Prior to the general release of Kibana, there is no support documentation being maintained for any versions prior to 3.0.0.
Is Kibana Open Source?
As of version 7.11 and onwards of Kibana, the solution is no longer being considered as open-source due to being released under server-side public licensing (SSPL) based upon the Open Source Initiative's requirements for Apache licensing.
What are Open Search Dashboards?
If you have recently been searching for an open-source alternative to Kibana then you may have heard about Open Search Dashboards in your pursuit to discover a suitable solution for logs and metrics visualisation
Open Search dashboards are built upon the best features from previous versions of Kibana and aims to build upon the solution further by adding a number of new improvements (these can be observed via AWS’s publicly viewable roadmap to give you an idea of what is coming next).
You can continue learning about the differences between the open-source, closed-source and commercial offerings of the various components of the ELK Stack (and its derivatives) in our article; Opensearch vs Elasticsearch vs Open Distro.
What Is KQL?
KQL (Kibana Query Language) is Kibana’s dedicated query language that allows you to write short and concise search queries to filter data. Any search query entered is then automatically translated into the equivalent Elasticsearch query.
The main purpose of KQL is to support a far more concise syntax as an alternative to Elasticsearch's query DSL which tends to be excessively verbose and hard to understand. While KQL syntax is much shorter than Elasticsearch's query DSL, it still provides much of the necessary flexibility to write the majority of queries required for log and metrics analysis.
To help you get started with learning KQL, we've created a helpful infographic that serves as a reference to help you learn the commands you’ll need to get started with making the most out of Kibana; KQL Cheat Sheet.
How Can I Still Use Older Versions Of Kibana?
One way to gain access to older versions of Kibana (as well as the rest of the Elastic Stack) is to use a solution such as the one offered by Logit.io, which enables users to launch legacy versions of Kibana, alongside Open Search Dashboards and even Open Distro, all from a single account.
What are some examples of organizations that trust and use Kibana?
Many prominent companies across various industries put their trust in Kibana to bring their data to life and unlock valuable insights including Airbnb, Robinhood, Accenture and Booking.com.
What access control and security features does Kibana offer?
Kibana provides robust access control and security features to ensure data privacy and protect sensitive information. With Kibana's access control capabilities, users can easily manage team access rights, share insights within and outside the organization, and connect with other systems.
To control access, Kibana offers the use of Kibana Spaces, which allows users to organize dashboards and visualizations. Role-based access control allows administrators to invite specific users into designated spaces, giving them access to relevant content and features while restricting access to other spaces. This granular access control ensures that users only have access to the necessary data and information.
Kibana also prioritizes security and offers integration with industry-standard identity management systems. It provides authentication options such as Active Directory, LDAP, or the Elasticsearch native realm, enabling users to authenticate with their existing credentials. Additionally, Kibana supports single sign-on (SSO) options, allowing users to leverage their existing authentication systems seamlessly. For users with unique identity management systems, Kibana provides the flexibility to build custom realms that support their home-grown systems.
In terms of sharing and collaboration, Kibana offers multiple options. Users can easily share Kibana visualizations with team members, compliance managers, or key stakeholders. They can embed dashboards, share links, or export visualizations as PDF, PNG, or CSV files and send them as attachments. This flexibility allows users to collaborate effectively and securely, ensuring that information is shared with the right people.
Finally, Kibana can integrate with various tools in the workplace, enhancing its capabilities and enabling seamless workflows. It can connect with incident management systems like ServiceNow and xMatters, notification tools such as email, Slack, PagerDuty, and many more. This integration allows for a more comprehensive and streamlined analytics process while maintaining robust access control and security measures.
How can Kibana be used for monitoring and taking action on alerts?
Kibana provides robust monitoring and alerting capabilities, allowing users to stay informed about critical changes and respond promptly to potential crisis situations. With Kibana, you can easily create customized alerts based on index and metric thresholds to ensure you are notified about important events in real-time.
These alerts can be set up to trigger various actions such as sending emails, generating Slack notifications, initiating PagerDuty workflows, or integrating with other third-party tools. Kibana's flexibility allows you to tailor alerts to your specific requirements and choose the most effective method for receiving notifications.
Furthermore, Kibana's integration with Discover, Elastic Observability, and Elastic Security empowers you to define unique alerts within each of these modules. This holistic approach enables you to monitor and manage all your alerts conveniently from the centralized Management tab in Kibana.
How does Kibana optimize search experiences for customers and users?
Kibana optimizes search experiences for customers and users by leveraging the power of data analysis and visualization. Through the analysis of website and user behavior data, Kibana helps users to identify trends in user queries and improve the relevance of search results. It provides a seamless experience by allowing users to visualize search data using the intuitive Kibana Lens tool.
Additionally, Kibana enables the analysis of search relevance metrics through comprehensive dashboards and machine learning capabilities. By utilizing search analytics, Kibana empowers businesses to constantly enhance and fine-tune search results, thereby ensuring an optimized and personalized search experience for their customers and users.
What features does Kibana offer for overseeing and managing data?
Kibana offers a range of powerful features for overseeing and managing data efficiently. With Kibana, you can securely and centrally store your data, ensuring that it is accessible across teams while maintaining the access controls within your organization. This enables different teams to utilize the same data for various use cases, resulting in operational efficiencies and lower total cost of ownership.
One of the key features of Kibana is its UI, which allows you to oversee and manage multiple aspects of your data from a single dashboard. This includes managing security settings, monitoring the entire stack, ingesting and aggregating data, as well as configuring various features.
To control access and ensure data privacy, Kibana provides role-based access controls, allowing you to organize your dashboards and visualizations using Kibana Spaces. This means you can define specific spaces and invite users into those spaces based on their roles, granting them access only to relevant content and features.
In terms of security, Kibana allows integration with industry-standard identity management systems such as Active Directory, LDAP, or the Elasticsearch native realm. This enables you to authenticate users and provide the right level of access to the right people. Additionally, Kibana offers single sign-on (SSO) options and the ability to build custom realms to support your organization's unique identity management system.
What advanced analytical capabilities does Kibana offer?
Kibana offers a wide range of advanced analytical capabilities to help identify anomalies and trends that might otherwise be missed. One of these capabilities is machine learning, which utilizes powerful algorithms to analyze data and uncover patterns.
Additionally, Kibana supports correlations analysis, enabling users to identify connections and relationships between various data points. Time series analysis is another feature, allowing for the analysis and visualization of data over time. Geospatial analysis is also supported, facilitating the understanding of data in relation to geographical locations.
Furthermore, Kibana provides network analysis capabilities, enabling users to analyze and understand network structures and relationships. These are just a few examples of the advanced analytical capabilities that Kibana offers, making it a valuable tool for uncovering insights from complex data.
What are the core concepts of data analysis using Kibana?
To truly master Kibana's capabilities, it is important to delve into its core concepts. One can learn these concepts in more detail through additional resources such as the book; Elasticsearch – The Definitive Guide by Clinton Gormley and Zachary Tong.
One key aspect of data analysis using Kibana is mastering the art of the Kibana dashboard. By becoming proficient in creating and utilizing dashboards, users can maximize the platform's potential. This involves leveraging the wide array of features that Kibana offers, allowing for comprehensive and insightful data visualization. To gain expertise in this area, watching a video tutorial dedicated to mastering the Kibana dashboard is highly recommended.
Get started with compliant, horizontally scalable observability stacks within minutes by using the Logit.io platform’s hosted Kibana platform.
If you enjoyed this article then why not check out our latest guide on data visualisation tools or our cheat sheet covering the top Linux commands?