
Resources, Getting Started
8 min read
Last updated:
As organisations increasingly send their logs to one service, their metrics to another and their traces to a third location, they remain unable to gain a unified view across all of their data types. This is because as multiple tools are used to achieve similar goals for different data types the issue of tool sprawl quickly arises.
As multiple platforms require "stitching" together in order to display data as a single pane of glass it can be a tedious overhead to maintain different proprietary platforms well enough so that the data shown is accurate. This is why a unified view of metrics, events, logs and traces is often so hard to achieve.
By standardising your separate data types into telemetry that is universally collected from all of your applications you can more easily visualise this data to troubleshoot issues affecting the most key elements of your business.
If you want to find out more about telemetry data then this guide will help you understand how to generate, handle and observe this data.
Contents
What Is Telemetry?
Typically, when we talk about telemetry, we are referring to data being collected from one device and sent to another remote destination for analysis and storage.
In telemetry, the performance data of any product is collected automatically and communicated to a remote location. Using telemetry, you can record information from remote or otherwise inaccessible sources and transmit this data to an IT system in another location for monitoring and analysis. In addition to software development, telemetry is used in meteorology and a variety of other fields. Telemetry can be relayed by radio, infrared, ultrasonic, satellite, or cable, depending on the application. Using telemetry data, we can enhance customer experiences and monitor security, application health, quality, and performance.
In the absence of proper disclosure and careful design, telemetry may be perceived as a violation of privacy by users. Thus, it may be worth explaining your rationale for gathering this data to site visitors beyond simply saying that you monitor everything. In this increasingly privacy-conscious operating environment, companies that disclose that their data is collected and used responsibly have an advantage over their competitors.
Telemetry Data Defined
Telemetry is defined as the automatic process of the data created by your systems being remotely collected through the use of agents and protocols. Telemetry data extends to and includes all logs, metrics, events and traces that are created by your applications. It is necessary to visualise and report on this data without gaps impacting the accuracy of your troubleshooting or analysis.
Storing telemetry data is a significant consideration in its own right and in many cases, it is only partially captured due to the cost associated with having to store this data. Risking inconsistencies in your telemetry data by not storing it will affect your ability to achieve true observability and therefore make the process of identifying issues and managing rollouts much more difficult.
By having access to more of your telemetry data rather than less, you can make much more informed choices to capacity plan, understand user behaviour and make decisions leading with data first.
What Are The Benefits of Telemetry?
Telemetry offers several benefits that can greatly assist developers in optimizing their applications and improving overall performance. Here are the key advantages of using telemetry:
1. Performance Monitoring: Telemetry allows developers to keep track of their application's performance across various locations and user devices. By receiving real-time data on performance metrics, developers can identify areas where the application is excelling or falling behind. This information helps them understand how their software is being used and make informed decisions for future enhancements.
2. User Preferences: Telemetric analysis provides valuable insights into user preferences and behaviors. Developers can gather data on user settings, feature usage, and engagement levels. This knowledge helps developers tailor their applications to meet user needs and expectations, resulting in a more personalized and satisfying user experience.
3. Feature Enhancement: Through telemetry, developers can determine which features of their software are most popular among users in different regions. They can identify the strengths and weaknesses of their application's features, enabling them to prioritize enhancements for the next version. This feedback loop ensures that developers focus on aspects that truly resonate with their user base, leading to increased popularity and adoption.
4. Crash Reporting: Telemetry enables immediate reporting of application crashes, including contextual information such as background apps at the time of the crash. By analyzing the frequency and circumstances of crashes, developers gain valuable insights into the root causes and can prioritize bug fixes accordingly. This proactive approach leads to more stable and reliable applications that can better handle concurrent usage with other apps.
5. Application Rating: User engagement is a crucial metric for evaluating an application’s success. Telemetry data helps measure user engagement by providing information on how long users interact with the application and the value they derive from its content. Armed with this knowledge, developers can optimize the application's content and design to increase user engagement, resulting in higher ratings and improved overall performance.
How Do You Use Telemetry Data?
Telemetry data can be harnessed in much the same way as you would have previously handled and inspected logs, metrics, events or trace data to improve the visibility of the performance of your systems.
As telemetry makes it simpler to ingest your data into a singular dashboard, this makes ongoing performance monitoring a much easier process to readily surface key insights on both user behaviour and performance. Telemetry data can similarly also be used to conduct end-user experience monitoring unobtrusively so that UX teams and product managers can see which platform features are most often used and why. This type of real-time monitoring is also vital for identifying the users experiencing errors which leads to issues being resolved faster and happier users overall.
By capturing telemetry data at the source without the need for an extract, transform and load (ETL) pipeline you can gather data in a highly cost-efficient and structured manner.
In a specific use case where you are trying to monitor a key component of your infrastructure, you may find the ability to collect and store telemetry from these services helpful when diagnosing database issues or resource constraints affecting the CPU.
Proactively gathering telemetry data can also allow you to pinpoint the data associated with issues such as database errors, disk limitations or Java Virtual Machine (JVM) problems.
Gathering telemetry data also plays a crucial role in the security of microservice architecture by allowing you to understand what is happening to your application and providing the data necessary for you to optimise its performance.
How Do You Analyse Telemetry Data?
When telemetry data has been generated using a collection of resources, including SDKs & APIs (such as OpenTelemetry), you will need to send this data to a backend of your choice to analyse it further.
There are many different solutions for monitoring, analysing and reporting on telemetry data that include open source solutions as well as proprietary services (with the latter tending to reduce TCO due to lessening overheads).
By forwarding your telemetry to a SaaS observability platform you gain a single source of truth across metrics, logs, events and traces simultaneously, all without the costs that arise from scaling open source solutions.
Beyond software engineering use cases, telemetry data also plays a key role in informing security detection, auditing (such as CMMC audit log controls) and compliance. By selecting a platform that can universally capture telemetry data from operating systems and cloud-native environments (such as the one offered by Logit.io) you can ensure full system visibility and accurate data analysis.
How Do You Read Telemetry Data?
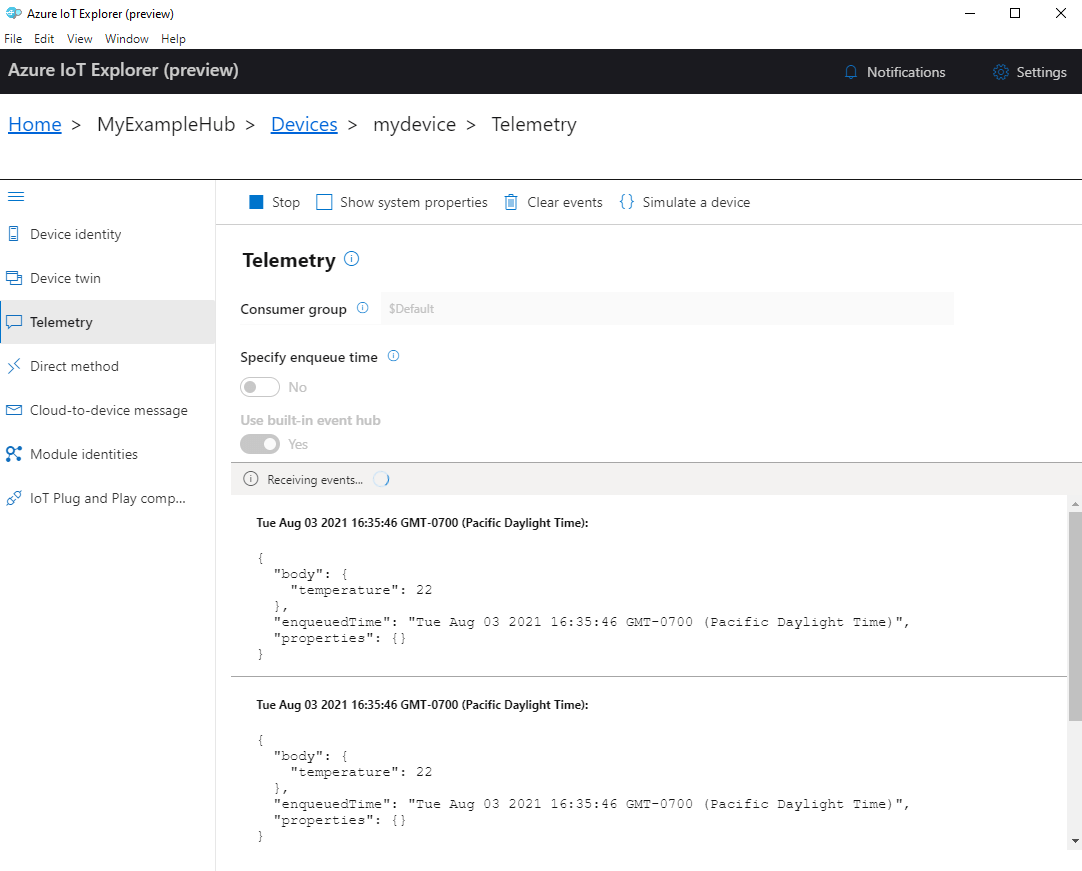 The process of reading telemetry data varies by use case. In a specific use case such as reading telemetry from Azure IoT Hub, you can use the platform's inbuilt plug and play feature within the IoT Explorer. This tab will allow you to specify enqueue time, use the built-in Event Hub and see events as they are received by the service.
What Kinds Of Companies Use Telemetry Data?
If we use Github to look at some of the engineers contributing to a popular telemetry project such as OpenTelemetry we can see the following companies all capture telemetry data in some form;
- Microsoft
- Wantedly
- Workday
- Cisco
As the technology industry moves towards using unified standards for data capture it can clearly be seen that a shift towards full observability is where telemetry plays a key role in the future of data analysis.
Logit.io for OpenTelemetry
If you're seeking an efficient way to standardize your logs, metrics, traces, and events, integrating OpenTelemetry (OTel) with Logit.io offers a seamless path to achieving end-to-end observability. OpenTelemetry provides a unified data structure that simplifies automated analysis and saves engineers time by enabling the standardization of data from any source.
By instrumenting your applications with OpenTelemetry and ingesting the resulting data into Logit.io, you can gain comprehensive visibility into the state of all your components and infrastructure. This integration ensures a more streamlined and effective monitoring process.
With Logit.io, users can benefit from the most reliable monitoring, analytics, and reporting platform. Logit.io establishes a unified central hub that consolidates all your logs, metrics, and traces, into a single, authoritative source of information.
Our observability platform offers unparalleled flexibility and affordability. It comes with no vendor lock-in, transparent pricing, no charges for data egress, and no mandatory multi-year commitments. If you’re interested in finding out more about our platform, don’t hesitate to get in contact or get started with a 14-day free trial.
Unlock complete visibility with hosted ELK, Grafana, and Prometheus-backed Observability
Start Free TrialIf you found this post informative then why not check out our popular guides on what is SecOps? or what is Kibana?