Resources
6 min read
Time series data is particularly prevalent, seen across numerous different industries and use cases. It offers significant value to various organizations, highlighting the importance of effectively monitoring and analyzing the data. By analyzing and monitoring time series data you can understand trends, patterns, and anomalies in sequential data collected at many points in time.
This becomes crucial across industries because it helps an organization to make informed decisions, optimize operations, and forecast future outcomes. A continued tracing and examination of time series data will reveal new emerging trends, detect irregularities, and allow one to proactively take steps to handle an anticipated problem in the company.
To help you better understand time series data, this article will outline what it is, key characteristics of time series data, and examples of time series data, before listing the leading databases for time series data.
Contents
What is Time Series Data?
Time series data is a succession of data points at regular time intervals, normally constant. This type of data is important in analyzing how variables are changing with respect to time and therefore finds many applications in such fields as finance, economics, environmental science, healthcare, or engineering. Time series data is common. With our world becoming increasingly instrumented, sensors and systems continuously generate a steady flow of time series data.
Key Characteristics of Time Series Data
Temporal Ordering
One of the most crucial properties of time series data is temporal ordering. Each observation in the time series is tagged with a timestamp, and the sequence of these timestamps matters during analysis. The temporal feature of time series allows analysts to monitor how a variable changes over time and hence identify trends, seasonal effects, and periodicities. Chronological ordering ensures that the sequence of events or measurements agrees with how time is truly progressing which is beneficial for forecasting and trend analysis.
Frequency
Depending on the nature of the data and what analysis is required, time series data may be collected at several frequencies. The range goes from high-resolution data points, like every second or minute, to less granular data points, such as daily, monthly, or yearly measurements. Hence, the chosen frequency impacts the granularity of view in analysis and the level of detail available. High-frequency data provides more insight into very short-term changes, whereas lower-frequency data may be more appropriate for observing longer-term trends and seasonal patterns.
Stationarity
Stationarity is another critical concept in time series analysis, denoting a time series with constant statistical properties over time. If the time series has a constant mean, variance, and autocorrelation structure in its period, then it is considered a stationary time series, which would be comparatively easy to model and analyze. The non-stationary time series, though having trends or seasonal patterns or even different variances, may want to be transformed to achieve stationarity so that certain analytical techniques can be applied. Non-stationarity can be dealt with by methods such as differencing or logarithmic transformations.
Trends and Seasonality
Trends and seasonality are important constituents of time series data. A trend represents a long-run movement in data, indicating whether the variable is on an increasing, decreasing, or stable platform over time. The information helps to find out the overall direction of the data. Seasonality refers to periodic regular fluctuations of a constant cycle, usually daily, monthly, or quarterly. It is often the case that these seasonal patterns crop up due to exogenous factors such as weather, holidays, or economic cycles, and it is important to understand them for correct forecasting and planning.
Cyclical Patterns
Cyclic patterns in time series data are changes over longer periods, usually influenced by economic or business cycles. In contrast to seasonal patterns, which have strictly periodic components, cyclic patterns are less predictable and may vary in duration and amplitude. Being able to identify and analyze these cycles may provide a better understanding of the more general economic or industry trends influencing the time series data.
Irregular Variations
Irregular variations, or noise, are random time series fluctuations that do not suggest any pattern or trend. These may be caused by unexpected events, measurement errors, or other anomalies. Much as they often mask the underlying patterns, their detection, and accounting are important for realistic analysis and forecasting. Smoothening and filtering methods are commonly applied to remove the effects of noise and try to bring out the more significant trends and patterns.
Time Series Data Examples
Finance
- Stock Prices: The daily closing prices of stocks that define the value of this security over time.
- Exchange Rates: The various rates at which different currencies are exchanged for one another, either hourly or daily.
- Economic Indicators: Quarterly GDP, monthly unemployment rates, and inflation rates.
Marketing and Sales
- Sale Information: This includes daily or monthly sales data for products or services.
- Website traffic: An hourly or daily measure of visits, page views, and user interactions with a website.
- Customer Behavior: Purchase history, activity in loyalty programs, and other engagement metrics.
Environmental Science
- Weather Data: Temperature, humidity, wind speed, precipitation—hourly.
- Climate Change: Annual means of global temperatures, CO2 concentration levels, and sea ice extent.
- Air Quality: AQI readings and pollutant concentrations.
Healthcare
- Patient Vital signs: The pulse rate, blood pressure, and temperature of the body should be continuously monitored.
- Epidemiology: Cases of reported diseases, such as influenza or COVID-19 infections, on a weekly count basis.
- Medical Imaging: Time-lapsed data from imaging studies, such as MRI or CT scans, during treatment.
Best Database for Time Series Data
Choosing the right type of time series database is important because it directly affects the efficiency and effectiveness of data storage, retrieval, and analysis. Time series databases are designed for large volumes of sequential data, providing optimal write, as well as query performance, efficient storage management, and specialized services on features such as downsampling and complex time-based queries.
InfluxDB

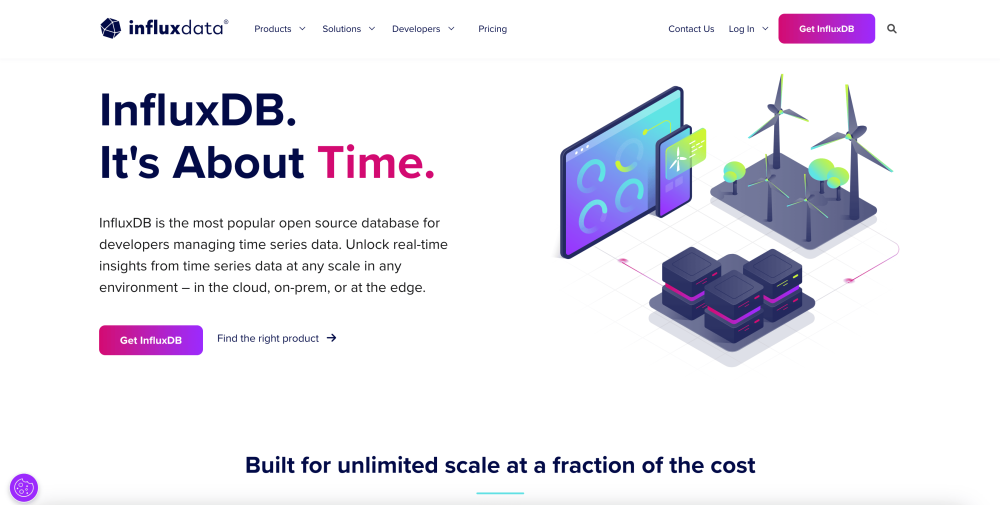
InfluxDB is a purpose-built, high-performance time series database designed to manage high volumes of time-stamped data. It is good for storing, querying, and analyzing large amounts of time series data sources, such as IoT devices, application metrics, and real-time analytics. Enriched by its query language, native compression of data, and efficient structures of storage, InfluxDB enables fast ingestion and retrieval of data.
TimescaleDB

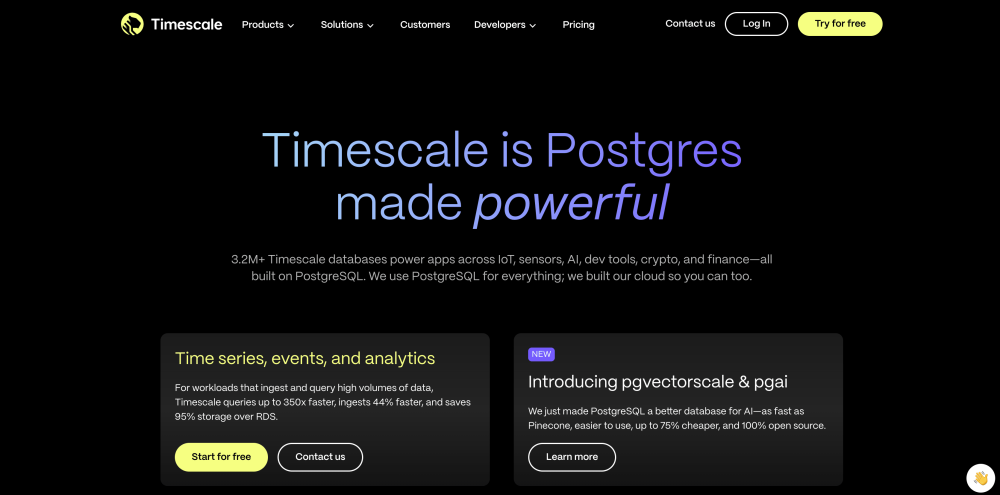
TimescaleDB is a powerful, PostgreSQL-based time-series database that combines the reliability of traditional relational databases with specialized features for time-series data. It efficiently stores large volumes of sequential data, high-performance time-based querying, and complex analytics and aggregations, powered by PostgreSQL's rich ecosystem and SQL capabilities. It helps users perform complex analytics and aggregation, making it suitable for use cases like monitoring, IoT data analysis, and tracking financial data.
Logit.io Hosted Prometheus

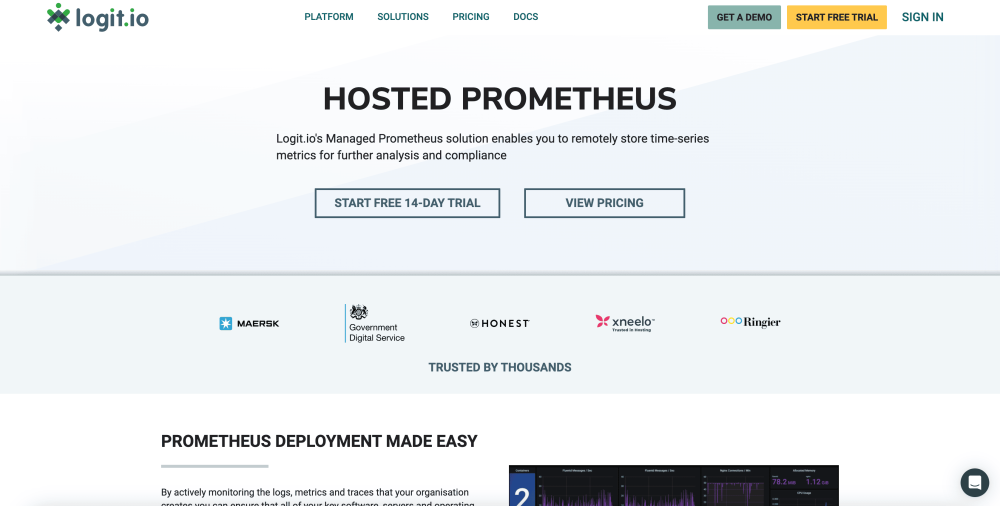
Logit.io’s Hosted Prometheus is a managed variant of the popular Prometheus Time Series Database, targeting monitoring and alerting in cloud environments. It offers the same power in data collection, querying, and visualization as the open-source Prometheus, but with many of the advantages of a managed service such as automatic scaling, maintenance, and updates.
Hosted Prometheus scales effectively for high-frequency time series data and is excellent for real-time monitoring, cloud-native application, and infrastructure observability. Also, integration with Hosted Grafana further enhances the solution with the use of dashboards and visualizations. If you’re interested in finding out more about Hosted Prometheus from Logit.io feel free to contact us or begin exploring the platform for yourself with a 14-day free trial.
If you've enjoyed this article why not read What is Prometheus or The Best Prometheus Dashboards next?
