
Resources
8 min read
Last updated:
In this roundup of the best dashboards powered by the Prometheus metrics monitoring system, we wanted to show you some of the best use cases for this ever-popular solution for time series metrics alerting.
Contents
- What is Prometheus?
- What Is A Prometheus Dashboard?
- What is Grafana and how is it used in conjunction with Prometheus?
- How can Grafana be configured to use Prometheus as a data source?
- How does the Prometheus Expression Browser help users visualize time series metrics?
- Website Monitoring
- Monitoring Use Container Engine for Kubernetes (OKE)
- Tracking Active SSH Sessions
- Monitoring Spring Boot Applications
- Hyperledger Fabric Network Monitoring
- Monitor Azure Kubernetes Service (AKS) Infrastructure
- Surface Open Policy Agent Violations
- MySQL Insight Reporting
- Windows Server Dashboards
- Kubernetes Microservice Monitoring
- Tracking Linux Server Performance
- HAproxy Reporting Dashboard
- Pi-hole Tracker
- Monitor Home Energy Expenditure
What is Prometheus?
Prometheus is a monitoring and alerting stack made for dynamic environments. Prometheus is the de facto standard for Kubernetes monitoring, including it's time series metrics and the metrics of other cloud-native applications. The four main benefits of Prometheus are its dimensional data model, its powerful query language, its simple and efficient server and finally, its service discovery integration.
Prometheus is well known for its operational simplicity, high availability due to running two servers in parallel (one of these servers will work as your alerting server) and Go static binary.
Prometheus is a pull-based monitoring system so it expects to be able to go to your instances and request the current value of the time-series data that it is tracking. It is important to consider that this monitoring stack does not handle replication or clustering of any kind. Prometheus also only has local on-disk storage which makes it have limited scalability and durability due to it being a single node system with no built-in replication.
What Is A Prometheus Dashboard?
A metrics monitoring dashboard that consists of a front end dashboard built using Grafana which uses Prometheus behind the scenes for metrics exporting and monitoring could be accurately described as a Prometheus backed dashboard.
What is Grafana and how is it used in conjunction with Prometheus?
Grafana is a powerful open-source tool focused on metric analytics and visualization. It is commonly employed to provide a visual representation of time series data, specifically for infrastructure and application analytics. Beyond its traditional usage, Grafana is versatile and can be utilized in various scenarios like monitoring industrial sensors, managing home automation systems, tracking weather data, and regulating processes in industries.
When it comes to integrating Grafana with Prometheus, Grafana conveniently supports Prometheus as a data source, making it seamless to link the two tools together for comprehensive monitoring and visualization capabilities. By configuring Grafana to use Prometheus as a datasource, users can tap into the rich functionalities of both platforms to effectively monitor and analyze their metrics data over time.
How can Grafana be configured to use Prometheus as a data source?
To configure Grafana to use Prometheus as a data source, follow these step-by-step instructions:
- Install Grafana on your system.
- Open Grafana and locate the side menu by clicking on the Grafana icon in the top header.
- Within the side menu, find and click on the 'Data Sources' link.
- Add a new data source by clicking on the '+ Add data source' button in the top header.
- From the Type drop-down list, select 'Prometheus' as the data source type.
- Provide a relevant name for this data source in the appropriate field.
- Configure the HTTP settings by entering the URL of the Prometheus server. For example, the URL could be http://localhost:9090/.
- Depending on your requirements, adjust other data source settings such as selecting 'Proxy' for access via the Grafana backend or 'Direct' for direct access from the browser.
- To save the new data source configuration, click on the 'Add' button.
By following these steps, you will successfully configure Grafana to use Prometheus as a data source for visualizing your data metrics.
How does the Prometheus Expression Browser help users visualize time series metrics?
The Prometheus Expression Browser serves as a valuable tool for users seeking to visualize time series metrics collected by the Prometheus server efficiently. By accessing the endpoint /graph within the Prometheus suite, users can display their time series metrics either graphically or in a tabular format, based on their preferences. This allows for a clear and organized representation of data for analysis and monitoring.
One key feature of the Prometheus Expression Browser is its ability to enable users to specify the exact metric they want to visualize by entering the metric name into the Expression field. Upon hitting the Execute button, the browser retrieves and displays data related to the specified metric, both in a table view (located in the Console Tab) and a graph view (available in the Graph Tab). This visual representation provides users with a clear understanding of trends, patterns, and anomalies within the data, aiding in effective decision-making and troubleshooting.
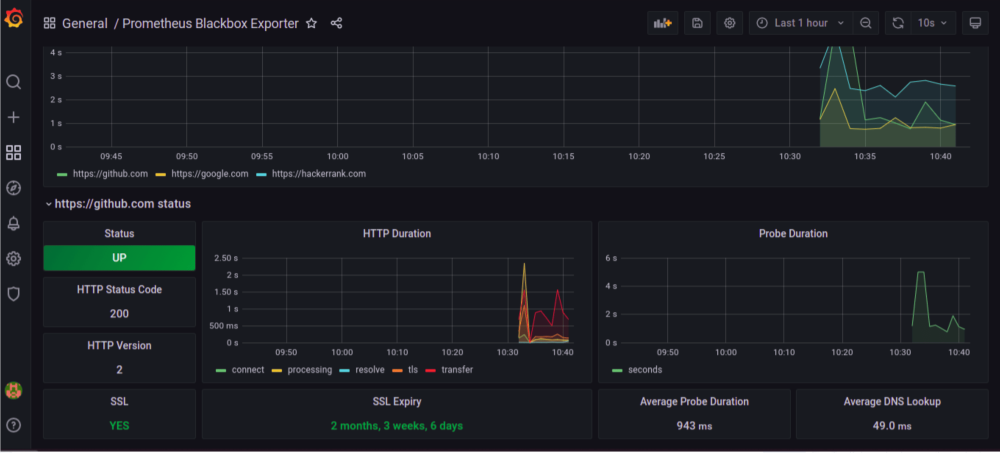
Website Monitoring
 Credit: @ChandramohanJagtap
Website monitoring is essential for improving awareness of your website's performance and availability. For our first example, this web performance monitoring dashboard uses Prometheus behind the scenes for metrics ingestion. In terms of metrics, this dashboard displays requests made in the last hour, HTTP duration as well as uptime status and SSL certificate expiry within a single dashboard.
Monitoring Use Container Engine for Kubernetes (OKE)
 Credit: @AliMukadam
Monitoring OKE with Prometheus provides users with essential monitoring of the health and performance of Use Container Engines for Kubernetes.
If you want to get started with creating your own Prometheus backed dashboards for managing Kubernetes? Then why not speak to one of our team about our beta managed Prometheus platform here.
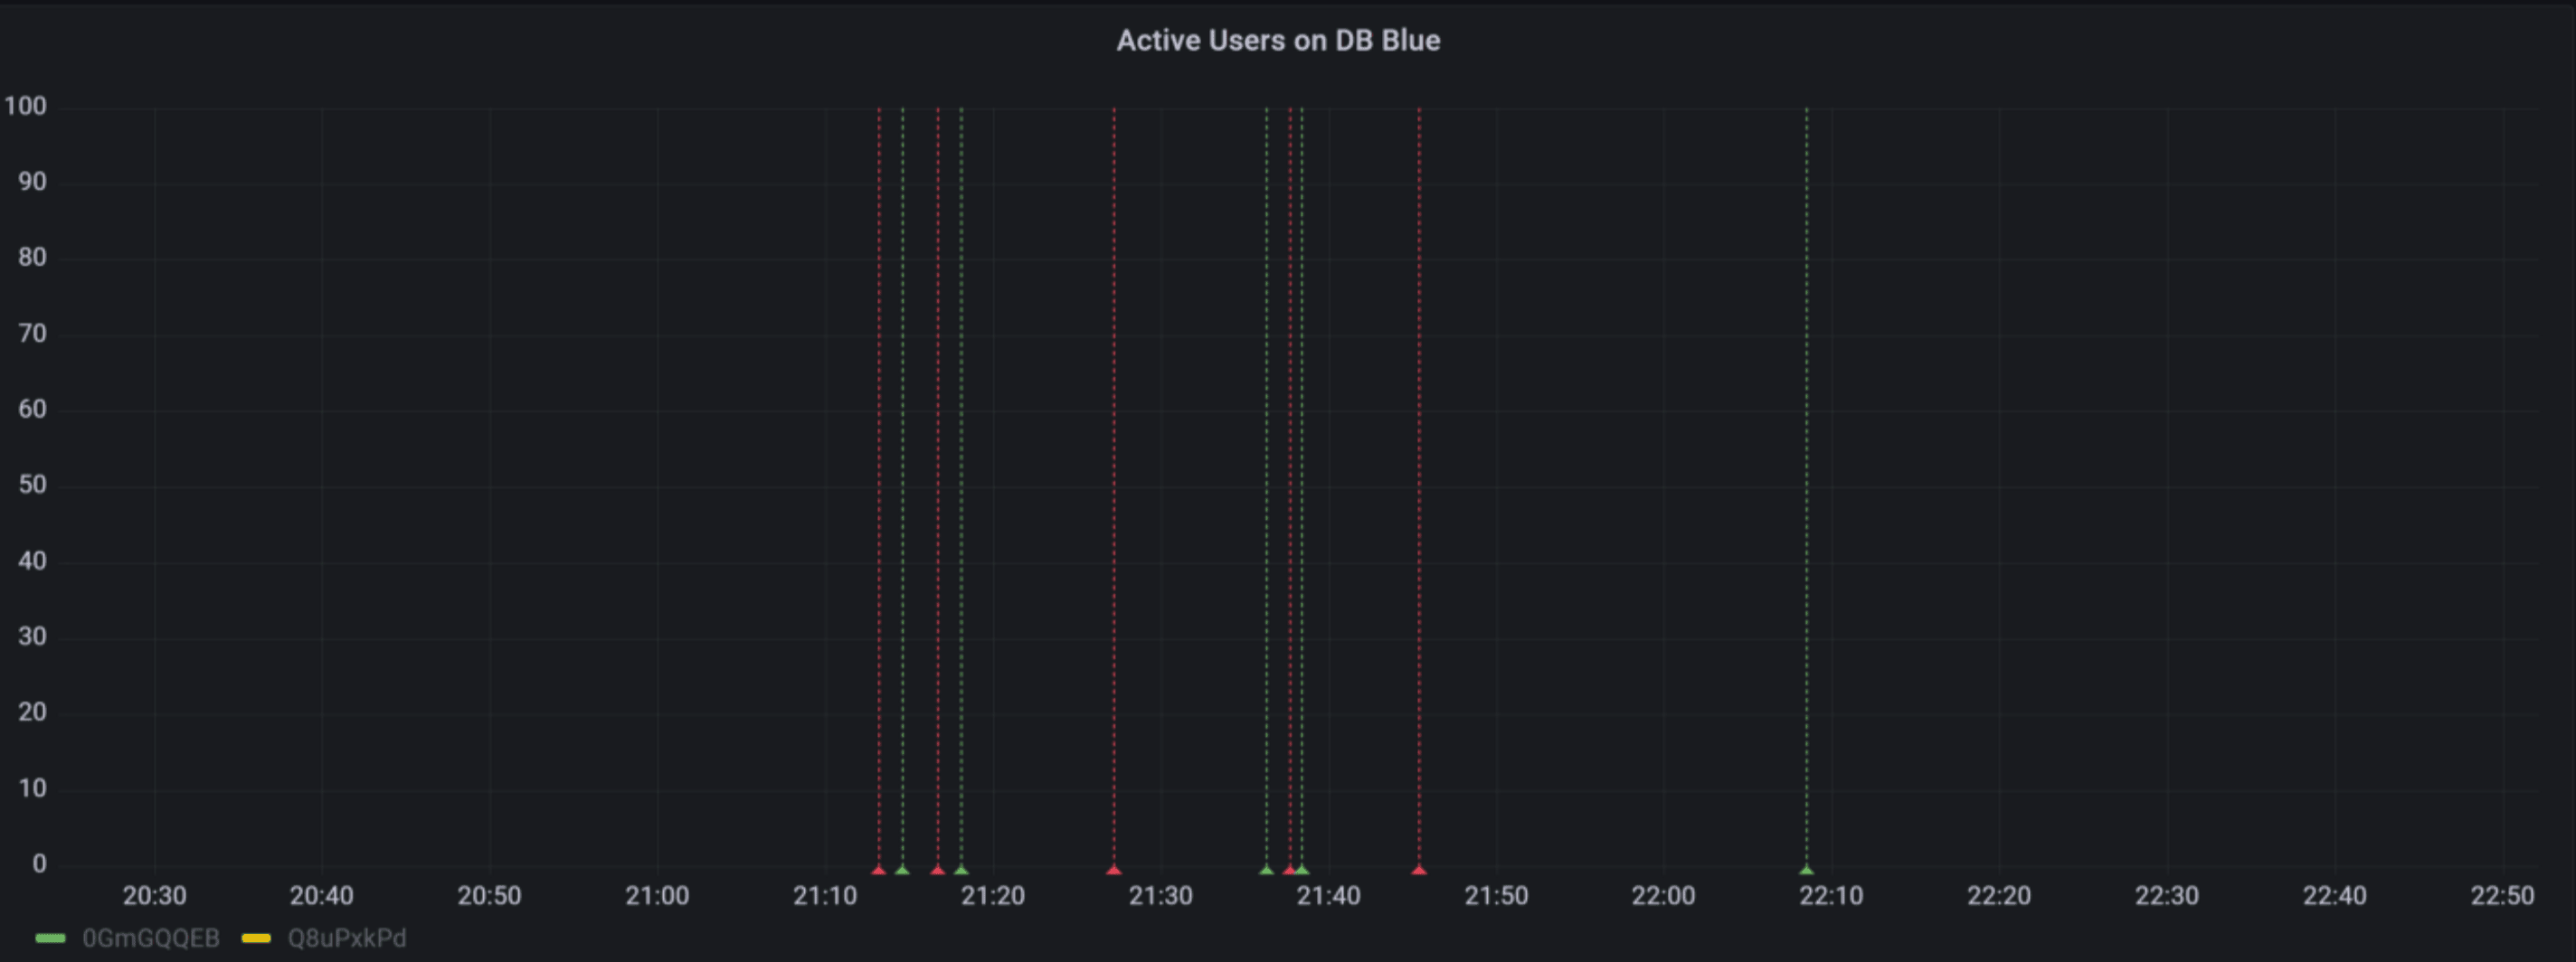
Tracking Active SSH Sessions
 Credit: @StefanPfaffel
This Grafana dashboard uses Prometheus to monitor all active user sessions. By proactively monitoring SSH sessions, users can spot the first events generated by an attacker gaining access to their servers.
Unlock complete visibility with hosted ELK, Grafana, and Prometheus-backed Observability
Start Free TrialMonitoring Spring Boot Applications
 Credit: @VishnuMV
Spring Boot is an open-source Java framework that has its primary use case dedicated to the creation of microservices. This Prometheus backed dashboard provides a reliable monitoring system for Springboot application monitoring and requires some knowledge of running Docker and Java to get started.
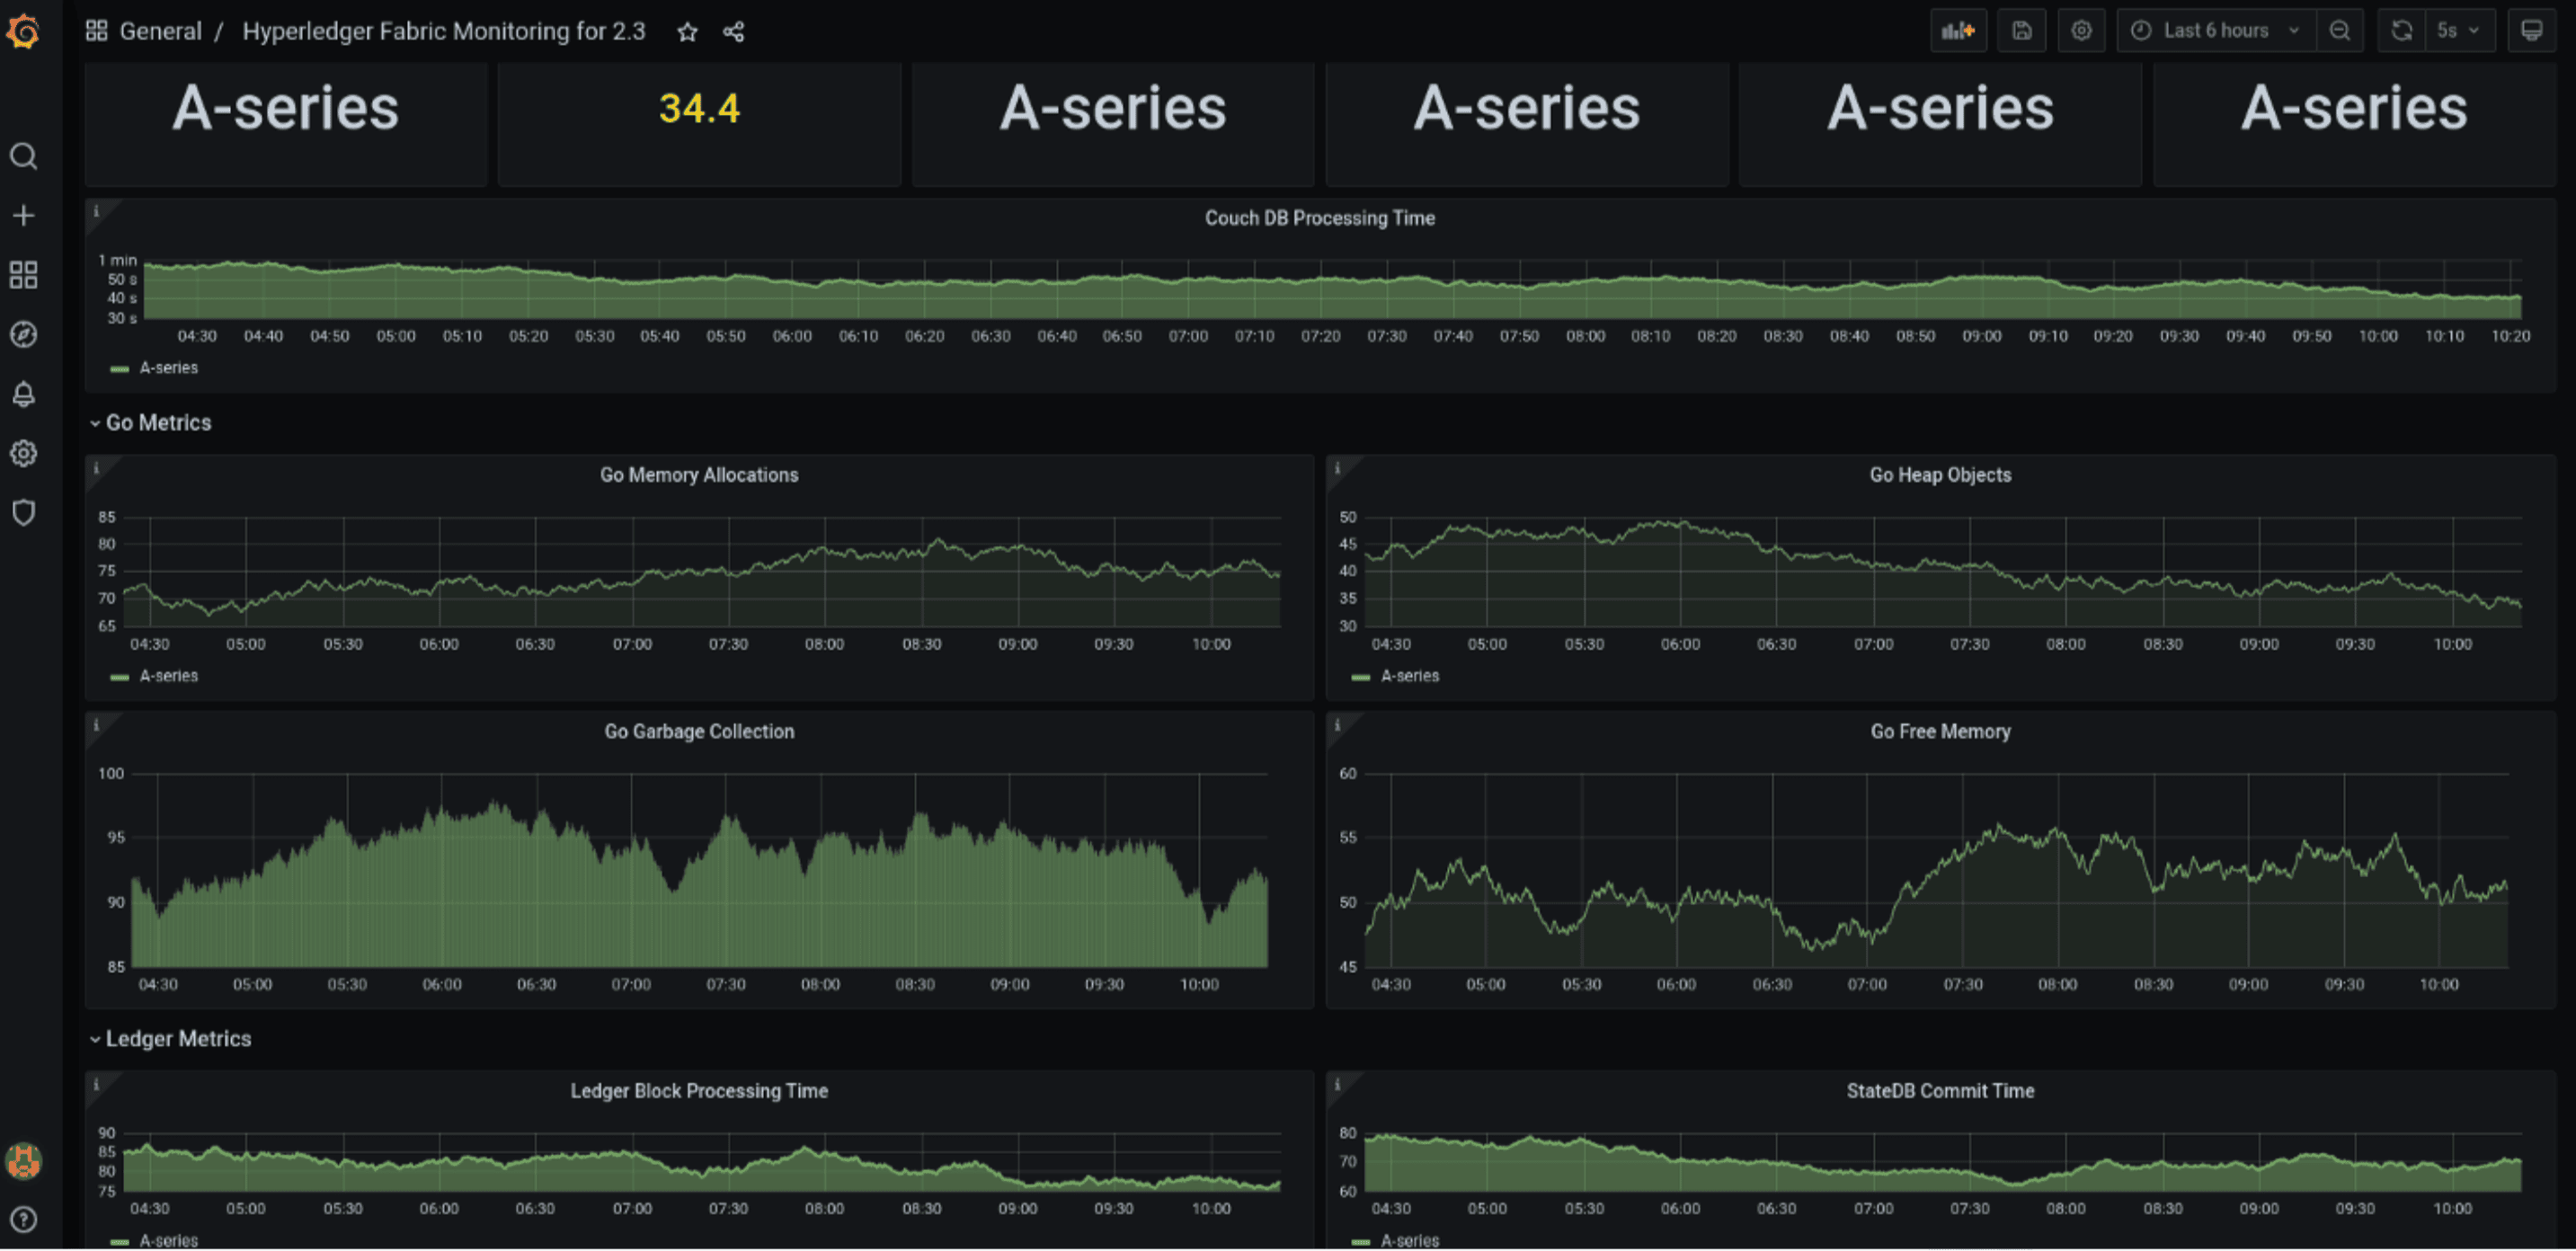
Hyperledger Fabric Network Monitoring
 Credit: @ChandramohanJagtap
Hyperledger Fabric offers a blockchain framework that can be used as a foundation to create blockchain-based solutions and applications. By monitoring your deployed Hyperledger applications with Prometheus and Grafana you can perform health checks, observe the status of garbage collection, overall free memory and see existing memory allocation.
Monitor Azure Kubernetes Service (AKS) Infrastructure
 Credit: @RenjithRavindranathan
Azure Kubernetes Service (AKS) is a container orchestration service based on K8s that is available through the Azure public cloud. Monitoring the infrastructure of this managed service (as demonstrated by this dashboard) is needed to provide performance monitoring and highlight insights necessary for the optimisation of container health.
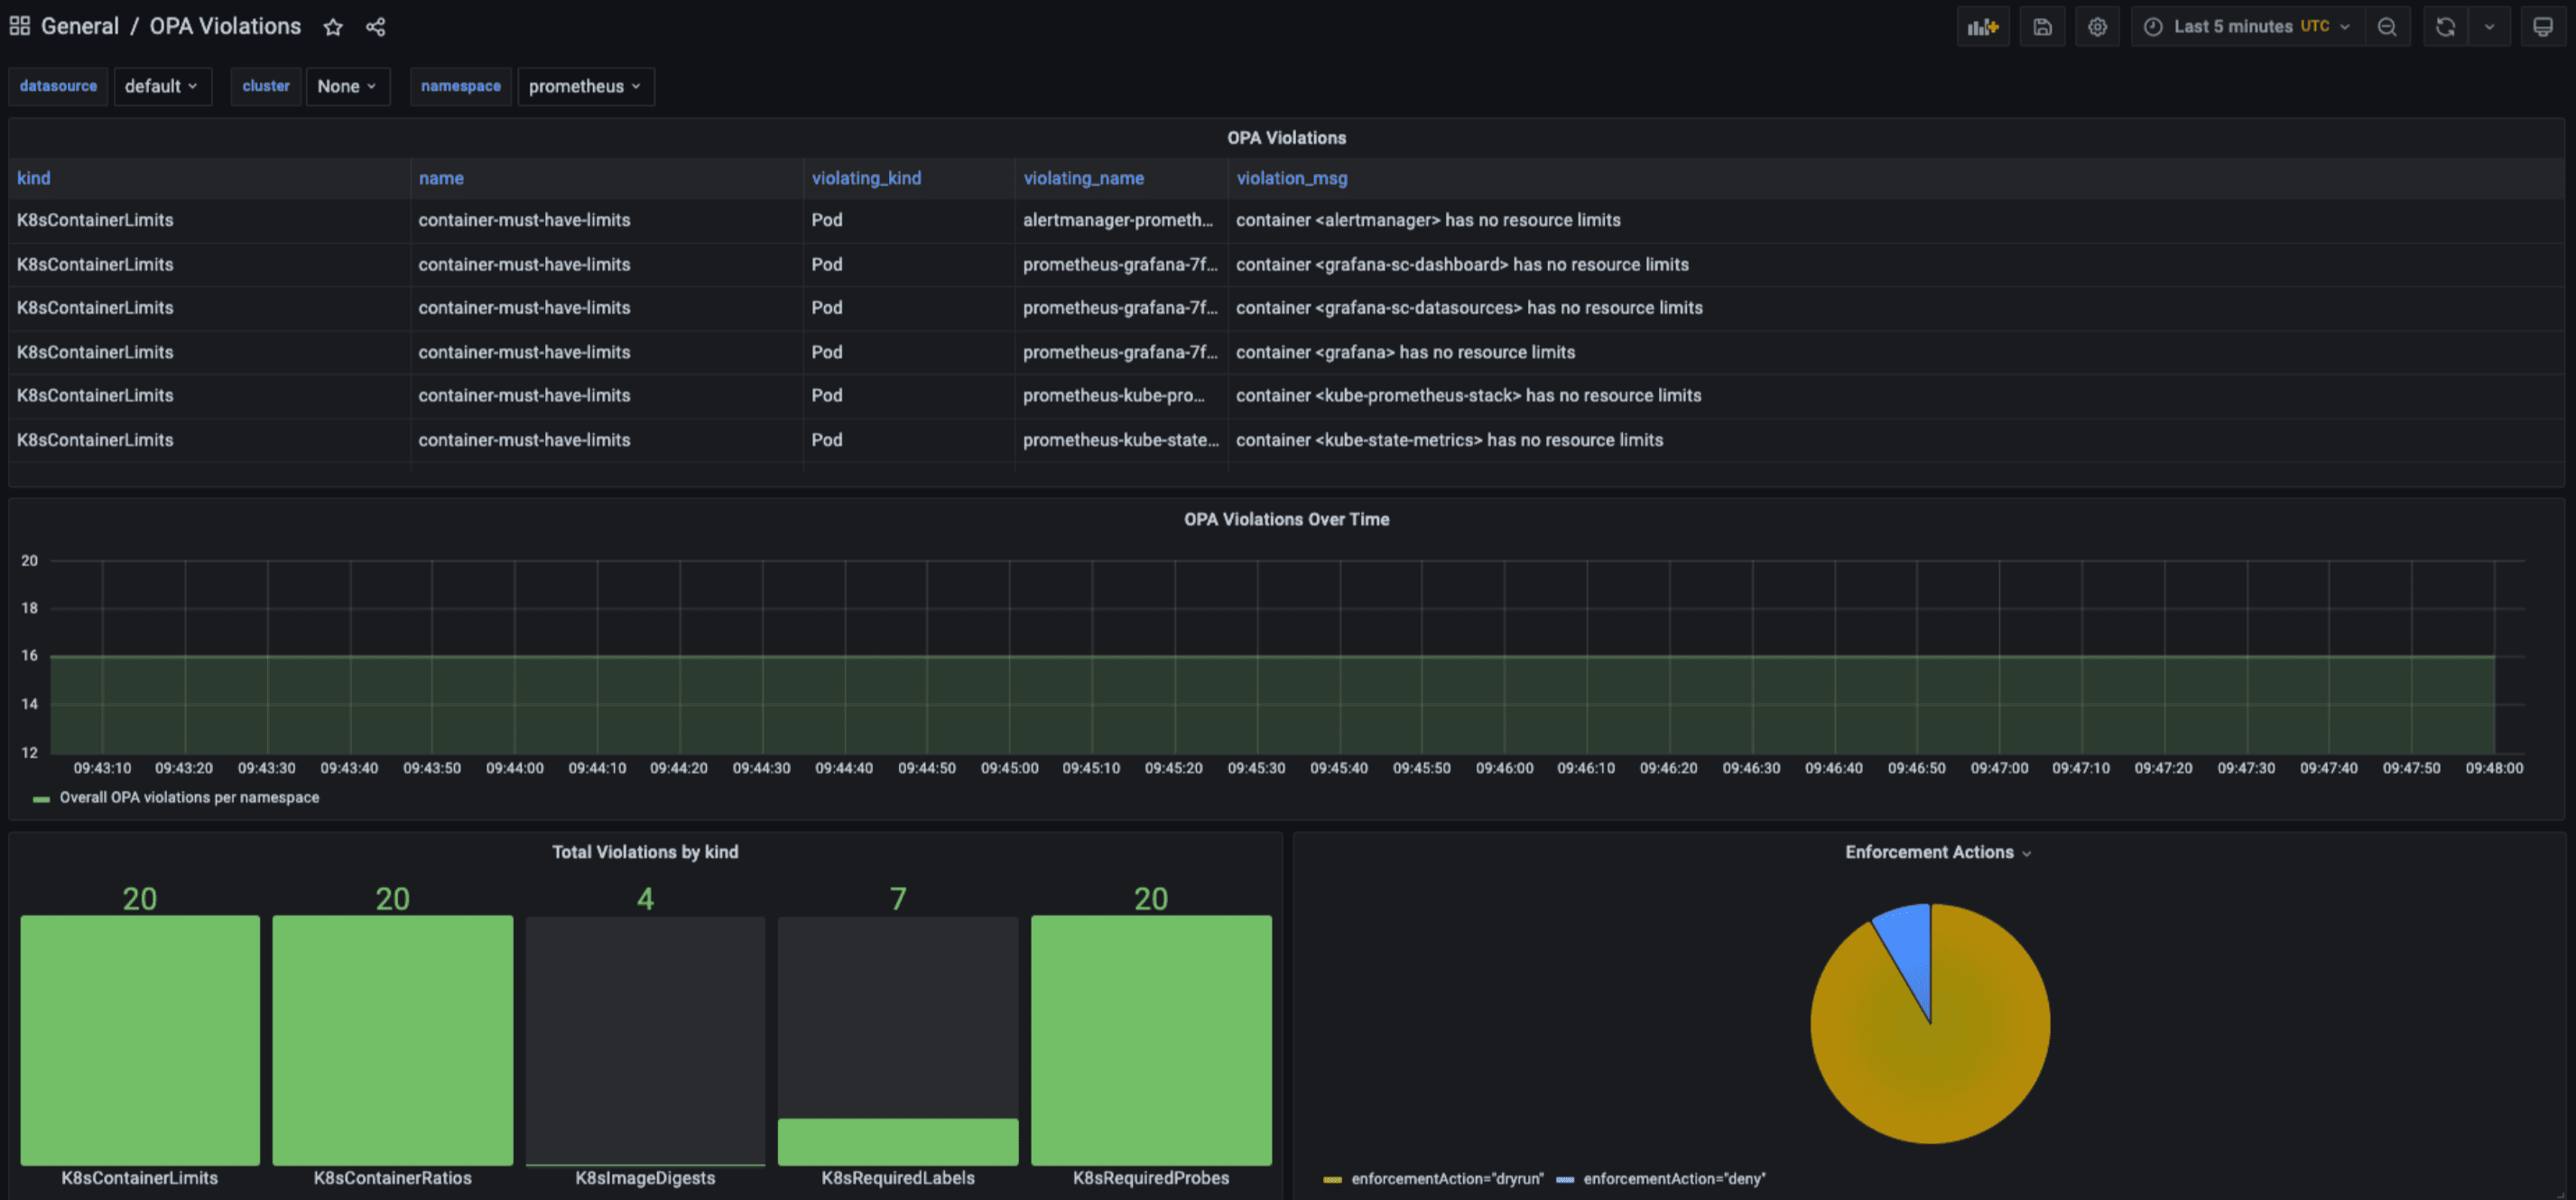
Surface Open Policy Agent Violations
 Credit: @MuratCelep
Open Policy Agent (OPA) is an open-source tool that is primarily used to enforce unified policies across a variety of different technology stacks. The next visual we’ve selected for this article displays key information about constraint violations in order to improve the resiliency and performance requirements essential to running Kubernetes platform deployments.
MySQL Insight Reporting
 Credit: @LisandroCardoso
MySQL is an open-source relational database management system that runs across the vast majority of operating systems to organise data into multiple tables and show which data types might be related to each other.
By monitoring MySQL closely you can be the first to identify unauthorised user access attempts against your system. This dashboard notably displays top users by bytes in and also shows the number of connections created by a user.
Windows Server Dashboards
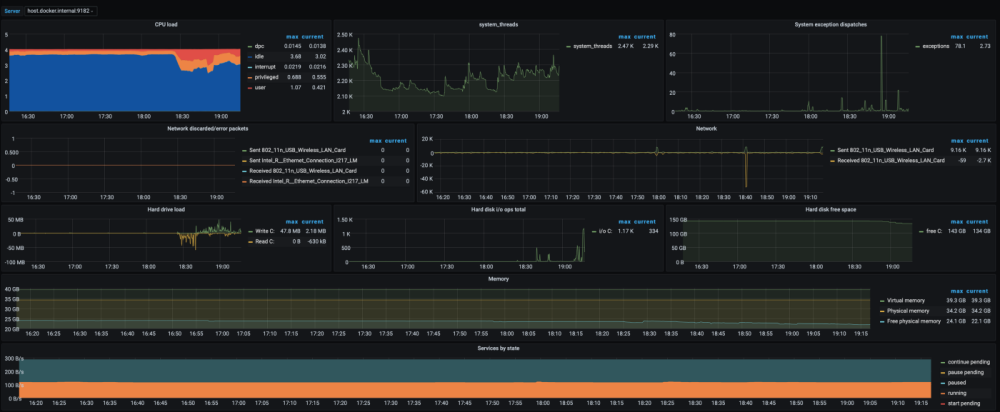 Credit: @VytasPrazarkevicius
Windows server monitoring provides end to end monitoring that displays time-series metrics associated with both operational and performance status to the dashboard owner. This Prometheus backed Grafana dashboard readily displays data regarding CPU, system threads and memory associated with your Windows Server.
Kubernetes Microservice Monitoring
 Credit: @SumitSrivastava
Kubernetes microservice monitoring is key to uncovering dependency mapping, anomalies and the status of other key performance metrics. This visualisation uses the Prometheus exporter for Redis to scrape the server locally and supports a number of additional annotations to enable fine control of scraping.
Tracking Linux Server Performance
 Credit: @SibiSaravanan
Linux server monitoring is required to provide visibility of the time series metrics associated with CPU and disk usage, I/O, memory consumption and other key processes.
As well as using Docker, Prometheus and Grafana, this dashboard is also powered by running an additional Nginx container which functions as a reverse proxy that routes traffic internally.
HAproxy Reporting Dashboard
 Credit: @LinuxTechLab
HAProxy is an open-source load balancer and is also the de-facto proxy server powering many of the web’s largest sites.
This highly detailed HAproxy monitoring dashboard hosts a variety of data visualisation charts to display whether your backend is up or down, the number of responses by HTTP code and total sessions as well as total requests and responses.
Pi-hole Tracker
 Credit: @VComposieux
Pi-hole is a network-level internet tracker and advertisement blocker which works as a DNS sinkhole when used on private networks.
This dashboard for Pi-hole monitoring is hosted by Grafana's gallery you are free to simply copy the ID to your clipboard to get started with launching this report locally to these visualisations built out using your own data.
Monitor Home Energy Expenditure
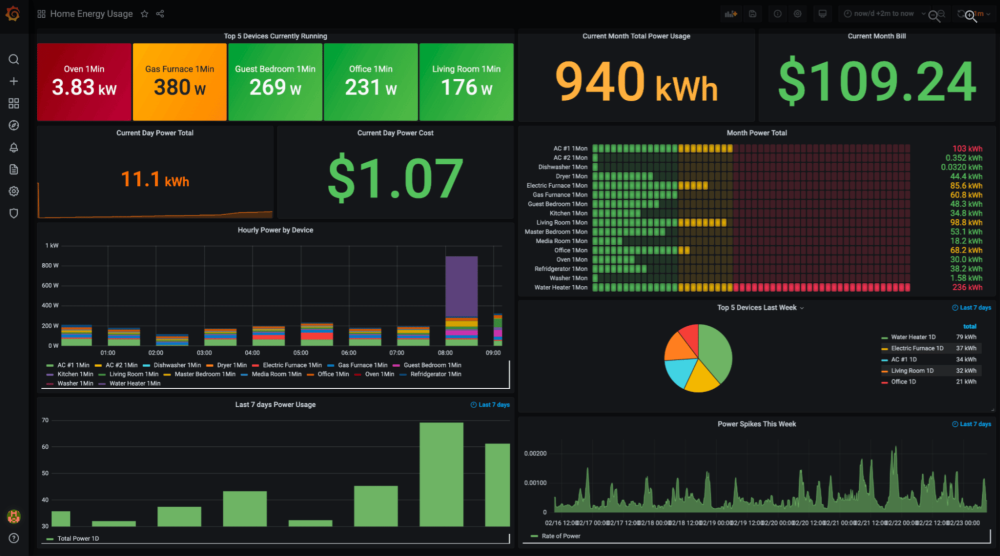
Credit: @SCGrafana
This unique method of measuring household energy consumption uses Raspberry PI and Grafana in conjunction with Prometheus as a Service to allow the user to identify energy cost split out per room and device.
With the rising cost of energy, there are going to be many engineers that we think will find this Prometheus dashboard particularly valuable in the coming months.
Have a unique Prometheus backed dashboard that you would like to see us include in the next update of this article? Then feel free to get in touch with your idea via email at [email protected].
If you enjoyed this post then why not check out our previous guides on the leading Grafana dashboard examples or our previous post on the best Kibana dashboards examples?