
ELK, Log Management, Logstash, Resources
10 min read
Last updated:
If you have any experience with comparing open source data visualisation tools then it is very likely you will have encountered both Kibana and Grafana during your research and discovery phase.
As two of the most popular solutions for logs and metrics analysis, it can be difficult to distinguish between the two and make the choice to use either Grafana or Kibana depending on the analysis task at hand.
In this guide we’ll be pitting these two tools against each other to help you make the decision on which solution will form the backbone of your reporting, alerting and monitoring activities.
Contents
What is Kibana?
Kibana is an open-source data visualization and exploration tool that is primarily used for interacting with and visualizing data stored in Elasticsearch. It provides a user-friendly web-based interface for users to perform the following tasks data visualisation, data creation, data exploration, and many more.
Kibana Uses
Kibana is most commonly used for log analysis as it can easily use log files created by a vast array of applications, services and servers to build interactive reporting dashboards and data visualisations.
Kibana forms a key part of the ELK Stack, being the K that makes up ELK, alongside Elasticsearch and Logstash.
The most common use case for Elasticsearch and ELK is for log management but there are many additional underutilised use cases for Kibana including its data visualisation capabilities for compliance auditing, business intelligence, sales reporting, marketing analysis, and IT operations monitoring.
Kibana can display both metrics and log data as visualisations in a wealth of different formats such as charts, tables, maps and graphs which can be combined into exhaustive reporting dashboards that dynamically update.
Get started with learning about how to use Kibana with our helpful Kibana cheat sheet that covers all the Kibana search examples you’ll need.
What is Grafana used for?
Grafana is an open-source, web-based data visualization and monitoring tool used to create interactive and customizable dashboards for various data sources. It is primarily employed for monitoring and observability, data visualisation, alerting and notifications, and more.
Grafana Uses
Grafana originally started life as a fork of Kibana (much like Open Dashboards is doing). Grafana is one of the most popular open-source tools for metrics analysis due to its proficiency in visualisation, monitoring and alert creation. It can be used as a standalone piece of analytics software or used in tandem with services such as Loki and InfluxDB.
Grafana allows you to use a variety of charts, graphs, and tables in order to make it easier to share the key takeaways of metrics reporting for cross-team collaboration among your engineers.
Grafana is often used together with Graphite and Prometheus due to their complementary attributes that further enhance Grafana’s ability to display and report on metrics.
Who Wins The Popularity Content?
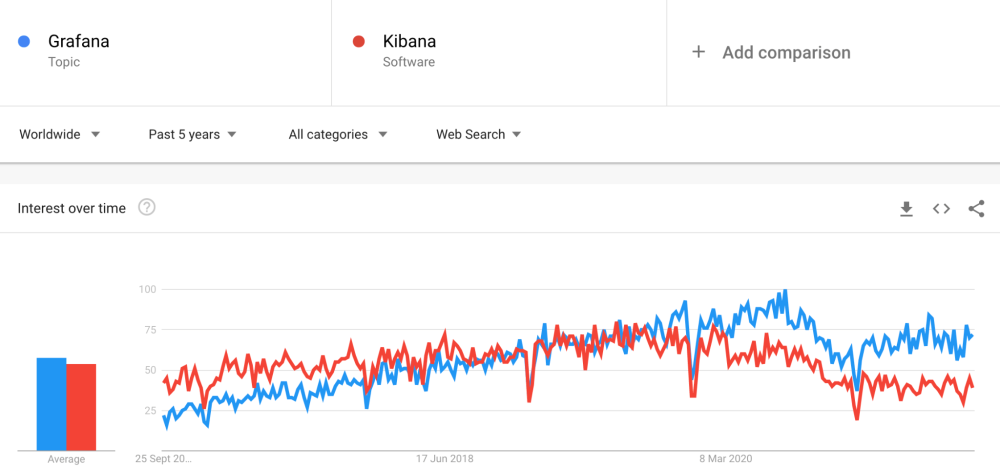 We can conduct market analysis by using Google Trends to compare Grafana against Kibana to see their global popularity over the past five years. When we do this we can see that Grafana has taken over Kibana for global popularity.
However, this isn't the full story as we can see that when we factor interest by Country into the mix that many countries still prefer to use Kibana and may even display a 50/50 split in preference between the two data visualisation tools.
The leading countries that express more of an interest in Grafana over Kibana are Russia, Norway, Germany, Brazil and Austria.
The United States, Vietnam and South Korea all express an equal preference between these two data visualisation solutions.
The leading countries that express more of an interest in Kibana rather than Grafana are Japan, Peru, India, the United Arab Emirates and the Philippines.
In Ahrefs if we want to see more accurate numbers on the sheer amount of people searching for each tool monthly we can see that Grafana takes the lead with 188,000 global searches per month over Kibana's 114,000 global searches per month.
Github’s metrics also support the notion that Grafana is the tool with a wider rate of adoption as there are currently 5.63K Github forks and 29.7K stars on the platform for Grafana in comparison to Kibana’s 4.8K GitHub forks and 12.4K GitHub stars.
Regarding Gitlab repositories, in terms of popularity, there are 792 results returned for Grafana in comparison to Kibana which shows 126 results returned when an entire site search is performed for these two terms.
Last but not least, we can also review Stackshare’s approval ratings which state that Kibana has a broader approval on the site as it is mentioned in the technology stacks of 907 companies; compared to Grafana, which is only listed in 577 technology stacks.
Disclaimer
In the process of writing this article, we wanted to acquire as many experiences and sentiments as possible from developers, engineers and other technology leaders to help inform the reader which solution might be the better choice for your next data analysis project.
The following insights in the next two sections have largely been sourced from technology forums, threads and comment sections of users who have experience using both Kibana and Grafana.
Common Reasons Why Some Users Prefer Kibana
“I find that the global free-text search functionality is very useful in Kibana, for me it is one of the main reasons to have data in an index database in the first place and Grafana does not provide support for this out of the box.” - Anonymous IT Leader
“Kibana is my go-to tool of choice because I personally find that Grafana looks like an amateur solution that appears more crammed when displaying multiple visualisations. Kibana’s recommendation by CERN also played into my decision behind choosing Kibana as our corporate tool for data set analysis.” - Anonymous Developer
*“I prefer to use Kibana primarily because it ships with the rest of the Elastic stack. While I don't find it as powerful as some proprietary solutions it is light years ahead of manual analysis of individual log files.” *
“When I previously used Grafana I found it to be annoying as it was a separate tool to maintain external to the rest of the Elastic Stack, in the end, we were able to meet all our requirements by using Kibana.” - Anonymous CTO
Common Reasons Why Some Users Prefer Grafana
“You can easily use Grafana for data visualisation if you don’t need the rest of the ELK Stack. You will still have access to many data sources and plugins to assist you as well as the support of extensive documentation.” - Anonymous DevOps
“I tend to prefer Grafana over Kibana for the following few reasons. By using Grafana I can easily overlay numerous specific data sources within the same chart - for example, data on CPU metrics on top of log data for Apache.”
“I also often make use of Grafana’s feature for adding annotations. Overall for our particular use case, these features help make Grafana a more powerful solution when compared to Kibana.” - Anonymous Developer
“I love using Grafana as my go-to metrics visualisation tool because without a doubt it is the best way to visualize and report on metrics.” - Anonymous System Administrator
Another benefit of out of the box Grafana is that the solution is currently open-source. As of version 7.11 and onwards Kibana is no longer available as open-source because of Elastic’s choice to release all future editions of the ELK Stack under SSPL licensing.
Grafana Vs Kibana
If we look at a scenario using Elasticsearch and Grafana in comparison to Elasticsearch paired with Kibana for data visualisation we will find weaknesses on Grafana’s end when we need the application to dynamically take context into consideration, as you can see in this helpful comparison here.
When comparing the combination of Elasticsearch and Grafana to Elasticsearch and Kibana we will shortly find that we are unable to search logs with keywords or with precise search terms from context.
If Elasticsearch is replaced with Loki in the previous scenario then the user will be able to search logs via those criteria. Loki is sometimes cited as a lightweight alternative to the ELK Stack which makes sense when the previous context requires enabling the user with the ability to conduct full-text data querying.
On the other hand, the pairing of Elasticsearch and Kibana will be unable to create alerts from aggregations and does not have user account access controls out of the box (this can be remedied by using a managed solution such as Logit.io) in comparison to using Grafana.
The combination of both Elasticsearch and Kibana and Elasticsearch and Grafana will be found to be either equally as strong or near equally as strong for the following tasks: parsing, taking context into consideration for older logs, visualising logs with graphs and being able to create graphs in general.
Since March 2021, Grafana added Elasticsearch to its list of official data sources making this integration considerably easier to implement for engineers that had been hacking around to get this solution in previous years.
Why Choose When You Can Have Both?
Whilst we saw feedback from engineers that enjoyed using Kibana over Grafana or vice versa we saw many more commenters that agreed that looking at Kibana and Grafana as competing tools may be entirely the wrong way to look at your data visualisation choices.
Many users tend to agree that you can’t draw a direct comparison between Grafana and Kibana as they are commonly used to serve different purposes. Engineers often chose to opt to have the best of both worlds by choosing to use Grafana for monitoring and managing metrics whilst also using Kibana for the management and analysis of log data.
Some other users also used both solutions for monitoring a single project side by side, e.g. Homelab monitoring.
As both of these tools have different strengths, we fully endorse that you take the necessary time to find a combination of the features that work best for you to get the most out of reporting, monitoring and fully improving your operational observability to be the best it can be.
As both Grafana and Kibana are rated as being virtually neck and neck in their ability to visualise data this will likely not be a concern during your solution research process.
A more likely reason for selecting one tool over the other is based on their respective ability to integrate with your data source of choice. You are more likely to guarantee cross-compatibility between monitoring and managing data from different sources if you use both Grafana and Kibana side by side.
One of the primary reasons that users who wish to self host their logging and metrics management tools might feel forced to pick Grafana over Kibana or vice versa is due to resource requirements, difficulty to maintain scale across multiple analysis solutions and the time required for tuning and upgrading your technology stack with consistency, especially for those working in enterprise-level environments.
A managed service on the other hand allows you to send your data to Kibana and Grafana and create your first reporting dashboards within minutes!
Logit.io provides all of our users with the ability to launch fully managed Grafana and Kibana side by side so that you can experience the best of both solutions without having to compromise and pick one over the other.
Launch Grafana and Kibana backed data visualisations and reports within minutes free for the first 14-days, no credit card required with Logit.io.
We hoped that you enjoyed this article comparing Kibana vs Grafana, if you enjoyed this article then why not check our other blogs on the best examples of Grafana dashboards & Kibana visualisations?