How To Guides, Resources
8 min read
Last updated:
Filebeat is a straightforward log shipper that enables you to begin logging, rapidly. With observability solutions like Logit.io, this can be achieved in as little as 5 minutes, following our integration guide. To understand more about using Filebeat with Logit.io, this article will define what it is, how it works, and how to integrate Filebeat with Logit.io to ship logs from local files to one or more destinations.
Contents
What is Filebeat?
Filebeat is an open-source, lightweight log shipper from Elastic and a part of the ELK Stack. This tool is specifically designed to collect log data efficiently from sources such as files, servers, and services. Filebeat facilitates log sending at a central location enabling users to conduct analysis and visualization at Elasticsearch or Logstash.
How Filebeat Works: Overview and Architecture
Filebeat works by monitoring the predefined log files or directories, reading the new data, and sending it in real-time while being lightweight on the host system where it runs. It is most useful in aggregating logs in a distributed environment, hence making log management and analysis seamless. To understand how Filebeat works in more detail, we will discuss its architecture and how numerous components work together to facilitate the shipping of logs.
Filebeat Configuration
- Installation: Filebeat is installed as a lightweight agent on your servers. It's configured through a YAML file, where you specify the log files or directories you want to monitor.
- Inputs: You define inputs in the configuration file, telling Filebeat which files or directories to monitor. This can include logs from applications, system logs, or custom log files.
Harvesters
- Monitoring Log Files: Filebeat spawns a harvester for each log file it monitors. The harvester is responsible for reading the content of the log file line by line.
- Tracking State: Each harvester maintains the state of a file; for example, the last read position. This allows Filebeat to continue exactly where it left off after a restart and without skipping any data.
Spooler
- Buffering Data: The harvester sends the gathered log data to a spooler, a buffer to which data is temporarily sent. This spooler collects data over some time and batches it to optimize network transfer.
- Batching: Filebeat batches the log data, reducing the overhead of network communication and improving performance by sending data in chunks.
Publishing
- Outputs: After event data is spooled, Filebeat will send it to the configured output destination. The main outputs available are:
- Elasticsearch: The logs are written directly to Elasticsearch and thereby indexed to make them searchable and viewable with Kibana.
- Logstash: This sends logs to Logstash, which may perform additional processing, filtering, or enrichment before sending it out to Elasticsearch or any other destination.
- Other Outputs: Other outputs Filebeat can support are Kafka, Redis, or directly to a file, depending on your architecture and requirements.
Modules
- Pre-built Integrations: Filebeat is assembled with modules, which makes setting up easier since these modules represent collections of the preconfigured input, configuration, and visualizations.
Load Balancing and Resilience
- Load Balancing: If multiple output destinations are configured, like multiple nodes of Elasticsearch, then Filebeat can perform load balancing of the log data across those nodes to effectively utilize resources.
- Resilience: Filebeat is designed to handle failures in the network segment gracefully, such as reimplementing failed transmissions to avoid data loss.
Monitoring and Security
- Centralized Monitoring: Filebeat can be centrally monitored through Hosted Kibana from Logit.io, giving you insights into the agent's performance, errors, and the volume of data being shipped.
- Secure Transmission: Filebeat provides SSL/TLS encryption of data sent to Elasticsearch, Logstash, or any other destination. Besides this, authentication mechanisms can be configured so that only authorized agents can send data.
Filebeat Modules
Filebeat modules are a key component of Filebeat offering numerous advantages, hence this article will discuss this feature in more detail. Filebeat offers pre-built configurations and integrations within Filebeat called modules, they simplify the collection, parsing, and visualization of common log formats. Instead of manually configuring Filebeat to handle various types of log formats, Filebeat modules provide out-of-the-box solutions tailored for specific software or services.
Depending on which Filebeat source integration you are following, Logit.io’s detailed guides will provide the instructions for enabling the specific module. For example, for the Auditd logs source integration, we show you how to configure Filebeat using pre-defined examples, including enabling the Auditd Filebeat module, to start sending and analyzing your Auditd application logs.
Common Filebeat Modules
- Auditd: The Auditd module collects and parses logs from the audit daemon
- AWS: Gathers logs from various AWS services, such as CloudTrail, CloudWatch, and VPC Flow Logs.
- ElasticSearch: Collects logs generated by Elasticsearch nodes, useful for monitoring and troubleshooting.
- Kubernetes: Gathers logs from Kubernetes clusters, such as container logs and system logs.
- MySQL: Collects logs from MySQL databases, including slow logs, error logs, and general logs.
Most Filebeat modules come with pre-built Kibana dashboards. These are typically specific to the log data type the module collects and immediately provide insight into the systems being monitored. Rather than having to create custom visualizations from scratch, users can immediately begin with these ready-made dashboards to monitor key metrics and trends.
Additionally, Filebeat modules include built-in ingest pipelines that automatically parse and structure log data. This means logs get normalized and enriched with valuable metadata before they reach a centralized repository. Because these modules rely on standardized pipelines, variability and errors from manual parsing configurations are removed from the equation when working with Filebeat modules.
Lastly, while the out-of-the-box configurations are provided by Filebeat modules, they are also highly customizable. A user can edit the default settings of the module for their needs such as an input path adjustment, modification to parsing rules, or even adding additional fields. It means these modules can be used in specific environments with edits, thus making the initial installation easy. Advanced users can extend the existing modules or write their own, this way, it's guaranteed that Filebeat will be able to reach any log source not covered by the default modules.
Logit.io Log Management with Filebeat
Logit.io is a powerful observability platform, with a comprehensive log management solution. Log management from Logit.io makes the process of data analysis, reporting, and alerting on critical performance issues far less tedious, time-consuming, and expensive than typical log management solutions. The solution offers Hosted Logstash for data processing and Hosted Kibana for powerful visualizations facilitating enhanced analysis. However, to begin gaining from the platform you need a simple and quick method for sending your logs to Logit.io. If your logs are on local files then Filebeat is the perfect option, due to its reliability & minimal memory footprint.
Follow our detailed Filebeat configuration guide to begin sending your logs to Logit.io, if you encounter any issues with this process or want to find out more about Logit.io’s log management solution, feel free to contact us or begin exploring the platform for yourself with a 14-day free trial.
Filebeat Configuration
Configuring Filebeat to be used with Logit.io is simple. Our in-depth documentation outlines easy-to-follow steps that enable you to effectively configure Filebeat to ship logs from local files to one or more destinations, including Logstash. The integration article outlines configuration guides for Windows, Linux, macOS, DEB, and RPM, so irrespective of your operating system you’ll be able to quickly begin using Filebeat with Logit.io.
Visualize Files and Log Data in Logit.io with Filebeat
Logit.io provides extensive visualization capabilities via its numerous open-source tools as Hosted solutions, including Hosted Kibana, Hosted OpenSearch Dashboards, and Hosted Grafana. This offers you enhanced flexibility for in-depth analysis and monitoring of your files and log data shipped via Filebeat.
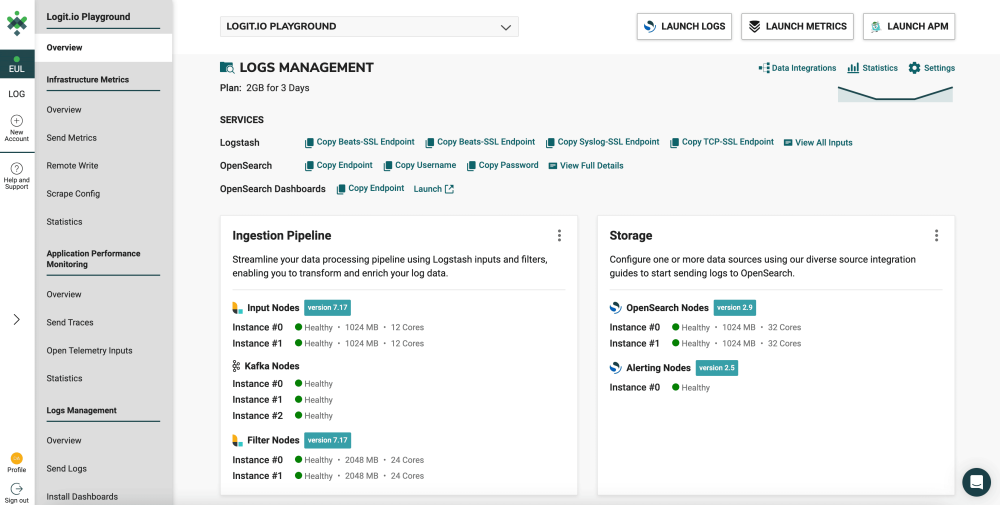
Once you've configured Filebeat to send files and log data to Logit.io, you can access and view these logs, along with their details, directly from the initial dashboard. To begin with ‘visualizers’ for logs shipped via Filebeat, it's recommended to use OpenSearch Dashboards, which you can easily launch from the 'Logs Management' page.
- Launch Logs: From the initial dashboard, select ‘Launch Logs’ at the top right of your screen or ‘Launch’ next to OpenSearch Dashboards.
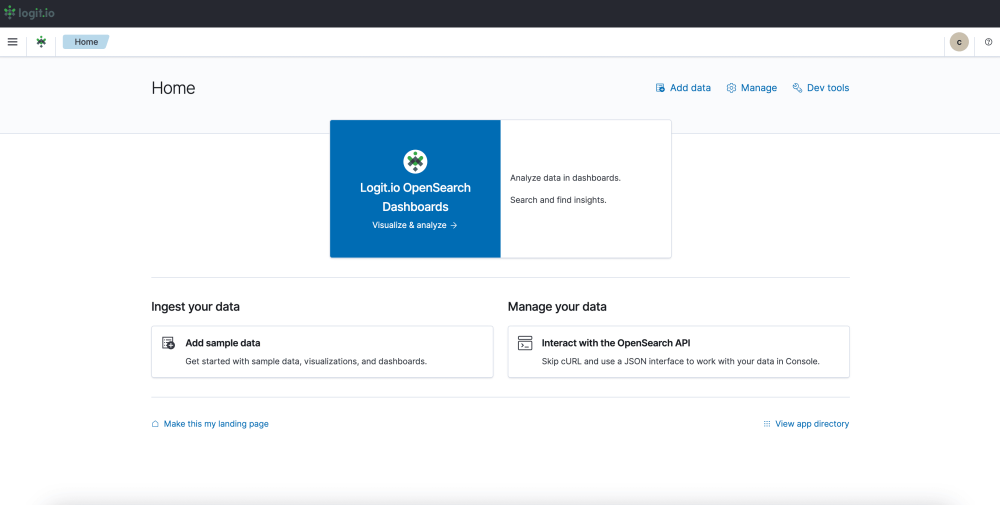
- OpenSearch Dashboards: After selecting ‘Launch Logs’ or ‘Launch’ you will arrive at the OpenSearch Dashboards welcome page. As you have already configured Filebeat to ship files and log data to Logit.io, from here, select ‘Visualize & Analyze’.
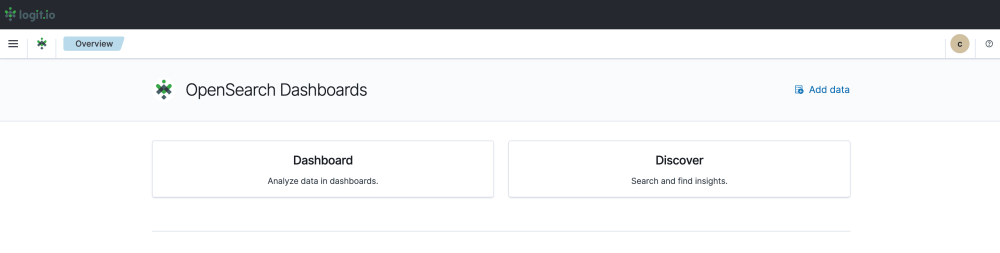
- Visualization Options: From this page, you can choose either ‘Discover’ which allows you to search through your data to find insights, or ‘Dashboard’ which allows you to analyze your data in dashboards. For this guide, we will select, ‘Dashboard’.
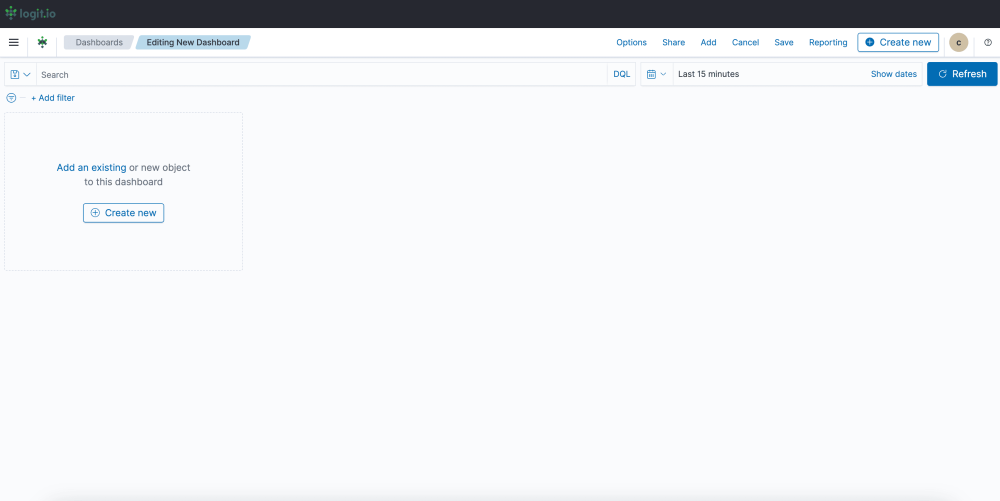
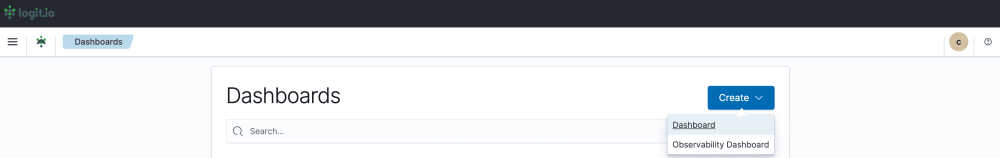
- Create a Dashboard: After selecting ‘Dashboard’ you now need to select ‘Create’ towards the right of your screen and ‘Dashboard’ from the dropdown menu.
- Editing and Saving a Dashboard: From this page, you can edit your dashboard by adding existing panels and objects or creating new ones. To create a new object select ‘Create New’ from the left of your screen and choose your preferred data presentation type for viewing logs. Once you’ve added all the objects you desire, click ‘Save’ in the top right. Now you can visualize your logs sent via Filebeat in Logit.io.