
Resources
6 min read
Monitoring the health and performance of IT infrastructure is crucial for practically all organizations to ensure the reliability, availability, and efficiency of an organization's technology environment. By continuously tracking servers, network devices, applications, and services, organizations can promptly detect and address issues before they escalate into significant problems and impact customers.
The importance of this process has led to organizations utilizing the leading monitoring tools to enhance their operations. A common choice for this practice is Nagios. Nagios is a powerful and versatile monitoring solution that helps organizations ensure the reliability and performance of their IT infrastructure. Its comprehensive monitoring capabilities, coupled with flexible alerting and extensibility, make it a popular choice for businesses seeking robust infrastructure management.
However, not all users are convinced by Nagios’ offerings and are looking at other options. So to assist users with this, this article will first outline the advantages and disadvantages of Nagios, and then list the leading Nagios alternatives.
Contents
Advantages of Nagios
- Monitor Numerous Devices: Nagios enables users to monitor many network devices, such as switches, routers, and servers. It assists in monitoring network performance and tracking traffic on the network interface.
- Responsive Support: Quick resolutions and a large community contributing plugins, scripts, and advice.
- Advanced Reporting and Visualizations: The tool includes robust reporting tools and customizable dashboards that assist in analyzing performance data and visualizing infrastructure health.
- Extensibility and Customization: Nagios supports a wide range of plugins and custom scripts, enabling users to tailor the monitoring system to meet specific needs.
Disadvantages of Nagios
- Cost: Whilst Nagios Core is open-source, Nagios XI is a commercial product, and licensing fees can be significant, particularly for large deployments.
- Complex Setup: Initial setup and configuration can be complex and time-consuming, especially for those unfamiliar with Nagios.
- Resource Intensive: Nagios can be resource-intensive, requiring substantial CPU and memory resources, especially when monitoring large environments.
- Maintenance: Ongoing maintenance, including updates and managing configurations, can be labor-intensive.
Nagios Alternatives
Logit.io
Logit.io is a powerful cost-effective observability platform that delivers users with a fully customized logging, metrics, and tracing solution. Logit.io can be utilized to correlate all of your infrastructure metrics to gain deeper insights, detect faults, and reduce downtime by gaining from the best-in-class open-source tools as hosted solutions. This removes the need for complex configuration and maintenance and allows you to almost instantly begin gaining the benefits from tools such as Hosted Grafana and Hosted Kibana. Logit.io allows users to maximize efficiency and streamline analysis by leveraging the centralized platform, which natively correlates your infrastructure to minimize context switching. If you’re interested in finding out more about Logit.io, feel free to contact us or begin exploring the platform today with a 14-day free trial.
Request a Demo
Want to learn more about Logit.io's powerful observability platform? Book a demo and we'll walk you through the extensive capabilities and discuss your requirements in detail.
Zabbix
The first tool included in our list of Nagios alternatives is Zabbix, an open-source monitoring solution. Zabbix offers users the ability to define smart problem thresholds and detect problem states within the incoming metric flow automatically for root cause analysis, anomaly detection, and trend prediction, as well as others. Also, the tool offers widget-based dashboards with a simple drag-and-drop placement to facilitate enhanced monitoring and analysis.
Prometheus
Prometheus is another open-source monitoring and alerting toolkit. It is designed for reliability and scalability during system and service management and monitoring. The tool helps provide a powerful multi-dimensional data model with a flexible query language, PromQL, and a Timeseries Database optimized for real-time metrics collection. The key properties of Prometheus are efficient storage, visualization through integration with Grafana, and strong alerting mechanisms provided by Alertmanager. With Logit.io you can gain all the benefits of Prometheus without the complicated and time-consuming configuration and maintenance through our Hosted Prometheus solution.
ManageEngine Site24x7
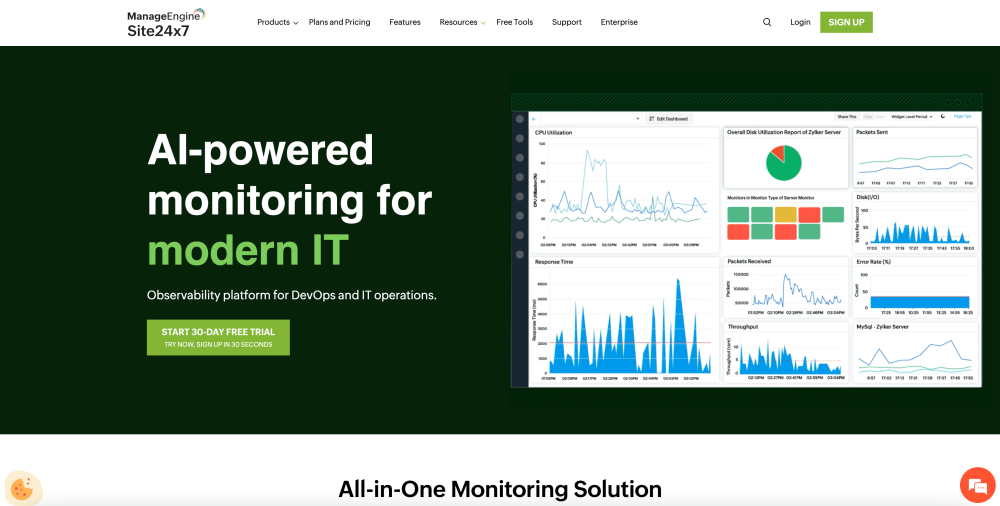
ManageEngine 24x7 is a solution for IT management, designed for monitoring IT infrastructure on a 24x7 basis. Among its features, it includes real-time performance monitoring for servers, applications, and network devices; automated alerting ensures that possible problems are brought to the notice of the IT staff as soon as possible. Configuration management, incident management, and significant reporting tools are but a few of the many features of this platform to ensure high system performance and reliability.
Netdata
Netdata is an open-source tool designed for high-resolution, real-time monitoring of servers, containers, and applications. It collects real-time metrics like CPU usage, disk activity, bandwidth usage, and website visits, presenting them in low-latency dashboards. This allows users to monitor their infrastructure in detail and in real-time. As well as this, Netdata provides high vertical and horizontal scalability while handling high data volume and velocity.
Checkmk
Continuing with our list of Nagios alternatives, the next tool is Checkmk, a comprehensive platform for monitoring applications, servers, and networks on-premises or in the cloud. The solution offers over 2,000 maintained plug-ins to collect metrics from your systems across heterogeneous IT infrastructures. As well as this, you can benefit from utilizing automation to save your team time and powerful dashboards to visualize traffic for enhanced analysis.
Sematext
Sematext is an all-in-one monitoring and log management platform that provides insights regarding the performance and health of applications and infrastructure in real time by tracking infrastructure, monitoring APM, log management, and synthetic monitoring. Sematext has many different types of integrations for collecting data without hassle from a variety of sources. With the tool users can adopt a proactive approach to issue resolution with custom dashboards, alerting based on set thresholds or conditions, and anomaly detection.
Sumo Logic
Another Nagios alternative is Sumo Logic, particularly beneficial for larger organizations, offering notable infrastructure monitoring capabilities with a focus on end-to-end monitoring. A standout feature of Sumo Logic is its cloud-based machine learning capabilities, which are invaluable for efficiently managing vast amounts of data simultaneously.
Splunk

Splunk is an analytics platform that focuses on searching, monitoring, and real-time analysis of machine-generated data. This software is loaded with log management, super-advanced search and indexing facilities, and real-time monitoring for the immediate identification and quick resolution of problems. Professionals can build interactive dashboards and reports that give top views of systems performance and security with its stringent visualization capabilities.
Dotcom-Monitor
Dotcom-Monitor is a powerful solution for cloud-based monitoring and assists users with real-time performance tracking, synthetic user monitoring of MAS-based transactions, and global uptime monitoring for services to ensure the best conditions of service delivery. Detailed reporting and alerting give users the chance to detect and resolve issues fast and advanced visualization tools offer deep insights into data analysis.
Obkio
Obkio is a network performance monitoring solution offering extensive visibility. With this tool, users can continuously monitor network performance to proactively detect anomalies and ensure smooth operations. Additionally, Obkio’s Monitoring Agents are distributed throughout the network to monitor the performance of all network paths, between any two points, offering enhanced visibility. Lastly, Obkio sends smart notifications to reduce notification overload and emphasize important events.
openITCOCKPIT
The last tool included in our list of Nagios alternatives is openITCOCKPIT, an open-source infrastructure monitoring solution. The modern monitoring framework from openITCOCKPIT is designed to monitor everything from virtual machines, baremetal servers, and cloud environments. Out-of-the-box this solutions monitoring agent will track CPU, memory, and disk usage, network interfaces, system services, and running processes.
If you've enjoyed this article why not read What is Infrastructure Monitoring or The Best Infrastructure Monitoring Tools next?