
Resources
7 min read
Last updated:
If you know anything about upholding the three pillars of observability for your business then you will know that centrally analysing and managing logs, metrics and traces is vital for improving how you observe the status of your business’s key infrastructure components.
Monitoring metrics is one of the most cost-efficient elements of this environment to manage and organisations are increasingly turning to track and monitor metrics to better manage costs as the resources taken up by this data type is a lot less than with typical log retention.
In this post, we’ll look at some of the best tools, including open-source, for managing metrics today.
Contents
1. Logit.io
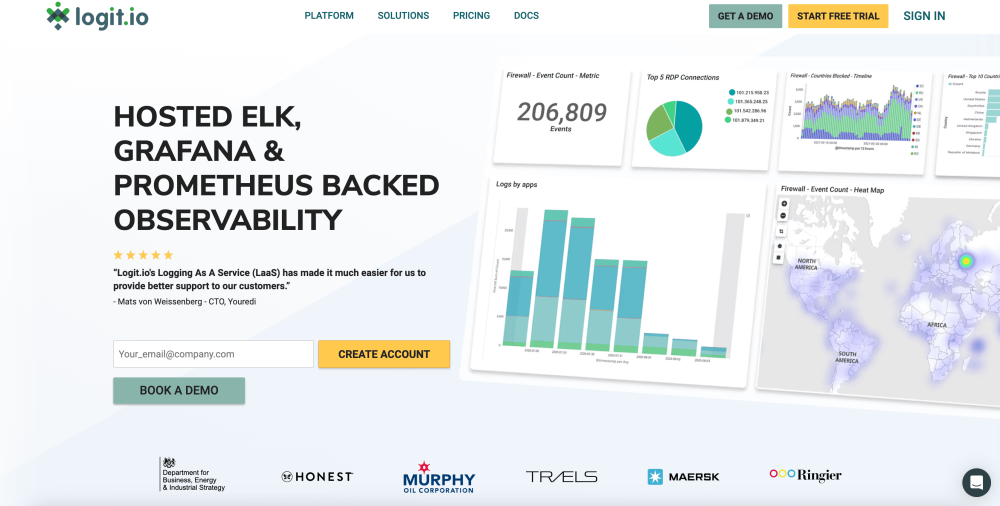 In the event of Prometheus needing extensive federation or requiring more storage than is possible to host locally, a platform such as Logit.io provides a highly affordable solution to bring scale, compliance and security to the Prometheus monitoring stack.
With high availability and SLAs up to 99.999%, you can be assured that using Logit.io as an in-place replacement to provide hosted Prometheus gives engineers a fully scalable alternative that allows them to explore the best of open-source metrics management with none of the overheads associated with configuration and maintenance.
Logit.io is also rated 5/5 stars on Capterra, Software Advice and Gartner.
You can get started with Logit.io and send metrics to our platform in 5 minutes. If you're interested in finding out more about hosted Prometheus, don't hesitate to contact us or begin exploring the platform for yourself with a 14-day free trial.
Features:
- Highly available Prometheus, Grafana and Elasticsearch side-by-side
- Centralised Metrics, Tracing and logging tool backed by open source software
- Highly rated and knowledgeable Support Engineers
- Advanced role-based access controls
- Lightning-fast deployment
- Hundreds of integrations
- Compliance & auditing
Unlock complete visibility with hosted ELK, Grafana, and Prometheus-backed Observability
Start Free Trial2. Zabbix
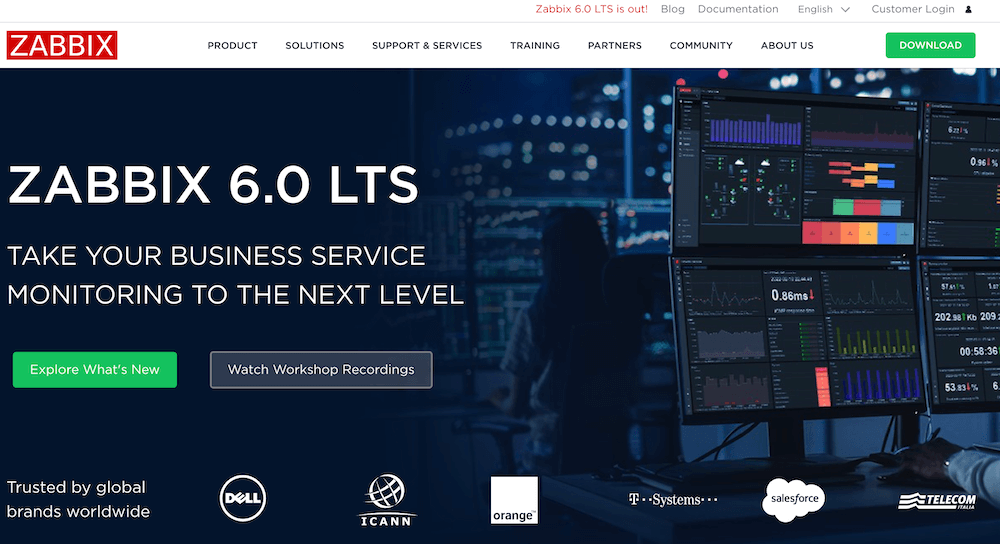 The open-source monitoring tool, Zabbix, is built for collecting and displaying basic metrics from networks, servers, virtual machines and cloud services. Whilst Zabbix has a host of benefits to would-be users, it is also worth considering the feedback commonly left on software engineering forums which often states drawbacks such as this tool requiring many hours of configurations and time spent on customising templates.
When scaling this tool to be suitable for enterprise use cases, it is worth considering having more than one engineer responsible for monitoring the performance of Zabbix, due to the extensive requirements and maintenance associated with this platform.
Features:
- Service, cloud and application monitoring
- Run on-premise or in the cloud
- Highly available
3. App Metrics
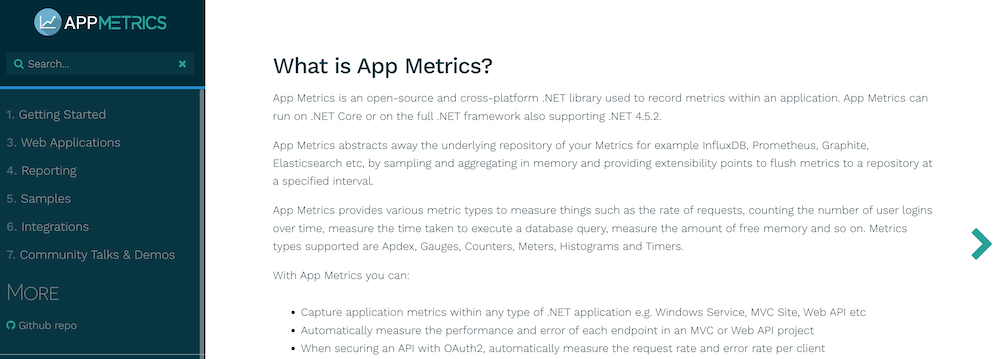 App Metrics enables its users to abstract away underlying metrics repositories by sampling and aggregating in memory and providing numerous extensibility points. To get started with using App Metrics you will need to make sure that your system is able to install the App.Metrics NuGet package. From here, configurations such as retrieving and filtering metrics can all be completed via the command line.
Features:
- Automatically measure the performance of any endpoints
- Measure request and error rates of clients
- Support for push and pull metric collection
4. Grafana
 Grafana is an open-source metrics dashboard that is one of the most popular solutions for metrics analysis due to its proficiency in handling visualisation, monitoring and alert creation.
Grafana originally started life as a fork of Kibana all the way back in 2013 and is still often compared to its predecessor as you can see in our in-depth guide on this subject comparing these two tools; Kibana vs Grafana.
Features:
- Can be used alongside Graphite, InfluxDB and Graphite
- Overlay numerous data sources within a single chart
- Extensive support documentation
5. Prometheus
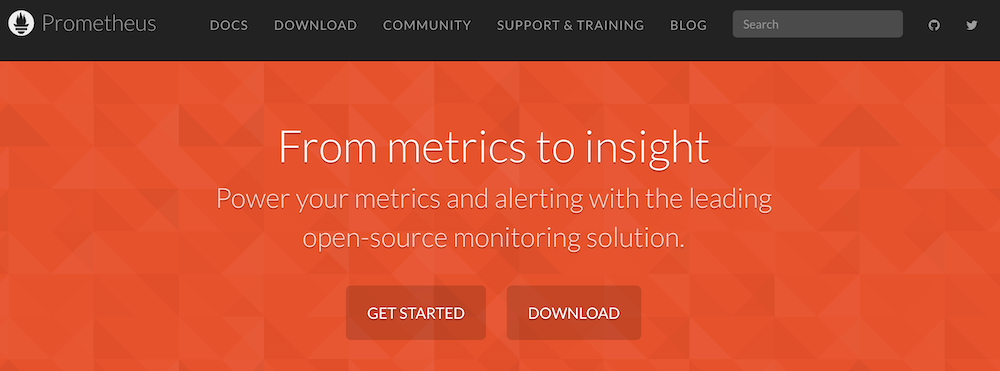 Prometheus is an open-source time-series database that is also commonly used as a monitoring and alerting tool. It is written in the Go programming language and even has its own dedicated query language, PromQL.
Prometheus is made up of three main components with the largest of these three being the time series itself, the second component is the alert engine and the third and final component is its robust scraping engine. Prometheus is well known for being a flexible system that is able to perform metrics collection and run complex mathematical queries.
This Cloud Native Computing Foundation (CNCF) backed platform can also provide simple graphs of the time series data that it is used to monitor, but this is somewhat rudimentary and users will find a lot more value from their data by using Prometheus in tandem with the above mentioned Grafana.
Features:
- Binaries are statically linked and easy to deploy
- Support for at least ten popular client libraries
- Highly dimensional data model
- Powerful querying
6. Thanos
 Thanos is a highly available Prometheus based project that offers long term storage capabilities for this time series monitoring stack. This solution is used by those in DevOps, and development for providing a version of Prometheus that is more readily available and scalable over an extended time period. Some users of Thanos have complained about Thanos retaining too much data but retention flags can be configured as part of this tool.
Features:
- Supports object storage with GCP logging, S3 and Azure
- Compatible with Prometheus's query API
- Global query view
7. Graphite
 Graphite is an open-source tool that monitors, collects, stores and displays time-series metrics in real-time. As an integrated tool, Graphite is compatible with existing tools that you may already use such as InfluxDB (a Go-based time-series database) or Telegraf (a popular server agent used to collect metrics).
The range of application statistics that can be recorded in Graphite is wide-ranging with real users having stated that they store all of the following metrics types in this application; application performance metrics, memory usage, CPU status, load average, flow session total. Graphite also boasts widespread adoption being used at over a hundred notable companies including Uber, LaunchDarkly, Twitch and Fiverr.
Features:
- Compatible with CSV, XML & JSON
- Store time-series data
- Renders graphs
8. FiveMetrics
 Whilst this tool may be somewhat little known in comparison to the other tools in this list, FiveMetrics is still worth considering if you are an extensive user of the AWS environment. FiveMetrics provides users with a centralised view of their AWS environment that includes dashboards, real-time data views and time-series observability.
As this platform is not as widely adopted as some of the previously mentioned tools it is worth using this solution whilst being mindful that the project’s original owners may not be maintaining the Github repository actively. This could mean that you feel somewhat on your own when it comes to requiring any low-level technical support.
Features:
- Agentless data collection
- Blindspot detection
- Data visualisation
9. Checkmk

Checkmk is an open-source monitoring solution used to monitor the status and performance of various systems, networks, and applications. The platform provides a set of metrics monitoring features and tools to ensure the availability and reliability of IT infrastructure. With Checkmk, users can monitor servers, networks, databases, cloud resources, and more.
Features:
- Monitoring Checks
- Notifications and Alerting
- Flexible Configuration
10. Percona

Percona Monitoring provides a comprehensive set of tools and features to monitor various aspects of database performance, including metrics related to server resources, query performance, and database health. It collects data from the database servers and presents it in a user-friendly interface, allowing administrators and developers to analyze and troubleshoot performance issues effectively.
Features:
- Query Performance Analysis
- Resource Utilization Tracking
- Historical Data Analysis
11. LibreNMS
 LibreNMS provides a wide range of monitoring capabilities, including the collection and analysis of various metrics related to network devices, servers, and services. LibreNMS supports the collection of metrics such as bandwidth usage, CPU load, memory utilization, interface status, disk usage, and many others. These metrics can be monitored in real-time and stored for historical analysis. LibreNMS uses protocols like SNMP (Simple Network Management Protocol) and other data collection methods to retrieve these metrics from the monitored devices.
Features:
- Auto-discovery
- Historical data and trending
- Multi-tenancy
If you enjoyed this roundup of the most popular open-source metrics tools then why read our previous guide on the best open source SIEM or see our software development life cycle chart?