
Resources, Security
8 min read
Last updated:
If you have any experience with comparing the leading tools in observability then it is very likely that you will have come across Splunk & ELK during your research.
These two titans have provided a swiss army knife of useful tools to many developers, cybersecurity specialists and devops professionals over the years since their inception.
In this guide, we’ll be comparing these two leading SIEM tools against each other to help you to decide on which solution will help your security use case.
Contents
Introduction To Splunk
Splunk is a data analytics tool that lets users index and analyse machine data (which includes logs, events and metrics) to produce valuable insights for observability. As machine data is notoriously difficult to analyse, Splunk aims to make the process of analysing this easier. Splunk works by connecting to machine data sources and forwarding data to the system where it is then stored and indexed.
This analytics tool collects machine data from just about any data source including IoT devices, microservices, remote sensors and network devices. Once ingested, Splunk indexes the data to make it accessible and then allows users to search and analyse that data. Splunk is supplied at four different pricing options which can be hard to find exact figures on without reaching out to their sales team directly.
The Splunk platform works with various connectors (including Kafka, as one example), which allows organisations to use it for a diverse amount of use cases from security and network monitoring to maintaining system uptime.
In this way, Splunk works like a search engine and uses its own search processing language (SPL) to filter and query your data. This allows users to easily analyse and create reports, visualisations, alerts and dashboards from unstructured data, which would normally be very difficult and time-consuming.
Splunk also lets you build and apply machine learning (ML) models to many of the processes the system performs. This may be one of their most valuable features for producing predictive analytics. As Splunk can forward and process very large quantities of data, users can constantly train ML models for better performance.
Splunk works to make machine learning more accessible to users who have the large amount of data required to perform ongoing ML experiments. The system also comes with guided workflows called smart assistants for creating models addressing common problems like applying machine learning to SPL commands, clustering numeric events to discover trends and running time-series forecasting. In addition, the Splunk analytics workspace offers a clean UI that lets users analyse and create reports and generally make the most out of the system.
While many users may see a lot of value from the system many others will find it to be too expensive. If you are considering Splunk it is worth finding out the pricing early in your research journey so that you can cross-compare solutions that may offer better value for specific use cases. It is worth knowing that without learning SPL new users won’t be able to harness the benefits of using Splunk fully.
Use Cases for Splunk
Splunk is widely used across various industries due to its robust capabilities in handling and analyzing machine data. Some common use cases include:
IT Operations: Splunk helps in monitoring and troubleshooting IT infrastructure by providing real-time insights into system performance and health. Security: It is extensively used for Security Information and Event Management (SIEM) to detect, investigate, and respond to security threats. DevOps: Splunk aids in continuous delivery and deployment by monitoring application performance and infrastructure in real time. Business Analytics: Companies use Splunk to analyze business metrics, customer behavior, and operational efficiency.
Industry Applications for Splunk
Finance: Financial institutions leverage Splunk for fraud detection, transaction monitoring, and regulatory compliance. Healthcare: Healthcare providers use Splunk to manage patient data, ensure compliance with healthcare regulations, and monitor medical devices. Retail: Retailers utilize Splunk for supply chain management, customer analytics, and enhancing the in-store experience. Manufacturing: Splunk assists in monitoring production lines, ensuring equipment uptime, and improving operational efficiency.
Introduction To ELK
The ELK Stack (also known as the Elastic Stack) is made up of the previously open-source tools Elasticsearch, Logstash, and Kibana. Elasticsearch was originally invented in 2010 by Shay Bannon and was originally based on Apache Lucene.
As transforming Apache Lucene into a full search engine was very difficult, Shay decided to create a program that performed as a wrapper for Apache Lucene to save others from having to face the same difficulties. This is how Elasticsearch was born and was able to offer a way of making multiple versions of a search engine, Apache Lucene, work simultaneously. This improvement allowed users to search all of their ingested data in its entirety.
The ELK Stack allows you to ingest data from any source and in any format and then search, analyse and visualise it in real-time. As well as the previously named components, the ELK Stack also includes Beats. Beats is the agent that would sit on your device locally, collect all of your logs and would then send them into the aggregator (Logstash). Logstash is able to listen on ports and take in data from files. Everything is then stored permanently in Elasticsearch, which is called upon and queried using Kibana.
Some of the most popular use cases for the Elastic Stack include logging, metrics, security analytics and business analytics. The ELK Stack is also used by many companies for a wide variety of use cases beyond security and SIEM.
Use Cases for ELK
The ELK Stack is also versatile and finds applications in various domains:
Log Management: ELK is frequently used for aggregating and analyzing log data from different sources, making it easier to troubleshoot issues. Metrics Monitoring: Companies use ELK to monitor system metrics and gain insights into performance trends over time. Security Analytics: Similar to Splunk, ELK is used for security monitoring, threat detection, and incident response. Business Intelligence: Organizations leverage ELK for real-time analytics and visualization of business data.
Industry Applications for ELK
Technology: Tech companies use ELK to monitor application performance, user behavior, and system logs. Telecommunications: ELK helps telecom companies analyze call data records, monitor network performance, and detect anomalies. E-commerce: E-commerce platforms use ELK for customer behavior analysis, transaction monitoring, and enhancing site performance. Energy: Energy companies utilize ELK for monitoring grid performance, analyzing consumption patterns, and optimizing resource usage.
Popularity
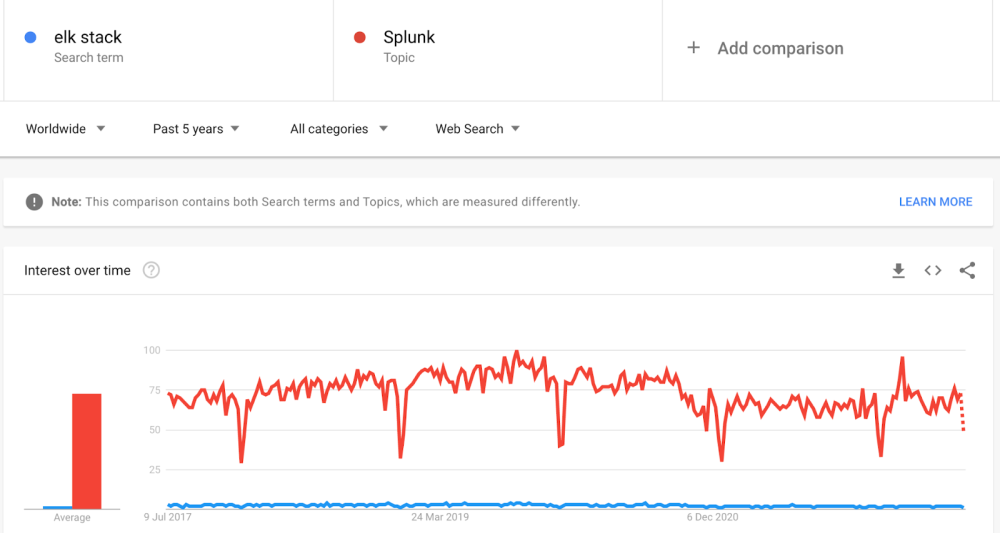 We are able to use Google Trends for market analysis to compare Splunk against ELK to view their global popularity over the past five years. It is clear to see when we do this that the demand for users searching for Splunk far outnumbers the trend of searches for the ELK Stack.
In Ahrefs (a popular tool for market research) if we want to see actual numbers on the number of people searching for each of these tools monthly we can see that Splunk takes the lead with 270,000 global searches per month over the ELK Stack’s 32,000 global searches each month.
Splunk vs ELK
Both Splunk and ELK have many similar features such as search capabilities, reporting, alerts and data visualisation.
When it comes to set-up and maintenance, as Splunk is a proprietary software, this is easier to configure and set up than the ELK Stack. Both ELK and Splunk support on-premise and SaaS deployment, which means that the software can sit on your physical data centre and you can also deploy these both to the cloud.
When it comes to comparing the two solutions for their APIs and extensibility, Splunk has around 200 plus APIs already developed whereas ELK may already have API support but it is still in development and requires improvement.
Splunk has over 1000 plus supported applications which are categorised into devops, IT support and IT security whereas the ELK stack has plug-in support but this is not as extensive as Splunk’s.
When it comes to components, Splunk is made up of a forwarder, an indexer and a search head whereas ELK is made up of Logstash, Elasticsearch and Kibana.
Both tools support search capabilities in their own distinct languages. Splunk uses the SPL language for querying whereas ELK uses the query DSL (Domain Specific Language). If we look at compression, Splunk is able to support compression whereas ELK does not.
In terms of pricing, Splunk is initially much more costly to run than ELK, with pricing from $2,000 per GB per year. Unfortunately, the answer on which of these two tools is the most cost-efficient to run is not the easiest to determine as self-hosted ELK is often notably expensive to scale.
The low cost to host ELK often wins users over initially, until they discover that with scale, up to thirty hours a week may be required of a dedicated ELK Stack engineer in order to keep the service running.
One alternative in this situation is to look into a service such as hosted ELK, or its successor hosted OpenSearch to see how this solution can be managed at a fraction of the cost of either a self-hosted Stack or as a Splunk alternative.
If you found this post informative then why not check out our previous guide to Kibana dashboards or our previous post on cuckoo sandbox.