ELK, How To Guides, Resources
32 min read
Last updated:
The ELK Stack has millions of users globally due to its effectiveness for log management, SIEM, alerting, data analytics, e-commerce site search and data visualisation.
In this extensive guide we cover all of the essential basics you need to know to get started with installing ELK, exploring its most popular use cases and the leading integrations you’ll want to start ingesting your logs and metrics data from. We will also discuss how opting for a managed ELK platform such as Logit.io may be the best solution for your organization to enhance its current operations.
Contents
- What is the ELK Stack?
- The Popularity of ELK
- What Is The Current Status Of The ELK Stack In Terms Of Open-Source Licensing?
- What Are Some Of The New Features Introduced In Major Releases Of Elasticsearch, Logstash, Kibana, and Beats?
- Who Uses ELK?
- Why Is Log Management Important?
- How Can Log Management Be Considered A Mission-Critical System?
- How Can The ELK Stack Be Implemented For Security Purposes, Such As Anti-DDoS Measures and SIEM?
- What Security Features Are Available For The ELK Stack and What Additional Configurations Are Required?
- What Are The Plugins Available For ELK?
- Elasticsearch Plugins
- Logstash Plugins
- Kibana Plugins
- Elasticsearch Community Plugins
- Logstash Community Plugins
- Kibana Community Plugins
- What Challenges Are Involved In Maintaining Log Data Consistency and Quality In Logstash?
- What Are Some Built-in Features In Logstash That Can Help With Data Resiliency?
- What Is A Common Pain Point When Working With Logstash?
- What Is KQL (Kibana Querying Language) and How Is It Used For Searching Data In Kibana?
- What Are The Different Search Types Available In Kibana and How Are They Used?
- What Are Some Tips and Best Practices For Conducting Searches In Kibana?
- How Does Kibana's Filtering Dialog Assist Users In Searching and Filtering Data?
- ELK Stack Installation Tutorial
- Installing Elasticsearch
- Installing Logstash
- Installing Kibana
- Installing Beats
- What Are Some Configuration Best Practices For Using Beats?
- What Are The Benefits Of Using Beats In The ELK Stack?
- How Can The ELK Stack Be Installed Using Different Methods and On Different Operating Systems and Environments?
- What Are The Additional Components That Can Be Added To The ELK Stack For Handling Complex Pipelines?
- The Leading Use Cases For ELK
- Hosted ELK from Logit.io
- The Most Popular Integrations For ELK
What is the ELK Stack?
The ELK Stack stands for the previously open-source tools Elasticsearch, Logstash, and Kibana (which were open-sourced up to and including version 7.10). The ELK Stack is the most popular solution for log management and analysis and is also known as the Elastic Stack (as of their rebrand, formally announced in October of 2016).
In addition to log management, the ELK stack is used to solve an extensive array of cybersecurity, application performance and observability issues that arise from a lack of data visualisation and monitoring capabilities. ELK is also used for alert configuration and plays a key role in sending alerts to your existing incident management systems.
The first E of ELK is Elasticsearch. Elasticsearch is a powerful & fast search and analytics engine that processes data in real-time. Elasticsearch is well known for its features that allow the search engine to suggest intelligent results based on prior search data and its ability to return accurate results even for terms entered with typos.
The second tool that makes up ELK is Logstash. Logstash works as a powerful extract, transform & load (ETL) tool which serves as a flexible pipeline that collects, enriches and transports data. It works by collecting log messages and forwarding them onto Elasticsearch for visualisation and further processing within Kibana.
The last tool which makes up ELK is Kibana. Kibana is a highly popular visualisation and reporting user interface developed in 2013 by Rashid Khan of the Elastic Company.
Kibana enables its users to create reports and visualisations from a variety of data inputs. Users can create pie charts, heat maps, line graphs, scatter plots and so much more to reflect data in an easily digestible format by using Kibana to host their log and metrics data.
If you want to see what type of use cases Kibana (in association with Elasticsearch and Logstash) can be used for then why not check out our article on the best Kibana dashboard examples.
The Popularity of ELK
Interest in the ELK Stack has grown exponentially since its initial inception due to its ability to fulfil the needs of engineers that require effective and reliable log analysis and data visualisation amongst the other use cases we’ll expand on below.
Each month over 100,000 people across the globe search for the ELK Stack with the primary countries expressing the most interest being the US (17%), Japan (10%), Vietnam (7%), India (6%) and Russia (4%).
ELK Stack's creators Elastic BV have also experienced YoY growth for the past four years running due in part to the popularity of the platform with users for their commercial offering of ELK.
What Is The Current Status Of The ELK Stack In Terms Of Open-Source Licensing?
The ELK Stack is no longer considered open-source. In early 2021, Elastic, the company behind the ELK Stack, introduced changes to its licensing approach. With the release of version 7.11, Elastic implemented dual proprietary licenses for ELK-related projects. These licenses, namely SSPL (Server Side Public License) and the Elastic license have introduced certain restrictions and ambiguous legal language concerning the usage of the ELK Stack.
This move by Elastic has generated some controversy within the open-source community. Previously, the ELK Stack had been widely recognized as a popular log management and analytics solution that was freely available and maintained by Elastic. However, with the implementation of new licenses, Elastic's relationship with the open-source community has become more complex.
In response to Elastic's licensing changes, AWS has introduced OpenSearch and OpenSearch Dashboards as alternatives to the Elasticsearch and Kibana components of the ELK Stack, respectively. These offerings from AWS aim to fill the void left by the changes made to the ELK Stack's open-source status.
What Are Some Of The New Features Introduced In Major Releases Of Elasticsearch, Logstash, Kibana, and Beats?
In recent major releases of the ELK Stack, several new features have been introduced for Elasticsearch, Logstash, Kibana, and Beats.
For Elasticsearch, version 7.x has made the setup process much easier by including Java bundled alongside it. Performance improvements have been made, including the addition of a real memory circuit breaker and enhanced search performance. Another notable enhancement is the introduction of a new cluster coordination layer, which makes Elasticsearch more scalable and resilient. Elasticsearch 8.x versions, which are not open source, offer further enhancements such as optimizing indices for time-series data and enabling security features by default.
In Logstash, version 7.x has brought a significant change by enabling the Java execution engine by default. Previously an experimental feature introduced in version 6.3, the new execution engine replaces the old Ruby engine and offers better overall performance, reduced memory usage, and a faster experience.
Kibana has also undergone significant improvements in recent releases. The latest version includes a dark mode, improved querying and filtering capabilities, and various enhancements to the user interface. Kibana versions 8.x, similar to Elasticsearch versions 8.x, are not open source but come with features that allow users to break down fields by value, making it easier to browse through large volumes of data.
As for Beats, version 7.x now conforms to the Elastic Common Schema (ECS), which is a new standard for field formatting. Metricbeat, one of the Beats modules, introduces support for an AWS module, enabling users to pull data from Amazon CloudWatch, Kinesis, and SQS. New modules have also been introduced in Filebeat and Auditbeat.
Who Uses ELK?
The ELK stack is used by leading businesses around the globe, some of the most notable include the following:
- GDIT
- Adobe
- Udemy
- Walmart
- WebMD
- SEMrush
- Robinhood
- Similarweb
- ResearchGate
The following famous companies have self-reported using Elasticsearch:
- Slack
- Github
- CircleCI
- Instacart
- Stack Overflow
The following notable companies have stated that they use Logstash:
- Fiverr
- Ocado
- Indeed
And last but not least, the next selection of companies all use Kibana for visualisation purposes:
- Trivago
- Hubspot
- Trust Pilot
- Hello Fresh
- Booking.com
Why Is Log Management Important?
Without centralised log management organisations are vulnerable as a result of not being able to pinpoint log events that signify potential security breaches, attempted hacks, abuse of privileges and errors.
Whilst many professionals that handle data in a variety of formats will find log management and its subsequent analysis useful, the leading roles that commonly find themselves conducting this task tend to be in one of the following departments: DevOps, Development, Data Analyst, System Administration, Cybersecurity and Business Analysts.
The global popularity of Log management is growing steadily and consistently with the most interest being expressed in this solution by companies operating in the US (46%), India (10%), the UK (6%), Vietnam (5%) and Indonesia (4%).
How Can Log Management Be Considered A Mission-Critical System?
Log management is an essential practice for organizations looking to effectively address problems and ensure the smooth operation of their applications. It has evolved into a mission-critical system due to its vital role in troubleshooting production issues and identifying security threats. The uninterrupted functionality of a robust log management system is paramount in these scenarios. Without it, organizations would face significant challenges in resolving problems, potentially leading to degraded performance, system downtime, or even security breaches.
By implementing a continuous log analytics system, an organization gains the necessary tools to track and pinpoint issues that can wreak havoc on their system. This continuous monitoring capability allows for the proactive identification of problems, making it easier to troubleshoot in real time. Consequently, issues can be resolved promptly, minimizing the impact on overall system health and stability.
Log management serves as an invaluable resource in the identification and resolution of production issues. Moreover, log management plays a vital role in maintaining the security of an organization's applications and infrastructure. By continuously collecting and analyzing log data, potential security breaches can be detected early on, allowing for immediate action to prevent further damage. This level of vigilance ensures that any security hazard or suspicious activity is promptly addressed, reducing the likelihood of unauthorized access, data breaches, or compromised systems.
How Can The ELK Stack Be Implemented For Security Purposes, Such As Anti-DDoS Measures and SIEM?
The ELK Stack can be implemented to create a comprehensive SIEM system that consolidates data from various layers within an IT environment, such as web servers, databases, and firewalls. This data is then processed to facilitate easier analysis and visualization, ultimately presenting it in powerful monitoring dashboards.
In the context of anti-DDoS measures, the ELK Stack can play a crucial role in identifying and mitigating potential threats. By aggregating data from different sources, such as network traffic logs, server performance metrics, and security event logs, it becomes possible to detect and respond to DDoS attacks effectively. Real-time monitoring and visualizations of this data can also provide early warnings and enable immediate action, helping organizations prevent or minimize the impact of such attacks.
Through advanced analytics and visualization, the ELK stack enables the identification of potential security incidents, log correlation, and the generation of actionable insights. This empowers security teams to effectively monitor, detect, and respond to security events promptly, enhancing overall security posture and facilitating incident response.
What Security Features Are Available For The ELK Stack and What Additional Configurations Are Required?
The ELK Stack offers several security features to protect sensitive data and limit access to specific dashboards, visualizations, and data within the log analytics platform. These security features include encryption, role-based access control (RBAC), and authentication.
To enhance security beyond the basic features, additional configurations can be implemented. One option is to use a reverse proxy like NGINX to access the Kibana dashboard. By configuring NGINX, users can be required to provide a username and password before accessing the dashboard, adding an extra layer of authentication.
For more advanced security configurations and integrations, there are third-party solutions available. SearchGuard is a security plugin for Elasticsearch that offers RBAC, SSL/TLS encrypted node-to-node communication, and additional features like LDAP/AD support for seamless integration with existing authentication systems. Another option is OpenSearch, which includes a built-in open-source security plugin with similar capabilities to SearchGuard. To circumvent the need to implement these additional security controls whilst remaining fully secure, new users should consider deploying ELK as a Service to save on time, extensive resources and to ensure optimal performance.
What Are The Plugins Available For ELK?
Plugins for ELK are additional modules that can be installed to extend the functionality of the Stack. These plugins are designed to enhance the log analysis and observability experience, providing users with additional features and capabilities.
There are two main categories of plugins: core plugins and community plugins. Core plugins are included as part of the Elasticsearch package and are maintained by Elastic. They are well-integrated with the ELK ecosystem and follow the same versioning and development cycles as the core software.
On the other hand, community plugins are developed by the wider community and are separate entities from the core packages. These plugins have their own versioning and development cycles, allowing for faster updates and customization options. They are typically created to address specific use cases or provide specialized functionalities that may not be available in the core Elasticsearch software.
Here are the markdown tables you requested for Elasticsearch, Logstash, and Kibana plugins, including both official and community plugins.
Elasticsearch Plugins
| Plugin | Description |
|---|---|
| Elasticsearch-HQ | A user interface that provides monitoring, management, and querying capabilities for Elasticsearch clusters. |
| Search Guard | Offers comprehensive security features for Elasticsearch, including encryption, authentication, authorization, and audit logging. |
| Dejavu | A web UI for Elasticsearch that allows you to browse, search, and manage data. |
Logstash Plugins
| Plugin | Description |
|---|---|
| Logstash Input Plugins (e.g., file, syslog, beats, http, jdbc) | These plugins allow Logstash to read data from various sources. |
| Logstash Filter Plugins (e.g., grok, mutate, date, geoip) | Used for transforming and enriching data before it is sent to its destination. |
| Logstash Output Plugins (e.g., elasticsearch, email, file, http) | These plugins define how Logstash sends data to various outputs like Elasticsearch, email, files, or over HTTP. |
Kibana Plugins
| Plugin | Description |
|---|---|
| Canvas | Allows users to create custom dynamic infographics based on Elasticsearch data. |
| Timelion | A time series data visualizer that enables users to combine fully expressive, Elasticsearch-driven queries with simple syntax. |
| Elastic Maps | Enables users to visualize geospatial data in Kibana with maps. |
Elasticsearch Community Plugins
| Plugin | Description |
|---|---|
| Elasticsearch-analysis-ik | An Elasticsearch plugin for Chinese text analysis. It provides powerful Chinese language support and analysis. |
| Prometheus Exporter | Allows for exporting Elasticsearch metrics to Prometheus, facilitating better integration with Prometheus-based monitoring systems. |
| ReadOnlyREST | An alternative to Search Guard and X-Pack security, offering access control and security features for Elasticsearch. |
Logstash Community Plugins
| Plugin | Description |
|---|---|
| logstash-filter-translate | Enhances data enrichment capabilities by allowing you to translate fields from one value to another using a dictionary. |
| logstash-input-jdbc | Widely used for importing data from databases into Elasticsearch via Logstash, supporting JDBC-compliant databases. |
| logstash-output-kafka | Enables Logstash to send output data to Kafka topics, integrating well with Kafka-based streaming data pipelines. |
Kibana Community Plugins
| Plugin | Description |
|---|---|
| Kibana Swimlane Visualization | Adds swimlane visualizations to Kibana, useful for displaying time-based events or metrics in a compact manner. |
| Enhanced Table | Provides enhanced data table visualizations in Kibana with additional features over the standard data table. |
| Sentinl | Adds alerting and reporting functionality to Kibana, allowing you to schedule reports and define complex alert conditions based on data. |
What Challenges Are Involved In Maintaining Log Data Consistency and Quality In Logstash?
Maintaining log data consistency and quality in Logstash can pose several challenges with one significant challenge being the process of processing and parsing logs in accordance with defined rules by filter plugins.
Building groks, which are used to define patterns for parsing log lines, can be particularly challenging. Debugging these groks and accurately parsing logs to extract relevant fields for Elasticsearch and Kibana can also prove to be complex tasks. Mistakes can easily be made during this process, leading to inaccurate or incomplete log data.
As log files grow in size or when custom applications are incorporated, managing and maintaining the log configurations can become difficult. Large and hard-to-manage log files can result in issues with log searchability and visualization. It is crucial to thoroughly test and continually update log configurations through version control to ensure consistency and accuracy in the log data. Before deploying Logstash in a production environment, extensive testing and experimentation are necessary to fine-tune log parsing and maintain log data consistency and quality.
What Are Some Built-in Features In Logstash That Can Help With Data Resiliency?
Logstash offers several built-in features that can enhance data resiliency. These features include:
Buffering: One of the recommended methods for data resiliency is to add a queuing layer between Logstash and the destination. Popular queuing systems like Kafka, Redis, and RabbitMQ can be utilized as buffers. By introducing this intermediate layer, Logstash can handle fluctuations in resource availability, prevent data loss, and ensure smooth data flow.
Persistent Queues: Logstash provides a built-in feature called "Persistent Queues," which enables storing data in an internal queue on disk. By default, this feature is disabled, but it can be enabled in the Logstash settings file. Persistent Queues help protect against data loss in scenarios such as sudden crashes, restarts, or network failures. By persisting data on disk, Logstash can recover data from the queue upon recovery.
Dead Letter Queues: Logstash also supports "Dead Letter Queues." This feature allows events that could not be processed to be stored on disk for further analysis. Similar to Persistent Queues, Dead Letter Queues are disabled by default and need to be enabled in the Logstash settings file. Dead Letter Queues help ensure that no data is lost even when processing failures occur. By storing these events separately, they can be reviewed and analyzed later to identify and rectify any issues in the pipeline.
These built-in features complement Logstash's functionality and offer safeguards against potential data loss. To avoid the time and maintenance costs required to implement these features it is well worth considering Hosted Logstash as a possible solution.
What Is A Common Pain Point When Working With Logstash?
When working with Logstash, a common pain point is often related to managing the configuration file. It is advisable to keep the Logstash configuration file as simple as possible to maintain good performance. This includes using only the necessary plugins and avoiding unnecessary accumulation of filter plugins.
To alleviate this pain point, it is highly recommended to thoroughly test and verify the configurations before deploying Logstash in a production environment. This can be done by utilizing the --config.test_and_exit parameter when running Logstash from the command line. Additionally, the Grok debugger can be an invaluable tool for testing and troubleshooting Grok filters used in the configuration file.
What Is KQL (Kibana Querying Language) and How Is It Used For Searching Data In Kibana?
KQL, which stands for Kibana Querying Language, is a dedicated querying language used in Kibana to search and retrieve data. It has been introduced as the default querying language for users. With KQL, users can efficiently search their data by writing queries that adhere to the syntax and rules of the language.
What Are The Different Search Types Available In Kibana and How Are They Used?
Kibana offers various search types, each serving a unique purpose when it comes to querying data. These search types can help users effectively search and analyze their data and have been detailed below:
Free text searches: This search type is ideal for quickly finding specific strings within the data. Users can enter a search term or phrase, and Kibana will return any documents that contain that exact string.
Field-level searches: With field-level searches, users can target their search within a specific field of their data. This allows for more precise querying, as users can search for a particular string only within a specific field, rather than across all fields.
Logical statements: Logical statements help users combine multiple search queries into a single meaningful expression. Kibana supports logical operators such as AND, OR, and NOT, which allow users to perform complex searches by combining different criteria.
Proximity searches: Proximity searches enable users to search for terms or phrases within a specific character proximity. This search type is particularly useful when there is a need to find terms that occur close to each other within the data.
What Are Some Tips and Best Practices For Conducting Searches In Kibana?
Below we've listed some tips and best practices for conducting searches in Kibana:
Utilize free-text searches: Use double quotes ("string") to search for an exact match of a specific string, helping you quickly locate desired information.
Take advantage of wildcard symbols: The * wildcard symbol can replace any number of characters, while the wildcard symbol is used to replace only one character. This allows for more flexible searches when the exact term is unknown or when you want to broaden your search results.
Use the exists prefix: To search for logs that possess a specific field, utilize the exists prefix along with the field name. This allows for filtering and finding logs based on the existence of a particular field.
Perform range searches: Kibana enables searching within a range of values within a field. This is particularly useful when seeking logs that fall within a specific numerical or date range.
Employ capital letters for logical statements: When using logical operators like AND, OR, or TO within a search, it is recommended to use capital letters. This ensures that Kibana correctly interprets the logical relationship between search terms.
Consider negative terms: You can utilize the -, !, or NOT operators to define negative terms in your search. This allows for excluding specific terms or filtering out undesirable results.
Utilize proximity searches: Proximity searches help locate terms that appear within a specific character proximity to each other. This can be helpful when searching for phrases or terms that should be close together in the logs.
Understand the difference between field level and free-text search: Non-analyzed fields require a different approach for searching compared to free-text searches. It is important to understand the distinction and apply the appropriate search techniques accordingly.
Be aware of the default logical operator: If you don't specify a logical operator, the default one in Kibana is OR. This means that if multiple terms are entered without any logical operator, Kibana will search for logs containing any of those terms.
How Does Kibana's Filtering Dialog Assist Users In Searching and Filtering Data?
Kibana's filtering dialog offers valuable assistance to users in searching and filtering data. It allows users to easily filter the data displayed in the main view, making the search process more efficient. By clicking the "Add a filter +" button under the search box, users can access the filtering dialog and start experimenting with conditionals.
This dialog provides a user-friendly interface where users can define filters based on their specific requirements. Users can input various conditionals to customize their filters and refine their search results. The filtering dialog allows for flexibility and enables users to apply multiple filters simultaneously.
In addition to filtering the data, Kibana's filtering dialog offers several useful features. Users can pin filters to the Discover page, which helps in retaining specific filters for future reference. Custom labels can be assigned to filters, allowing users to easily identify and differentiate between different filters. The dialog also provides an option to enable or disable filters as needed. Furthermore, users have the ability to invert filters, which can be useful when they want to exclude certain data from their search results.
ELK Stack Installation Tutorial
You can run ELK in a variety of different ways, on your own hardware locally, in the cloud, using Docker and for popular configuration management tools like Puppet, Chef and Ansible.
The steps to install the ELK Stack can be quite complex and varied depending on your scenario but here we guide you on how to download, install and get started with Elasticsearch, Logstash, Kibana and Beats using the RPM package which is suitable for installation on Red Hat, Centos, Oracle enterprise and other RPM-based systems.
These steps can be performed on any AWS, Azure or GCP cloud instance ensuring that any security group firewall is configured to allow access from anywhere via SSH and TCP 5601.
Let’s get started
Installing Elasticsearch
Import the Elasticsearch Signing Key
In order to verify the downloaded package we first need to download and install the public signing key. Elasticsearch uses the PGP key D88E42B4, available from https://pgp.mit.edu with fingerprint:
4609 5ACC 8548 582C 1A26 99A9 D27D 666C D88E 42B4
Download and install the public signing key:
rpm --import https://artifacts.elastic.co/GPG-KEY-elasticsearch
For RedHat based distributions we need to create a file called elasticsearch.repo in the /etc/yum.repos.d/ directory containing:
[elasticsearch]
name=Elasticsearch repository for OSS 7.x packages
baseurl=https://artifacts.elastic.co/packages/oss-7.x/yum
gpgcheck=1
gpgkey=https://artifacts.elastic.co/GPG-KEY-elasticsearch
enabled=0
autorefresh=1
type=rpm-md
Note: The above configuration installs the Apache 2.0 OSS licensed version of Elasticsearch, to install the version that contains commercially licensed features use the following repository
name=https://artifacts.elastic.co/packages/7.x/yum
You can now proceed to install Elasticsearch using the repository that we have configured above, using the following command:
sudo yum install --enablerepo=elasticsearch elasticsearch
Some of the commercial features enable automatic index creation in the non-OSS version of Elasticsearch, of course, if using the Logit.io log management platform we take care of index management for you.
To start and stop Elasticsearch with SysV init run the following command
sudo -i service elasticsearch start
sudo -i service elasticsearch stop
To start and stop Elasticsearch with systemd run the following command
sudo systemctl start elasticsearch.service
sudo systemctl stop elasticsearch.service
To test that Elasticsearch is running we can send an HTTP request to port 9200 on localhost or point your browser to http://localhost:9200, we should see a similar output to that below:
{
  "name" : "****",
  "cluster_name" : "elasticsearch",
  "cluster_uuid" : "****",
  "version" : {
"number" : "7.1.1",
"build_flavor" : "default",
"build_type" : "tar",
"build_hash" : "",
"build_date" : "****",
"build_snapshot" : false,
"lucene_version" : "8.0.0",
"minimum_wire_compatibility_version" : "6.8.0",
"minimum_index_compatibility_version" : "6.0.0"
  },
  "tagline" : "You Know, for Search"
}
Installation in a highly available Elasticsearch cluster architecture requires some additional configuration, of which we will cover in a future blog post.
Installing Logstash
One suggestion for keeping Logstash configuration simple is to prioritize simplicity. It is recommended to avoid unnecessary plugins in your configuration. By only utilizing plugins when they are truly required, you can streamline your Logstash setup and simplify the overall configuration process.
To install Logstash, there are specific system requirements that need to be met:
Java 8 or Java 11: Logstash requires Java 8 or Java 11 to run properly. Ensure that you have one of these versions installed on your system.
Verify Java installation: To confirm that Java is installed, you can use the following command in your terminal:
java -version. The output should display the installed Java version, such as "1.8.0_191" for Java 8.OpenJDK or compatible Java Virtual Machine: Make sure you have OpenJDK or a compatible Java Virtual Machine installed. Logstash is compatible with OpenJDK, and it is recommended to use the OpenJDK runtime environment.
Verify your Java version with the following command:
java -version
We’ve already verified the signing key above and set up the repository, so we can go ahead and install Logstash with the following command:
sudo yum install logstash
Now we can start Logstash.
To start and stop Logstash with SysV init run the following command
sudo -i service logstash start
sudo -i service logstash stop
To start and stop Logstash with systemd run the following command
sudo systemctl start logstash.service
sudo systemctl stop logstash.service
Installing Kibana
Run the following command to install Kibana using the repository that we configured earlier:
sudo yum install kibana
In order to tell Kibana which Elasticsearch to connect to, modify the Kibana configuration yaml file found which can be found at /etc/kibana/kibana.yml and make sure you have specified the server.port and elasticsearch.url as shown below:
server.port: 5601 elasticsearch.url: "http://localhost:9200"
We can now start Kibana.
To start and stop Kibana with SysV init run the following command
sudo -i service kibana start
sudo -i service kibana stop
To start and stop Kibana with systemd run the following command
sudo systemctl start kibana.service
sudo systemctl stop kibana.service
If you then browse to http://localhost:5601 you will be directed to the initial Kibana dashboard screen.
Installing Beats
Beats are a family of shippers that allow you to simply and quickly send data to Logstash and/or Elasticsearch.
We would recommend using Filebeat to get started shipping your logs and metrics to Logstash. Filebeat takes a file path to allow you to specify the location of your logs. Let’s start by installing Filebeat:
curl -L -O https://artifacts.elastic.co/downloads/beats/filebeat/filebeat-oss-7.8.1-x86_64.rpm
sudo rpm -vi filebeat-oss-7.8.1-x86_64.rpm
Locate the configuration file:
/etc/filebeat/filebeat.yml
The default filebeat.inputs sections looks as below and will be looking for log files in /var/log/*.log, you can change this path to point to the location where your log files are generated:
filebeat.inputs:
- type: log
  # Change to true to enable this input configuration.
  enabled: false
  # Paths that should be crawled and fetched. Glob based paths.
  paths:
  - /var/log/*.log
We can now validate any configuration changes by running the following command:
sudo filebeat -e -c /etc/filebeat/filebeat.yml
If you receive no configuration errors after running the check, let’s proceed and start Filebeat:
sudo systemctl enable filebeat
sudo systemctl start filebeat
If we have everything configured correctly a new Logstash index should have been created in Elasticsearch, let’s take a closer look.
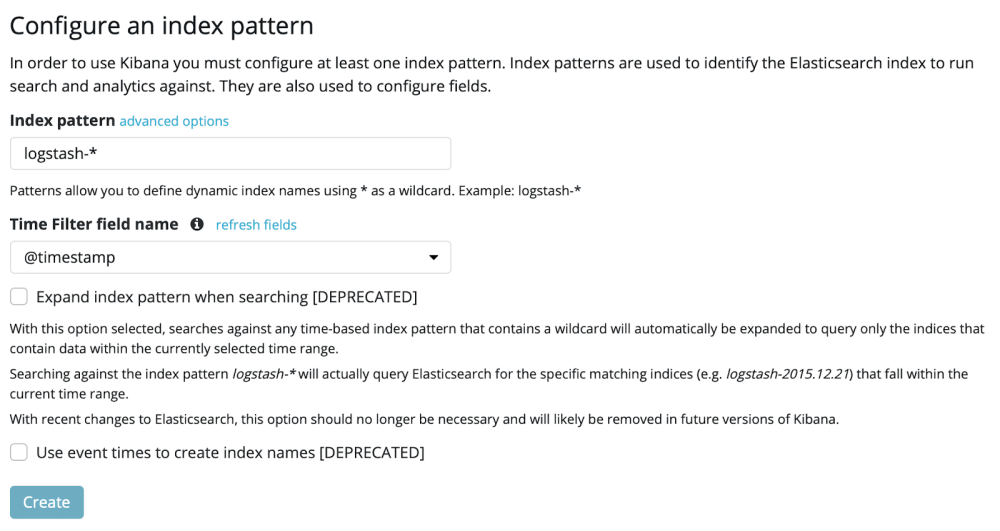
Open Kibana and browse to Management > Kibana Index Patterns, we would expect to see a Logstash Index as well as a Filebeat index for the beat we are using.
Choose Create Index Pattern, entering logstash-* as the Index pattern and selecting @timestamp for the time filter field, then choose Create.
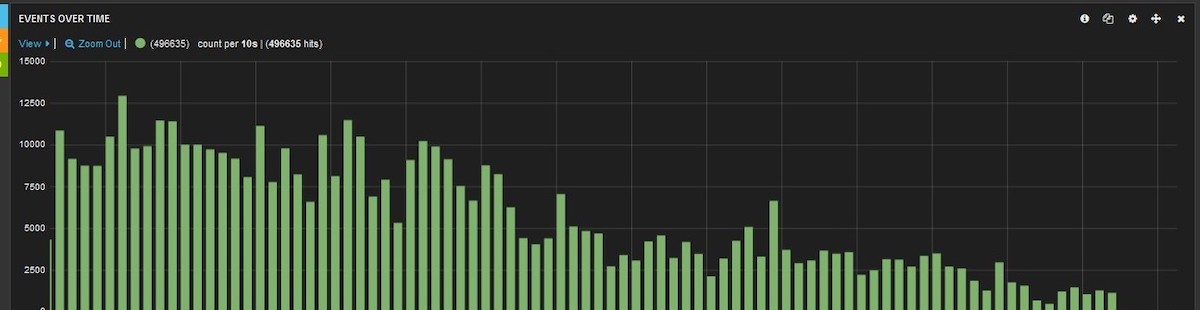
You’re now ready to dive in and look for insights in your data! Click on the discover tab in Kibana and choose ‘Today’ from the date picker to ensure we are seeing all the data available.
What Are Some Configuration Best Practices For Using Beats?
When configuring Beats, it is essential to follow certain best practices to ensure smooth operation. Below are some recommended configuration practices.
Each beat has its own unique configuration file and settings, so it is crucial to provide specific instructions for each beat individually.
Some beats, like Filebeat, come with comprehensive example configuration files (e.g., /etc/filebeat/filebeat.full.yml). These files contain extensive lists of available configuration options and can serve as a useful reference.
When working with YAML files, it is important to be aware of their sensitivity. Make sure to use spaces for indentation and avoid using tabs. In Beats, YAML configuration files usually follow the two-space indentation convention.
To edit the configuration file, it is recommended to use a proper text editor like Sublime Text or any other preferred editor that supports YAML syntax highlighting.
The dash character (-) is used in YAML to define new elements. Ensure that the indentations and hierarchies between sub-constructs are maintained when using dashes.
What Are The Benefits Of Using Beats In The ELK Stack?
Using beats in the ELK Stack brings several benefits to the overall data pipeline and enhances its reliability. One key advantage is that beats help distribute the workload, thereby reducing the burden on Logstash. This distribution of data processing tasks makes the pipeline more efficient and improves its performance.
Additionally, beats contribute to the overall reliability of the data pipeline. By offloading some of the processing responsibilities from Logstash, beats help ensure that data ingestion and transportation are handled smoothly. This reduces the risk of bottlenecks and potential failures, making the data pipeline more robust and dependable.
While beats assist in load balancing and improving reliability, Logstash remains an essential component in most pipelines that involve aggregating log files. This is because Logstash offers advanced processing capabilities and the ability to enrich data. Through advanced processing techniques, Logstash can perform complex transformations, filtering, and data enrichment tasks on the ingested data. These features make Logstash invaluable for refining and enhancing the collected log files.
How Can The ELK Stack Be Installed Using Different Methods and On Different Operating Systems and Environments?
The ELK Stack offers flexibility in terms of installation methods and compatibility with various operating systems and environments. It can be installed in several ways based on individual requirements.
Firstly, the ELK Stack can be installed locally, allowing users to set up the stack directly on their own machines. This option is suitable for those who prefer to have full control over the installation process and want to leverage the stack's capabilities for local data analysis and visualization.
Alternatively, the ELK Stack can be installed on the cloud. This installation method is beneficial for users who want to take advantage of the cloud's scalability and accessibility. By deploying the ELK Stack on the cloud, users can easily collect, analyze, and visualize data from different sources, regardless of their physical location.
Another option is to use containerization technology such as Docker. With Docker, users can package the ELK Stack along with its dependencies into a singular unit called a container. This approach simplifies the deployment process, as the container can be easily deployed across different operating systems and environments, providing a consistent environment for running the ELK Stack.
Lastly, configuration management systems like Ansible, Puppet, and Chef can be utilized to install the ELK Stack. These systems automate the installation and configuration processes, allowing for seamless deployment across various operating systems and environments. This method is particularly useful for large-scale deployments or when consistency is crucial.
What Are The Additional Components That Can Be Added To The ELK Stack For Handling Complex Pipelines?
When it comes to handling complex pipelines for processing large volumes of data in production, the ELK Stack can be enhanced with various additional components. These components are typically integrated into the logging architecture to improve resiliency and strengthen security.
One example of an additional component is Kafka, a distributed streaming platform that provides fault-tolerant, scalable, and highly available message queuing capabilities. By incorporating Kafka into the ELK Stack, organizations can ensure that data flows smoothly between different stages of the pipeline, even in the face of failures or high traffic loads.
Another component that can be added to the ELK Stack is RabbitMQ, a robust message broker that enables efficient communication between different applications or services. By leveraging RabbitMQ, businesses can improve the reliability and performance of their data processing pipelines, as it offers features like message persistence, clustering, and high availability.
Redis, a powerful in-memory data structure store, is another component that can enhance the ELK Stack. By integrating Redis, organizations can achieve faster data ingestion, caching, and real-time analytics capabilities. Its ability to handle high data throughput and provide efficient data storage and retrieval makes Redis a valuable addition to complex logging architectures.
Lastly, for bolstering security in the ELK Stack, organizations can incorporate nginx, a versatile web server and reverse proxy. NGINX acts as a protective layer, helping to safeguard the logging architecture against malicious attacks and unauthorized access. With NGINX, businesses can enforce secure communication protocols, handle SSL/TLS encryption, and properly manage access controls to their logging infrastructure.
The Leading Use Cases For ELK
The most popular use case for the ELK Stack is for log management and analysis. In addition to this, there are many more highly valuable reasons to use ELK for reporting, alerting and improving your observability which we have listed below:
- SIEM
- Alerting
- Live tailing
- Social listening
- Data streaming
- Troubleshooting
- Tracking referrals
- Website analytics
- Server monitoring
- Metrics management
- Vulnerability scanning
- Kubernetes monitoring
- Compliance and auditing
- Monitoring website uptime
- Automated test monitoring
- Measuring sales performance
- Understanding user behaviour
This list, while extensive, will be expanded on in the future based on other uses we observe ELK being used to facilitate.
How Can The ELK Stack Be Customized For Different Environments and Use Cases?
The design of the ELK Stack can be tailored to suit various environments and use cases, offering a versatile solution for log management and analytics. Depending on the specific requirements, the components of the ELK Stack can be combined and configured in different ways to achieve optimal results.
In less complicated development environments, a classic architecture may be employed. This typically includes three main components: Elasticsearch, Logstash, and Kibana. Elasticsearch acts as the search and analytics engine, Logstash is responsible for collecting, processing, and sending logs, and Kibana provides a user-friendly interface for visualizing and exploring log data. This simple setup can effectively manage logs and offer basic analytics capabilities.
However, in more complex scenarios, such as handling large amounts of data in production, additional components are often added to the ELK Stack architecture to ensure scalability, resiliency, and security. For example, Kafka, RabbitMQ, or Redis can be integrated into the stack to ensure the reliable ingestion and processing of logs, adding a layer of resiliency. NGINX can also be included for enhanced security measures.
For more advanced log management, additional features can be incorporated into the ELK Stack design. This may include an archiving mechanism for long-term storage of logs, an alerting plugin to notify administrators of critical events, and replication across different regions or segments of the data center to ensure high availability and disaster recovery.
Ultimately, the design of the ELK Stack can be customized based on the specific needs of each environment and use case. By leveraging the flexibility and interoperability of its components, organizations can create a tailored architecture to effectively manage logs, enable powerful analytics, and ensure optimal performance.
Hosted ELK from Logit.io
While ELK (Elasticsearch, Logstash, and Kibana) offers powerful capabilities, many businesses discover that managing their Elastic Stack setup becomes increasingly complex, costly, and time-consuming as their data output scales exponentially. With our fully managed ELK platform, you can eliminate the need for training, managing, and maintaining your ELK Stack, streamlining your deployment and ensuring seamless scalability as your data grows.
Logit.io offers hundreds of regularly updated data source integrations for the essential software you rely on daily. Easily send log data from a wide range of tools and programming languages, including Microsoft Azure Event Hub, Ruby, Apache, .NET Core, Fluentd, Amazon CloudTrail, and Kubernetes, with some of these listed below. Also, our extensive documentation makes onboarding and navigating the platform painless, offering you a seamless transition for your organization.
If you’re interested in finding out more about Logit.io’s fully managed ELK platform then don’t hesitate to contact us or begin exploring the platform for yourself with a 14-day free trial.
Unlock complete visibility with hosted ELK, Grafana, and Prometheus-backed Observability
Start Free TrialThe Most Popular Integrations For ELK
An attribute that many users of ELK find useful is its high compatibility with processing logs and metrics from a wide variety of data sources.
This means that it doesn’t matter if your data source originates from an operating system, application, cloud service or programming language, ELK will be able to transform your unstructured and semi-structured data into data that can be easily reported upon and unlocked for the valuable insights it holds.
We’ve selected the integrations listed below based on their popularity with thousands of hosted ELK users who use the ELK stack on a regular basis.
Azure:
AWS:
- AWS Elastic Kubernetes
- AWS Cloudwatch
- AWS Cloudtrail
- AWS Cloudfront
- AWS ELB
- AWS EC2
- AWS RDS
- AWS S3
- AWS VPC
Google Cloud:
Operating Systems:
Applications:
View all of the rest of the integrations for ELK.
Don’t have the time to build, configure and host your Elastic Stack locally? Then why not get started with hosted ELK from Logit.io.
With our no credit card required 14-day free trial you can launch Stacks within minutes and explore the full potential of Elasticsearch, Logstash, Kibana, Grafana & Open Distro for Elasticsearch.
If you enjoyed this guide and you wish to continue learning about ELK then why not check out our previous blog on Kibana vs Grafana?