
Resources
21 min read
Last updated:
Business Intelligence (BI) tools allow businesses to gather, process and analyse large amounts of data so that they are able to make decisions and see opportunities as well as visualise and report on key metrics for Stakeholders.
The range of Business Intelligence tools available to use is an ever-expanding list with newcomers to the market appearing every year.
With so much choice available, we wanted to gather the insights from experienced users of some of the best premium, open source & free BI tools available to help you decide on what tool or software might be best for your organisation.
Contents
- 1. Microsoft Power BI
- 2. Tableau
- 3. Zoho Reports
- 4. IBM Cognos Analytics
- 5. Logit.io
- 6. MicroStrategy
- 7. BIRT
- 8. Knowi
- 9. Metabase
- 10. Apache Zeppelin
- 11. Pentaho
- 12. Reveal
- 13. Talend Open Studio
- 14. Knime
- 15. ClicData
- 16. Timely
- 17. Amazon QuickSight
- 18. Evidence
- 19. Whaly
- 20. Grow
- 21. Owox
- 22. Alteryx APA Platform
- 23. Alibaba Quick BI
- 24. Pyramid Analytics
- 25. Yellowfin
- 26. Dundas BI
- 27. Looker
- 28. Bipp
- 29. Holistics
- 30. TackleBox
1. Microsoft Power BI
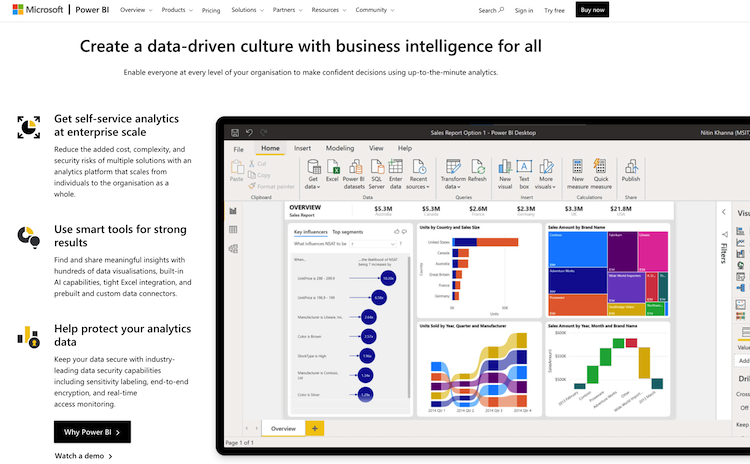
“I enjoy using Microsoft Power BI in my organization as it integrates well with Google Analytics, so every time data is collected, it is easily gathered and centralised,”
says Dennis Bell of Byblos Coffee. He continues;
“Being a web based BI, I can access the platform from anywhere, anytime. It is easy to use, and I can quickly connect existing spreadsheets and apps through built-in connections and APIs.”
“It’s best feature is that it has a publish to web feature that lets me add my visualizations directly to my website.”
“Power BI is essential for my sales team. It generates pages of visualizations that come from a single dataset. It also has interactive visualizations and a drag-and-drop feature to add different visualizations into reports.”
“The main drawback of using Power BI is that it cannot handle complex relationships between data. When you add more than one link between data, it is confusing for the system.”
Microsoft Power BI also partially qualifies as a free business intelligence tool as they offer a free tier on their platform.
Andrei Vasilescu, CEO at Don’t Pay Full also highly recommended Microsoft Power BI in his response:
“MS Power BI software is an intuitive platform consisting of many smart data visualization and business intelligence features.”
“With the help of its intuitive visualization and efficient tables you can easily convert raw data into useful insights and statistics. These useful analytical insights play a vital role in allowing businesses to make critical decisions.”
“It can be used on both on-premise and cloud platforms in both desktop and mobile devices. Using MS Power BI greatly helps any business for these notable benefits along with other useful ones.”
Andrei also noted in his response, much like Dennis regarding Power BI’s flaws;
“It sometimes stumbles to handle complex tables with multiple links and has limited options for complex configurations.”
Cole Torres owner at Cole's Computer Solutions additionally wished to cite Power BI as his primary choice and focused on the integration possibilities of this platform in his response;
“An overwhelming amount of the small and medium businesses that I work with are finding tremendous savings by embracing a modern technology stack and building a majority of their infrastructure on Azure and Microsoft 365.”
“The seamless integrations with Microsoft Power BI makes this a no brainer. The fact that there is a free plan associated with Microsoft 365 allows us to set up and show businesses a proof of concept, or they can settle for the free plan and get quality, actionable information at no additional cost.”
“The integration with the Azure and Microsoft 365 environments also make the management on the IT end simpler and sets a company up for less security risks from managing an additional vendor.”
2. Tableau
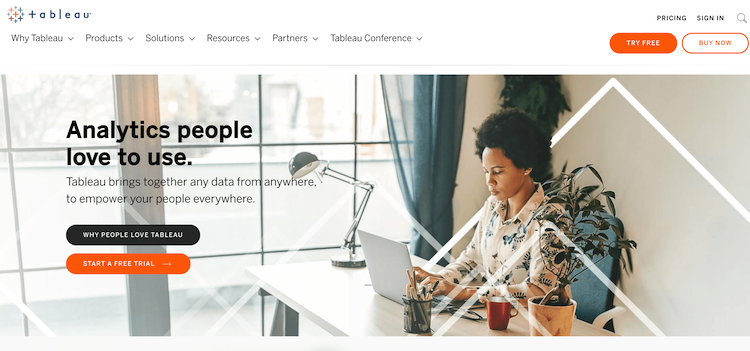
“Tableau Public is a public and open-source business intelligence software that allows its users to produce creative and interactive charts that demonstrate the data and also allow users to use a live dashboard and even publish their findings online,”
says Omair Khan, Outreach Consultant at Gigworker.
“It is a great tool especially since the data can be customized for various viewing mediums such as mobile and tablets. It’s also a free tool to use for businesses.”
Michael J Hickey, Director of Analytics and Data Science Solutions at Skylytics has used both Tableau and the previously mentioned Power BI, he drew comparisons between the two in his response:
“We have had great results using PowerBI and Tableau on client engagements.”
“These tools are intuitive and easy to use. One can quickly connect to a data source and produce high-quality reports and data visualizations.”
“Both have very strong online communities that can be extremely useful for questions, sharing experiences, and even sharing code and visualizations.”
3. Zoho Reports
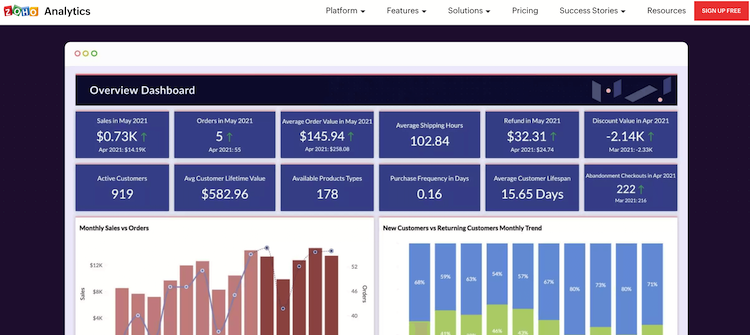
In his second recommendation, Omair Khan recommends tableau alternative Zoho Reports;
“Zoho Reports is a business intelligence tool that can connect to almost any data source and show a visual presentation of all the analytical data.”
“As it can process many data sources to assist anyone in analyzing all of their data points. It is also able to provide insights on data sources in a matter of seconds. The free version of the tool also allows for a maximum of 2 users.”
4. IBM Cognos Analytics
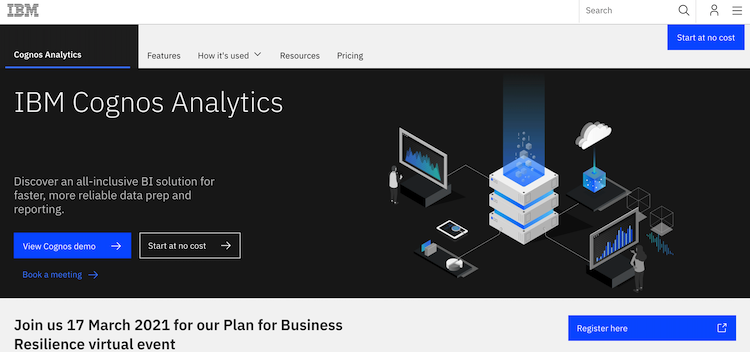 Brett Downes, CEO of Haro Helpers was more than happy to recommend IBM Cognos Analytics in his response;
“Part of the Microsoft family, IBM Cognos Analytics is a cloud-based business intelligence software that uses AI recommendations when creating dashboards and adds geospatial capabilities to extend your data.”
5. Logit.io
 Logit.io provides a highly affordable business intelligence and analytics reporting dashboard that is built on hosted ELK & Grafana. The ELK Stack is composed of several complimentary open source offerings including ElasticSearch, Logstash, Kibana and Beats.
Business analytics is Logit.io’s managed solution built on the best open source solutions to provide all of the key components required for organisations to analyse their key business metrics at some of the most affordable rates in the industry.
Features include:
- Choice of OpenSearch, Kibana and Grafana dashboards
- Advanced role-based access controls
- Lightning-fast setup
- Compliance & auditing
- Scheduled reports
- Affordable BI
6. MicroStrategy
 Another popular suggestion for this list was MicroStrategy, with both Carol Tompkins Business Development Consultant at AccountsPortal & Kristian Rasmussen, CEO at Ultify recommending the tool;
“The most highly recommended business intelligence tool that I have come across is MicroStrategy.”
says Carol.
“I prefer this tool because it gives you excellent, and actionable insights on trends, opportunities, and areas for improvement,”
she continued.
“It's easy to set up, use, and input data for analysis. The insights are also presented in a manner that is simple to understand for the entire team.”
When asked to describe why MicroStrategy was a good fit for their operations, Kristian provided the following insights;
“MicroStrategy is really helpful in the visualization of large data sets.”
“You can save the templates with various parameters, filters, and rules which are easy to update with a refresh in a click. You can also save the widgets and export them as excel sheets, and pdf, to extract data in shareable files.”
“Another great feature is that they provide contextual insights. You simply need to hover with your mouse, and the software will recognize the relevant data, directly on the website, applications, and devices you use.”
7. BIRT
When asked for his favourite open source business intelligence tool, Gilad Rom, CEO of Huan recommended BIRT.
“BIRT is an open source BI dashboard & analytics platform that creates data visualizations, reports and dashboards that can be embedded into rich client and web applications.”
“It has a responsive user and interface and integrates well with database tools and web applications.”
“The reports can be created via drag and drop and tailored to our specific needs. There have been occasions where it has struggled when I was continuously changing my report. I’ve used BRIT to generate online forms, email reports and data visualizations.”
8. Knowi
A relative newcomer to the marketplace, Knowi was recommended by Todd Ramlin, Manager at Cable Compare;
“I’m recommending Knowi, a new name in the business intelligence field.”
“The platform takes a unique approach to business intelligence by focusing on three big differentiators that haven’t been a part of traditional solutions.”
“These features are data virtualization, search-based analytics, and native support for NoSQL data analytics.”
“Knowi is a little unpolished since it’s still a startup, but the cutting edge features they provide could have a big impact on how BI gets done going forward.”
9. Metabase
 Abraham Klein, CEO at Sitepod, was keen to recommend his alternatives for open source BI tools for the users that are more comfortable with data analysis;
“Metabase was designed to handle crucial, but less complex questions which are a part of day-to-day analytics operations.”
“Its simplicity is its key feature, being that it’s easy to install and use. It comes with a graphical interface, and eye-appealing charts of your data which you can generate in a matter of a few clicks.”
“One drawback it has is that advanced SQL users struggle with the data interface which is not in the style of SQL, but Metabase was not designed with them in mind.”
Nicholas Holmes, CEO at Contract Hound also seconded Metabase in his response; “we have Metabase linked with Segment, which is a must-have for agile web-based businesses.”
“We pipe all of our analytics, marketing, revenue and CRM data into our Segment data warehouse, so then we can query from Metabase or just use Segment to keep the data centralised. This makes Metabase a super helpful tool for bringing business data together in real time.”
When it came to summarising the key features of Metabase, James Idayi, CEO at Cloudzat was happy to contribute the benefits of Metabase that he found the most essential;
Key Features of Metabase:
- It works with Docker's picture to run every service you require.
- Popular services such as AWS Elastic Beanstalk and Heroku are supported by the one-click installation functionality.
- Through the Java environment, it can run locally on any operating system, including Linux.
- Unlike most other business intelligence software, the user interface is simple and intuitive, with modern gestures.
- It has a Slack integration for shared teamwork.
- You can also rename, annotate, and edit various data resources for your convenience.
10. Apache Zeppelin
For his second recommendation for open source business intelligence tools, Abraham gave the following reasons for using Apache Zeppelin;
“Apache Zeppelin is a data analysis notebook tool compatible with a number of programming languages such as Python, R, Scala, Spark, etc.”
“It’s great for connecting to a range of data sources, and generating analyses in documented forms is super easy. I recommend this one for power users, as it requires analysts who can write code, due to it being pretty barebones.”
Another Apache project that has lended its support to offering business intelligence features is Superset. Superset offers a fast, lightweight and feature rich solution for data visualisation that analysts may wish to experiment with.
11. Pentaho
 Another leader in this space was cited by Nabil Mounem, Founder of Have Websites in his review of Pentaho; “Pentaho is one of the most widely used open-source business intelligence tools for
businesses.”
Another leader in this space was cited by Nabil Mounem, Founder of Have Websites in his review of Pentaho; “Pentaho is one of the most widely used open-source business intelligence tools for
businesses.”
“The platform mines data from various sources, interprets data, generates reports, and develops workflows.
“There is a group version of this suite that is fully free to download. This is especially useful for small online businesses and college students who are struggling to get their businesses off the ground.
“You may either buy the whole kit or choose different components. By using their web platform, the tools are accessible from any browser.
Pentaho's Main Features:
- For data reporting, it has an innovative report generation platform.
- Managers may use the integrated design studio to label up presentations to make them easy to understand.
- You can easily find your existing data sources by adding a layer of custom metadata to them.
- Kettle is part of the Pentaho Data Integration solution, which allows you to extract and load data into a data warehouse.
- For data analysis, the advanced graphical tool can create ROLAP (Relational online analytical processing) schemas.
12. Reveal
 A newer player in the business intelligence marketplace, Reveal was recommended by John Gomez, CEO at Sensato;
“We are a cybersecurity solutions firm and employ Reveal to help our customers make sense of their risk, vulnerability, policy, and maturity data.”
“In terms of benefits, we have been able to focus on what we do best and have not had to become experts in data visualization, data mining, dashboard development, and all of the other features that Reveal brings to the table.”
“Our software automates cybersecurity countermeasures along with other leading-edge security protections. Reveal makes it simple for our customers to visualize threat patterns, and it offers us a fixed, affordable pricing model.”
“We can project what our costs will be, unlike other vendors that charge a per-user or usage fee. Reveal was easy to get up and running and allowed us to use a variety of data formats as well as employ various visualizations and share that information.”
13. Talend Open Studio
 Talend Open Studio is an extract, transform & load (ETL) Tool that also has many capabilities for business intelligence.
Talend was recommended by Naomi Bishop, CEO of Surfky, who explains her reasons for selecting this tool below;
“Talend is a Java-based application that runs in the Eclipse RCF environment.”
“The user interface of this tool makes it very easy to use, which consists of a graphical designer and a metadata repository for files.”
“Talend Open Studio embraces scalability, which allows you to get more productivity out of your data processing. Users can also create components by writing scripts to expand the capabilities of this BI program.”
Key Features of Talend Open Studio:
- To assist your growing company, Talend contains an advanced business modeler as well as a very user-friendly work builder.
- The metadata manager assists in the development and maintenance of metadata for use in combining business data with other research and reporting applications.
- Talend Open Studio comes supplied with a built-in library of over 400 components that can be used to enhance the functionality.
- Almost every feature has a built-in impact analysis method for assessing the new data model's risks.
- For busy professionals, the drag-and-drop metadata and component browsing functionality are extremely helpful.
14. Knime
 Knime is primarily known as an advanced data analyser but was subsequently mentioned by multiple respondents for its use as an open source BI platform, our first recommendation coming from Chris Taylor, Marketing Director at ProfitGuru;
“Knime is an open-source business intelligence (BI) platform that focuses on data linking, integration, and analysis.”
“The platform gives data scientists and BI executives the tools they need to create efficient data pipelines, including data mining, machine learning, and data visualization.”
“Knime can also be used to build a predictive model for a variety of business domains and models, including classification, regression, and clustering.”
Our second review of this tool is from Tanner Arnold, President & CEO of Revelation Machinery who cited extensive community support for Knime as just one of many benefits; “Knime is not just my favourite Business Intelligence tool but also one of the best in the market.”
“Knime is open source and constantly updated, allowing users to build visual workflows using a drag-and-drop graphical interface.”
“You can develop your workflow by modelling each phase of your research and controlling the flow of data to ensure work is still current by choosing from over 2000 module nodes.”
“Community Extensions are user-contributed capabilities from industry-specific software, and open-source integrations for Knime provide additional access to megaprojects.”
Lastly, Brian Chung CEO & Co-Founder of Alabaster, also recommended Knime as his primary choice for conducting business intelligence and analysis;
“Knime is an easy and convenient business and data analysis program that simplifies and enhances business performance by analyzing and processing data clusters in a single step.”
"Because of its robust data network and ability to process and filter data in a matter of seconds, Knime runs smoothly.”
“With the support of its interactive dashboards and data processing model, it can also construct visual workflows and statistics and with the aid of this platform, you can also build machine learning models, which is yet another fantastic add-on to have.”
15. ClicData
Making an entrance for our next review, Darren Dean, founder of WipeLock gave his reasons for recommending this alternative open source solution for business intelligence; “ClicData is a cloud-based open-source business intelligence platform that connects data from a variety of sources.”
“The platform allows users to create customized dashboards within a few minutes. We used to store data in multiple systems which becomes complicated quite quickly. With ClicData, we can merge all of our data into a single data warehouse, create custom dashboards quickly via a drag-and-drop interface, and then share them easily.”
“Like any other business intelligence platform out there, ClicData is not perfect, their formulas use different syntax depending on whether you're making calculations within the dashboard widgets or within the data source transformations, which makes it confusing at times to remember how to write them.”
“Overall, we’ve found ClicData essential as a company that has a lot of data to analyze and manage. This includes finance, digital marketing, retail, etc.”
16. Timely
 Timely is an award-winning automatic time tracking software. Leveraging AI, it helps companies connect with their workforce and report accurately on their business – for payroll, project management, team management and capacity planning. Timely features effortless and detailed reporting and dashboards.
Timely’s Main Features:
- Real-time dashboards communicate team/project performance making all time accountable, producing a precise, objective record of all business time.
- Live reports and powerful planning keep teams on top of capacity, deadlines, overtime, billable percentage, budget spend, time on clients and more.
- Timely’s gorgeous design, intuitive controls and privacy-first approach make it a time tracking tool that people actually want to use.
- Ease of implementation - clicks into your existing tech stack
- Minimal timesheet admin – AI can draft timesheet entries for you
17. Amazon QuickSight
 Amazon QuickSight is a business intelligence tool that allows users to create and publish interactive BI dashboards which can be accessed through any connected device of your choosing. This platform, in particular, boasts scalability as one of its main benefits, claiming to be compatible with being used by tens of thousands of users from a single organisation at any one time.
Notable users of QuickSight include the NFL, Rio Tinto, Siemens, Volvo and MLB Advanced Media.
Key Features of Amazon QuickSight:
- Pay as you go pricing
- Interactive dashboards
- Data source integrations
- Super-fast, parallel, in-memory, calculation engine (SPICE)
18. Evidence
 Evidence provides business analysts with an open-source tool that can be operated by any user fluent in either SQL or Markdown.
Reports can be templated in Evidence to save you time spent generating manual reports by using loops, conditionals and re-usable components
Key Features of Evidence:
- Built for SQL analysts
- Templated reports
- Fully open sourced MIT license
19. Whaly
 Whaly offers a no-code business intelligence solution that allows its users to drill down into key business insights and report on data combined from a variety of sources.
Whaly is compatible with handling data from the following popular sources; Hubspot, Segment, LinkedIn, Salesforce, Google Analytics & Airtable. Whaly is a relatively new player in the BI marketplace so unlike many of the previously mentioned tools they do not have an extensive case study database to reference.
Key Features of Whaly:
- Custom alerts
- Set sales objectives
- Streamline business data processing
20. Grow
 Grow is yet another no-code addition to this list. This platform also hosts many data connections for metrics and insights to be ingested from a variety of sources including Amazon Redshift, Asana, FreshBooks, Google Ads, ActiveCampaign and Bigcommerce.
The platform is most often used by business intelligence specialists but is also compatible with users in more traditional marketing and sales roles through to employees operating in accounting and finance roles.
Key Features of Grow:
- No coding knowledge required
- Extract, transform & load
- Data Prep
- CRM integration
21. Owox
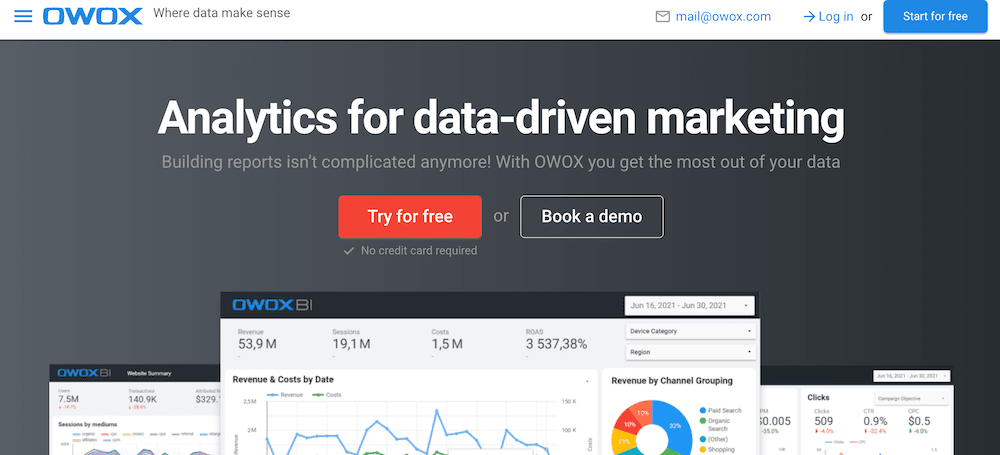 Owox allows analysts access to real-time data to drive informed decision making. This is especially vital in eCommerce environments where traffic and stock is moving fast and offers may need to be revised quickly.
Example metrics that Owox can display easily include; revenue by channel, sessions, cost, return on ad spend, clicks, CTR, CPC and overall transactions.
Key Features of Owox:
- Google Analytics integration
- Advanced marketing reports
- ROPO analysis
22. Alteryx APA Platform
 Alteryx APA Platform provides BI specialists with the ability to automate key insights to output from over seventy integrations for faster dashboard creation. Their platform offers to transform the data-driven workflow of an entire business's operations by being compatible with an unlimited amount of different data sources.
Notable customers of Alteryx APA include Sega, Gymshark, Walmart, 7-eleven and the University of Nottingham.
Key Features of Alteryx APA Platform:
- Drag-and-drop data prep
- Automated publishing
- Predictive reporting
23. Alibaba Quick BI
 Alibaba Quick BI is yet another BI platform that allows analysts to benefit from using drag and drop components to build out intuitive reporting dashboards from a rich library of visualisation formats.
This platform gives users access to configure role-based access controls (RBAC) so that they can limit sensitive data being shown to users who have less privileged roles within an organisation.
Alibaba’s solution also benefits from some white labelling functionality as it can be embedded within third party systems to show insights to key stakeholders without them needing to visit a separate platform to your internal system.
Key Features of Alibaba Quick BI:
- Integrate cloud data
- Create data portals
- Easily control data access permissions
24. Pyramid Analytics
 Pyramid Analytics is a well-established business intelligence solution that was founded all the way back in 2009, whose technology partners include AWS, Azure & Oracle to name only a few.
Pyramid Analytics BI solution offers an alternative to siloed methods that limit the true potential of effective data analysis by offering a platform that is at its best when used across the entirety of a business by the vast majority of its departments.
Key Features of Pyramid Analytics:
- Live demos
- Powered by AI
- Multi-tenant architecture
- Sector agnostic
25. Yellowfin
 Yellowfin BI allows analysts to use data storytelling to convey insights to key stakeholders and team members through action-based reporting dashboards.
Their platform is also inspired by analysts on the go and as a result of this, they provide a dedicated mobile app compatible with both Android and iOS so that spikes, drops and trend anomalies can be acted on by decision-makers away from their desks.
Key Features of Yellowfin:
- Data storytelling
- Identify new revenue streams
- Insights as a service
26. Dundas BI
 Dundas is yet another well-established competitor in the BI space having originated back in 1987. Their business not only offers self serve options but also provides additional training and consultancy where required.
This solution claims to have incredible capacity out-of-the-box and offers further flexibility for users who are in particular need of a custom data analytics and BI solution. Like Yellowfin above, Dundas also have a mobile app for users who wish to review KPIs and dashboards away from their desktop machine.
Key Features of Dundas BI:
- Monetise your data
- Embedded analytics
- White-labelled reporting dashboards
- Highly customisable
27. Looker
 This modern BI platform is fully integrated with Google Cloud Platform and is also compatible with hosting on Amazon Web Services. Looker can connect to a number of popular databases including Redshift, Snowflake and BigQuery as well as over fifty dialects of SQL.
Looker is used by over 2000 companies including Twilio, Avant, Futureplay & Harver. New users may find frustration in the fact that you can't sign up for a trial of Looker without first booking a demo and speaking to a member of their team
Key Features of Looker:
- Data-driven workflows
- Custom applications
- Integrated insights
28. Bipp
 Bipp aims to simplify the process of connecting databases, creating custom datasets and writing complex queries for data analysts who wish to conduct fast business intelligence reporting.
Bipp not only offers business intelligence dashboards but also offers its own security features. The Bipp platform sports a dedicated querying language, bippLang, in order to offer an alternative to having to use complex SQL queries.
Key Features of Bipp:
- Reusable data models
- Robust dashboards
- In-database analytics
29. Holistics
 Holistics is another self serve BI tool that is primarily built for non-technical users to display key insights from PostgreSQL, MySQL and Microsoft SQL server among other data sources.
Holistics allows its users to define metrics in data models, map relationships and curate datasets so that your business team don't have to take away time from your technical team with unnecessary queries. The solution also makes it easier to maintain a single accurate source of truth by proving a complete centralised data reporting tool.
Key Features of Holistics:
- Curate metrics
- Share via webhooks
- Simplify multiple data sources
30. TackleBox
 For our final tool, we are including a relatively new and affordable solution for those analysts who are still committed to using Excel. TackleBox is a very simple solution that enables its users to send data from excel and transform inputted data into PowerPoint ready visualisations that can be updated at the click of a button.
Key Features of TackleBox:
- Link between Excel and PowerPoint
- Real-time dashboards
- Integrate with Microsoft 365
We hope you enjoyed this list, think we’ve missed a tool that you love to use for Business Intelligence? Then feel free to send your review to [email protected]
If you enjoyed this post on the top business intelligence tools then why not check out our guide to the Software Development Life Cycle (SDLC) or our resource guide on Grafana dashboards?