
Resources
4 min read
Grafana is a leading open-source data visualization tool offering powerful extensive capabilities for exploring, creating, and sharing dashboards. The tool provides querying and the ability to configure alerts on your information and metrics from wherever that information is stored, this includes traditional server environments, Kubernetes clusters, and various cloud services. A key benefit of Grafana is that it can Connect to numerous sources including Prometheus, Elasticsearch, Graphite, InfluxDB, MySQL, PostgreSQL, and many more.
Grafana has grown to become one of the most widely used data visualization tools on the market, yet the solution isn’t ideal for every organization. Firstly, the feature richness and high customizability of Grafana can be overwhelming to a new user. Users who aren’t familiar with querying languages or specific peculiarities of their data sources, find it difficult. Both advanced knowledge of Grafana itself and a deep understanding of the underlying data infrastructure are required to create advanced dashboards and craft fine-grained alerts.
Also, while Grafana is perfect for visualizations and simple alerting, its analytics capabilities are relatively low compared to dedicated analytics platforms. For advanced data analysis and statistical processing, users often need to rely on external tools or scripts to preprocess data before visualizing it in Grafana.
These factors have outlined to users the various reasons why Grafana may not be the perfect solution for their organization and are therefore searching for Grafana alternatives. We have provided the leading alternatives that you should consider next in this article.
Grafana Alternatives
Logit.io
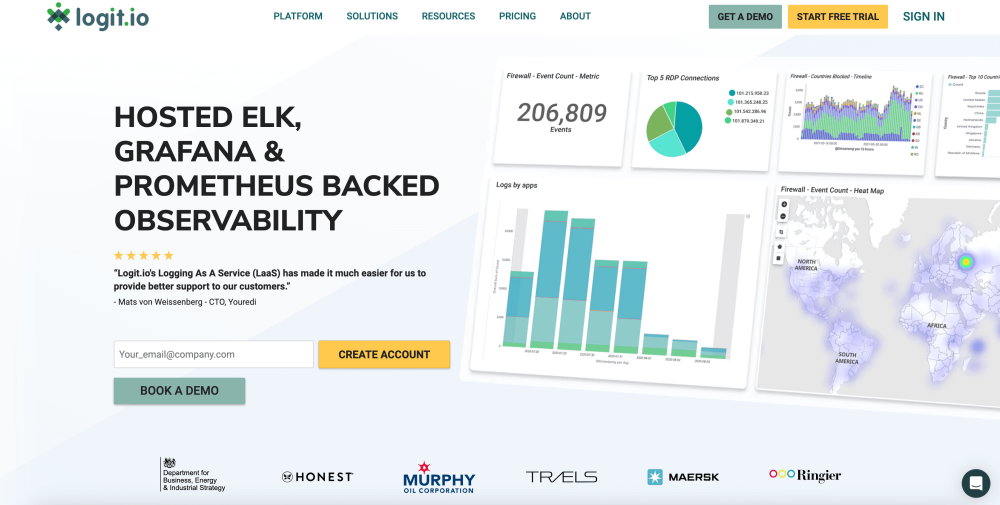
Logit.io is a powerful and cost-effective observability platform that provides numerous open-source tools as hosted solutions, such as Hosted Grafana and Hosted OpenSearch Dashboards. With Hosted OpenSearch Dashboards from Logit.io, you gain an intuitive browser-based UI as well as numerous visualizations and reporting features, such as built-in charts and table representations that allow you to visualize your data as you see fit. The Hosted OpenSearch Dashboards solution allows you to completely remove the complexities of configuration, setup, and hosting and begin visualizing data in a few minutes. If you're interested in finding out more about hosted OpenSearch Dashboards don't hesitate to contact us or begin exploring the platform for yourself with a 14-day free trial.
Request a Demo
Want to learn more about Logit.io's powerful observability platform? Book a demo and we'll walk you through the extensive capabilities and discuss your requirements in detail.
Observable
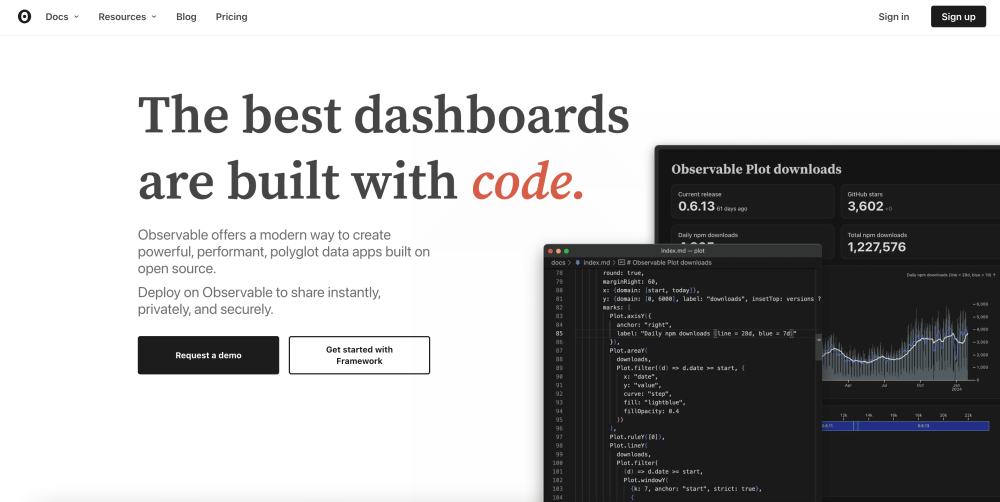
The first tool included in our list of Grafana alternatives is Observable, a solution to create powerful, performant, polyglot data apps built on open source. With this tool, you can code in your preferred editor and check everything in Git. As well as this, you don’t have to wait for a query to load, Observable takes snapshots of data during build so your dashboards load instantly.
Knowi
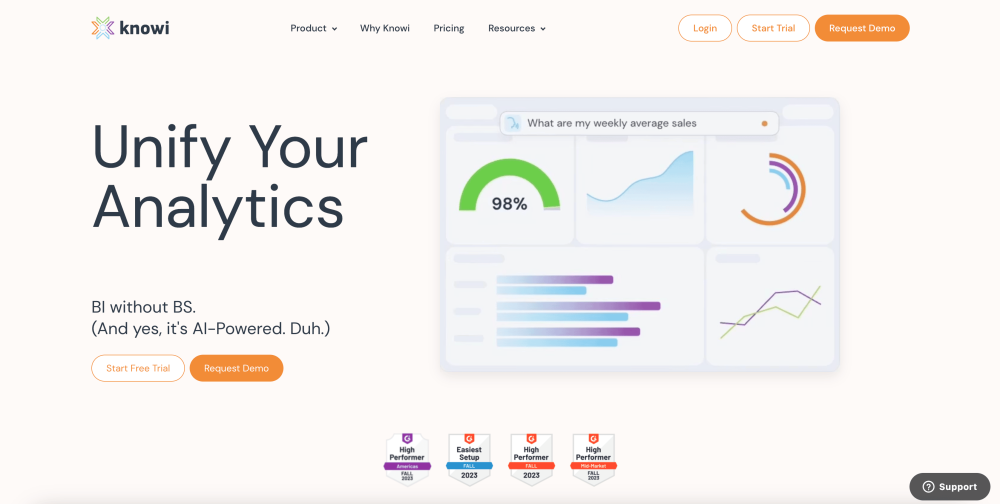
Knowi provides native support for Elasticsearch, as well as other (No)SQL and REST API sources. Unlike traditional ETL (Extract, Transform, Load) processes. The solution virtualizes data, enabling real-time connections to any source and conserving resources. It supports over 30 visualizations and allows custom visualizations using JavaScript. Also, it provides multiple levels of data security including role-based access controls at the dashboard, visualization, or field level, guaranteeing sensitive data is only exposed to authorized users.
SigNoz
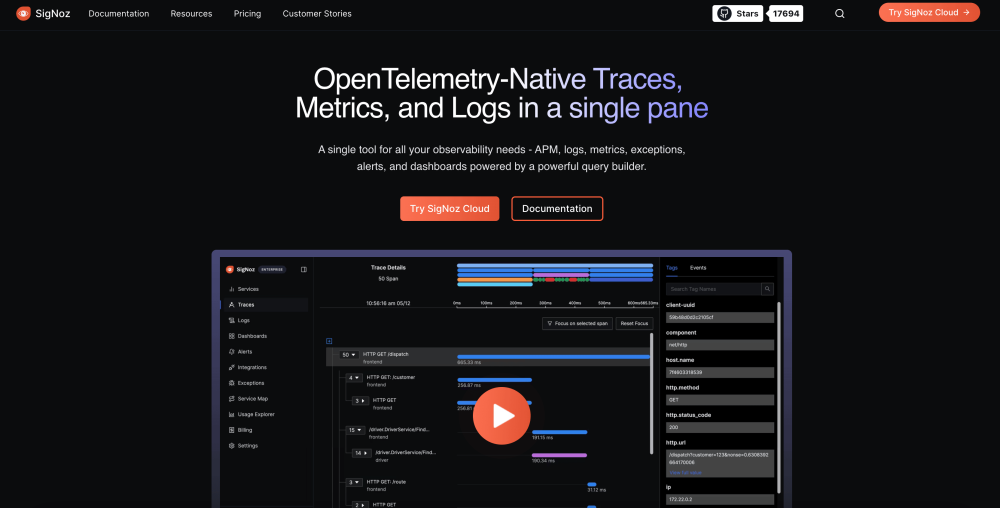
Continuing with our list of the leading Grafana alternatives, the next tool we’ve included is SigNoz, an open-source observability tool that helps you monitor applications and troubleshoot. With this solution, you can create dashboards around any use case like external calls, API endpoints, and JVM metrics. Also, it features an intuitive interface that makes it easy to navigate and visualize complex data, facilitating quick diagnostics and decision-making.
SquaredUp
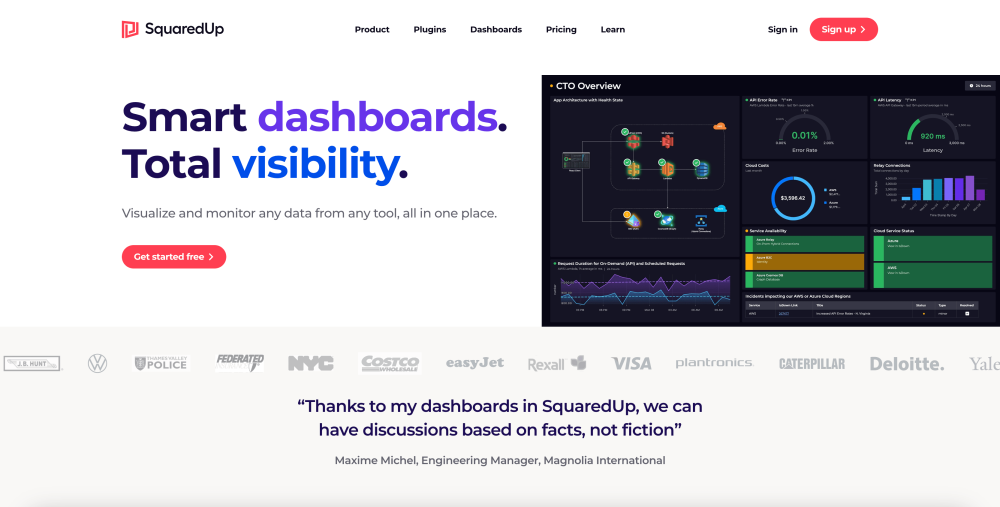
SquaredUp offers a super-flexible dashboard designer that lets you build the views you need, without the steep learning curve you might expect, simply point-and-click to add data. The solution offers an extensive library of visualization options, allowing you to present your data in the most appropriate way for your organization. As well as this, you can remove your data from SquaredUp and drop it into Excel, Sheets, Notion, or many other table-shaped data tools.
Datadog
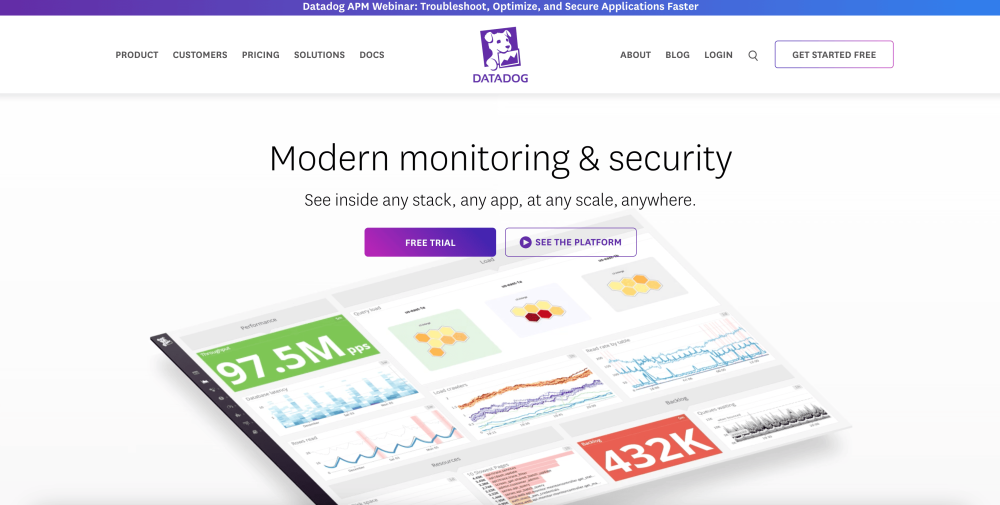
Datadog is a monitoring and analytics platform, that can act as a strong alternative to Grafana. It provides deep integration over a wide array of services with real-time observability over infrastructure, applications, logs, and user experience. The solution offers support for advanced, custom dashboards, advanced alerting, and extensive cloud environment support making it the perfect solution for DevOps and IT teams.
Knime
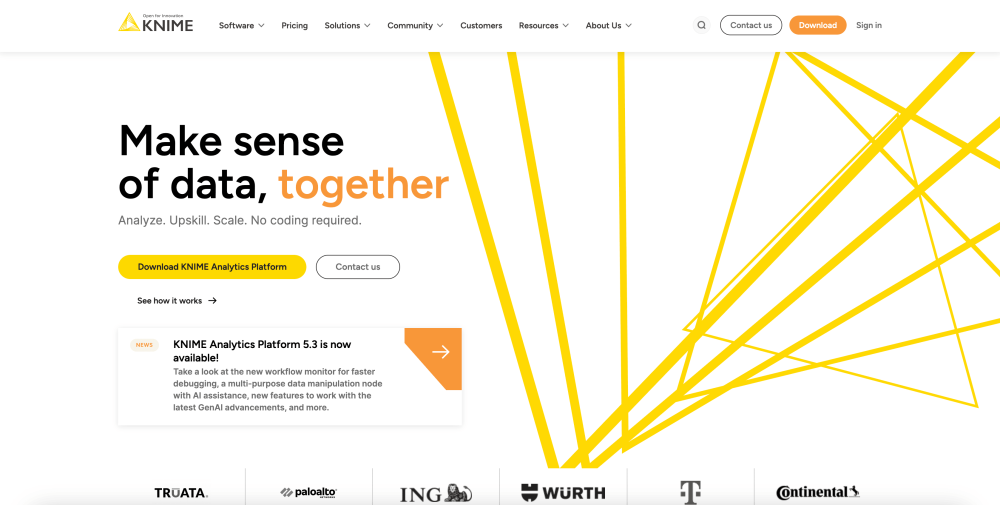
Knime is a complete platform for end-to-end data science, from creating analytic models to deploying them and sharing insights within your organization. With this solution, you can aggregate, sort, filter, and join data on your device, in-database, or in distributed big data environments and then explore this data with interactive charts and visualizations. Additionally, you can automatically create visualizations with a genAI assistant.
New Relic
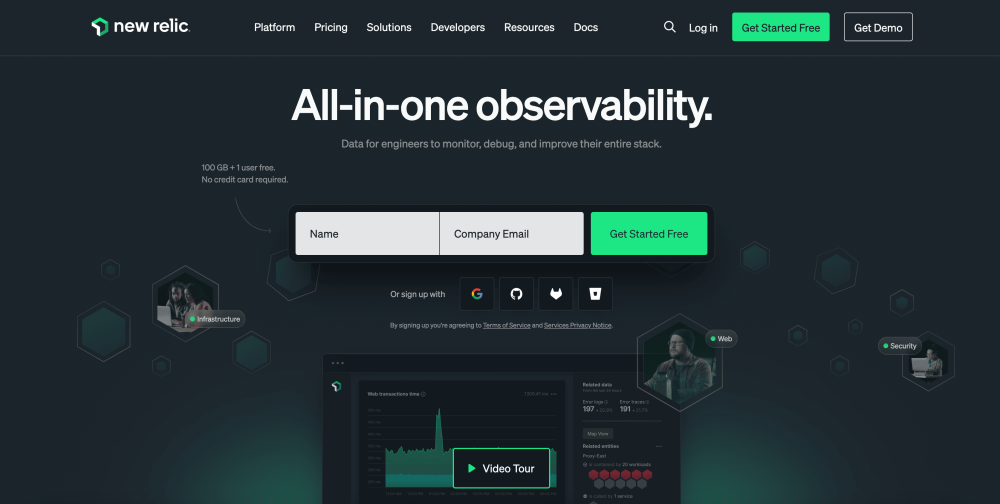
New Relic is a full observability platform that stands out as a good Grafana alternative. The solution offers extensive characteristics including, high-end data visualization techniques with customizable Dashboards, robust alerting and anomaly detection, distributed tracing, and AI-powered deep insights. New Relic allows easy integration with nearly every type of data source and offers a wide range of querying possibilities.
Redash
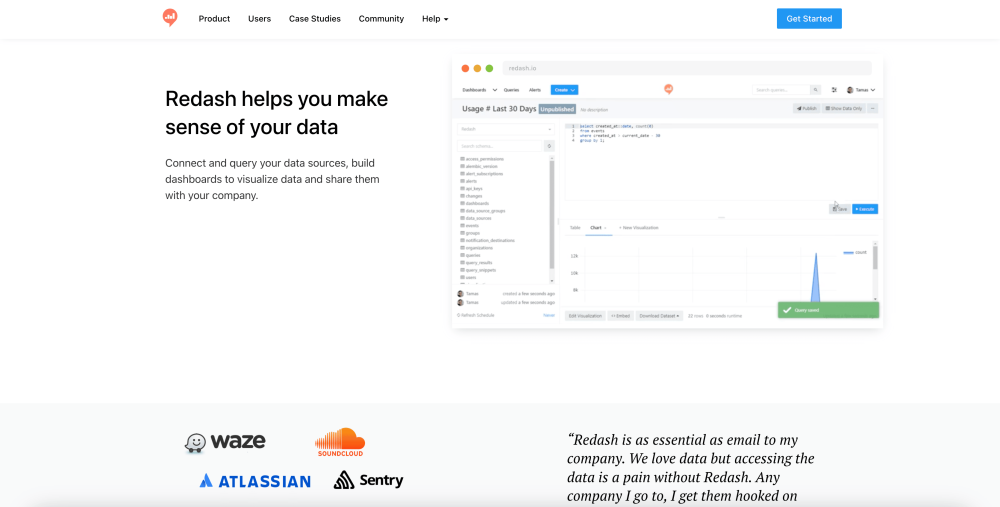
Redash is an open-source data visualization tool that enables you to connect and query your data sources and build dashboards to visualize your data. With this solution, you can easily visualize your results in various formats, such as charts, cohorts, pivot tables, and boxplots, and gather information from numerous sources into thematic dashboards. As well as this, you have the ability to share dashboards on a URL or embed widgets anywhere.
Domo
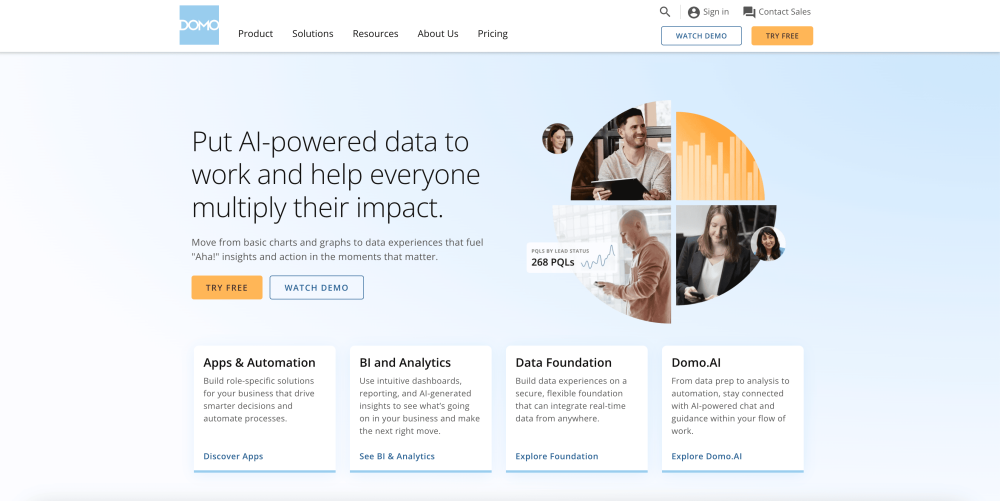
The final tool included in our list of Grafana alternatives is Domo, a business intelligence platform with powerful data visualization capabilities. Every dashboard that’s created with Domo is automatically usable on any device, meaning you don’t need to create a separate dashboard to view on mobile. Also, Domo comes with over 150 chart types and utilizes simple drag-and-drop tools.
If you've enjoyed this article why not read The Top 30 Grafana Dashboard Examples or The Leading Power BI Alternatives next?