Resources
7 min read
Last updated:
Grafana is an immensely popular monitoring and observability tool. The platform offers a wide range of capabilities, however, it can be a difficult tool to fully grasp but once it's deeply understood it can be extremely beneficial to your team and organisation. Therefore within this article, we will outline some of the best online Grafana tutorials and courses that provide great knowledge of the entire tool to ensure that you get the most out of Grafana.
Grafana is regularly utilised in conjunction with additional monitoring and observability tools such as Prometheus, Logit.io, Elasticsearch, and others, to produce extensive monitoring solutions for multiple applications and systems. It issues a user-friendly way to attain insights into system performance, troubleshoot issues, and visualize data trends over time.
Contents
- What is Grafana?
- Grafana Tutorials
- Udemy (Grafana)
- Udemy (Grafana Master Course)
- MindMajix (Grafana Training)
- LinkedIn Learning (Graphite and Grafana)
- PluralSight (Building Dashboards from Prometheus Data in Grafana)
- Coursera (Monitoring Kubernetes Cluster Using Promethues and Grafana)
- AWS Skill Builder (Amazon Managed Grafana - Getting Started)
- Pluralsight (Observability with OpenTelemetry and Grafana)
What is Grafana?
Grafana is an open-source, web-based platform for monitoring and observability. It is most commonly utilised to view and analyze time-series data, making it particularly favoured in the fields of infrastructure monitoring, application performance monitoring, and real-time analytics. Grafana supplies a workable and customizable interface for producing dashboards and panels that present data in a range of different formats, including graphs, charts, tables, and maps.
A great feature of Grafana is the ability to integrate plugins to enhance the already extensive capabilities of the tool. Grafana's plugin system authorizes the implementation of supplementary features and data sources. The Grafana community and third-party developers have produced multiple plugins and extensions, expanding the potential of the tool.
Also, another significant feature of Grafana, and potentially the most common is the creation of dashboards. Users can produce and design dashboards by affixing panels that present data from selected data sources. Grafana supplies a drag-and-drop interface for organising and constructing panels, making it simple to produce informative and interactive dashboards.
A final beneficial capability of Grafana is user management and access control. Grafana enables user authentication as well as access control features, to make certain that only authorized users can acquire and edit dashboards and data sources. Also, the tool allows multiple authentication methods and can amalgamate with LDAP, OAuth, and other identity providers.
Grafana Tutorials
To help you and your team strongly appreciate the full capabilities of Grafana, we have researched and produced a list of the best online courses and tutorials currently available. These tutorials will effectively teach you the concepts of Grafana to ensure that you’ll feel comfortable using the tool, however, your organisation aims to use it.
Udemy (Grafana)
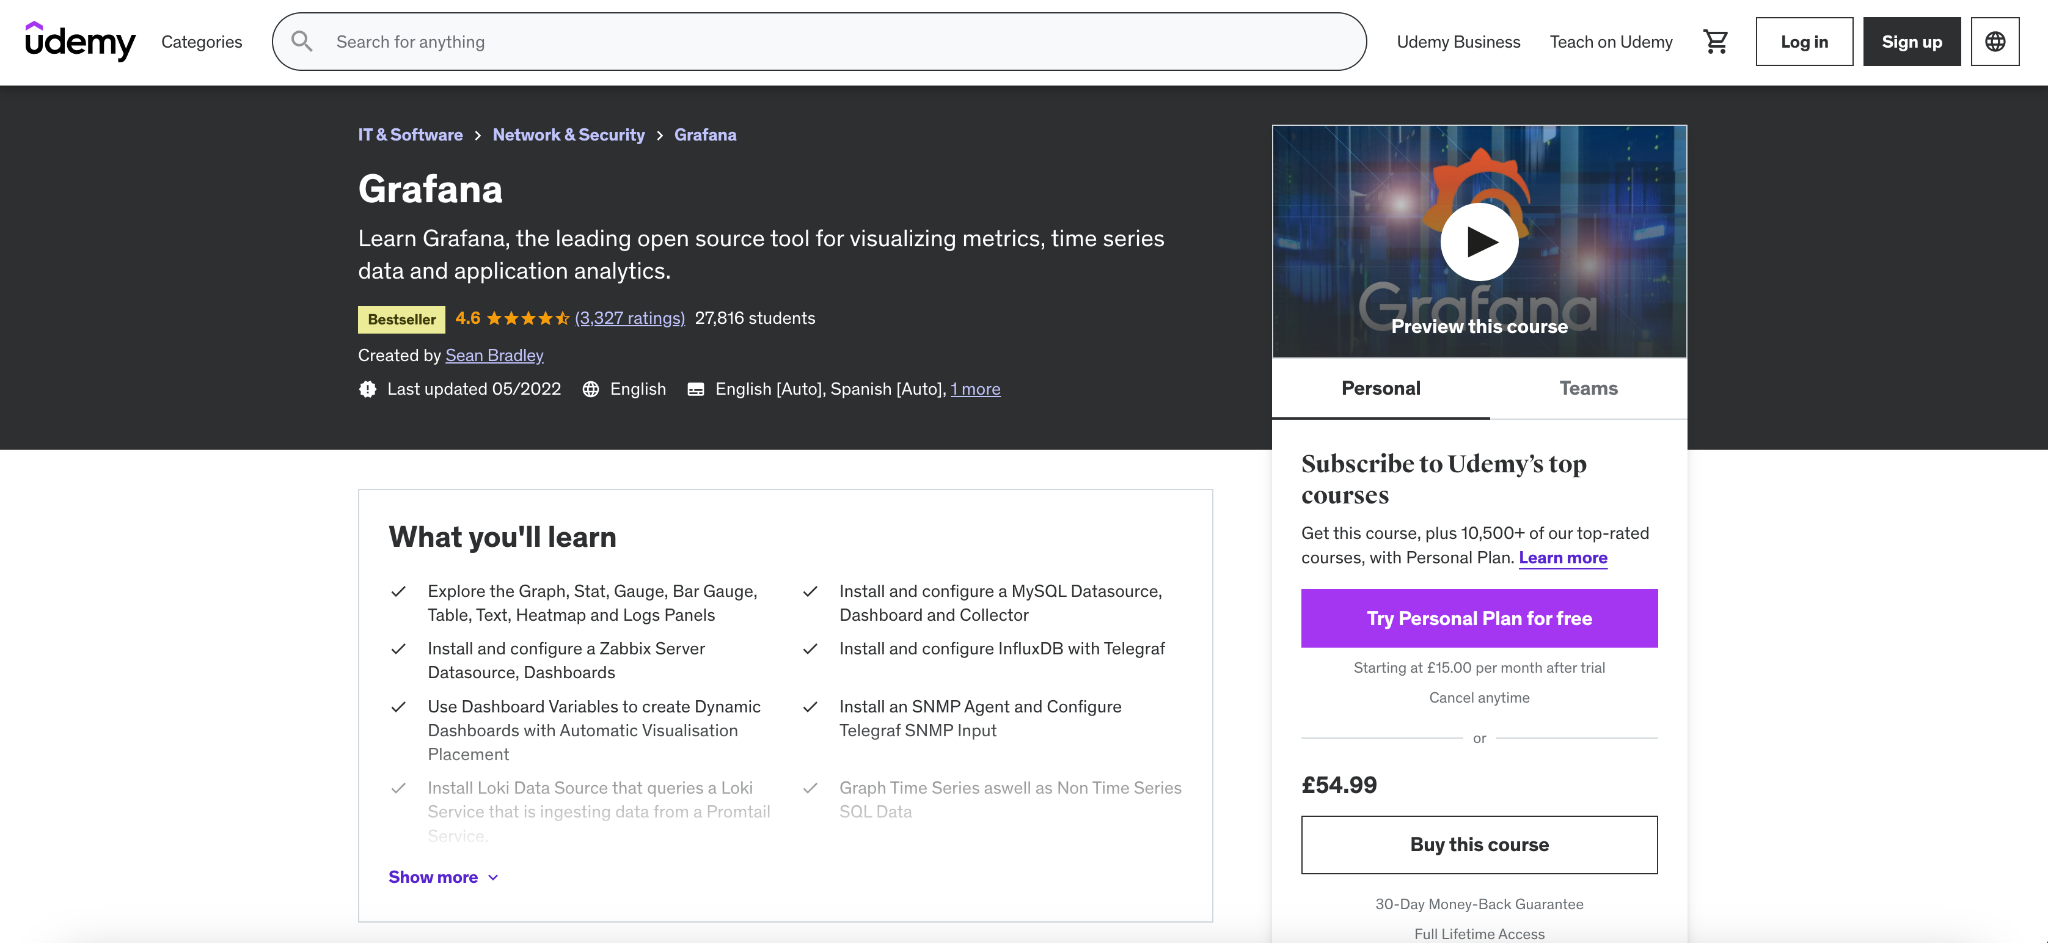
Beginning with one of the most popular courses available, Udemy. The course has received over 3,000 reviews and averages 4.6 out of 5 stars. It includes 6.5 hours of on-demand videos with a total of 54 lectures, meaning if you wanted to you could easily get through the entire course in a day.
The Udemy Grafana training provides a great overview of almost all aspects of Grafana. This includes but is not limited to, learning how to install and configure a Zabbix Server data source and dashboards, use dashboard variables to create dynamic dashboards with automatic visualisation placement, setup an Elasticsearch server with Filebeat and Metricbeat services, and create a domain name and install an SSL certificate for the Grafana server. The course costs £54.99, but you can subscribe to Udemy for £14.99 p/m, which if you complete the course within that month this will work out much cheaper. Also, upon completion of this course, you will receive certification.
Udemy (Grafana Master Course)
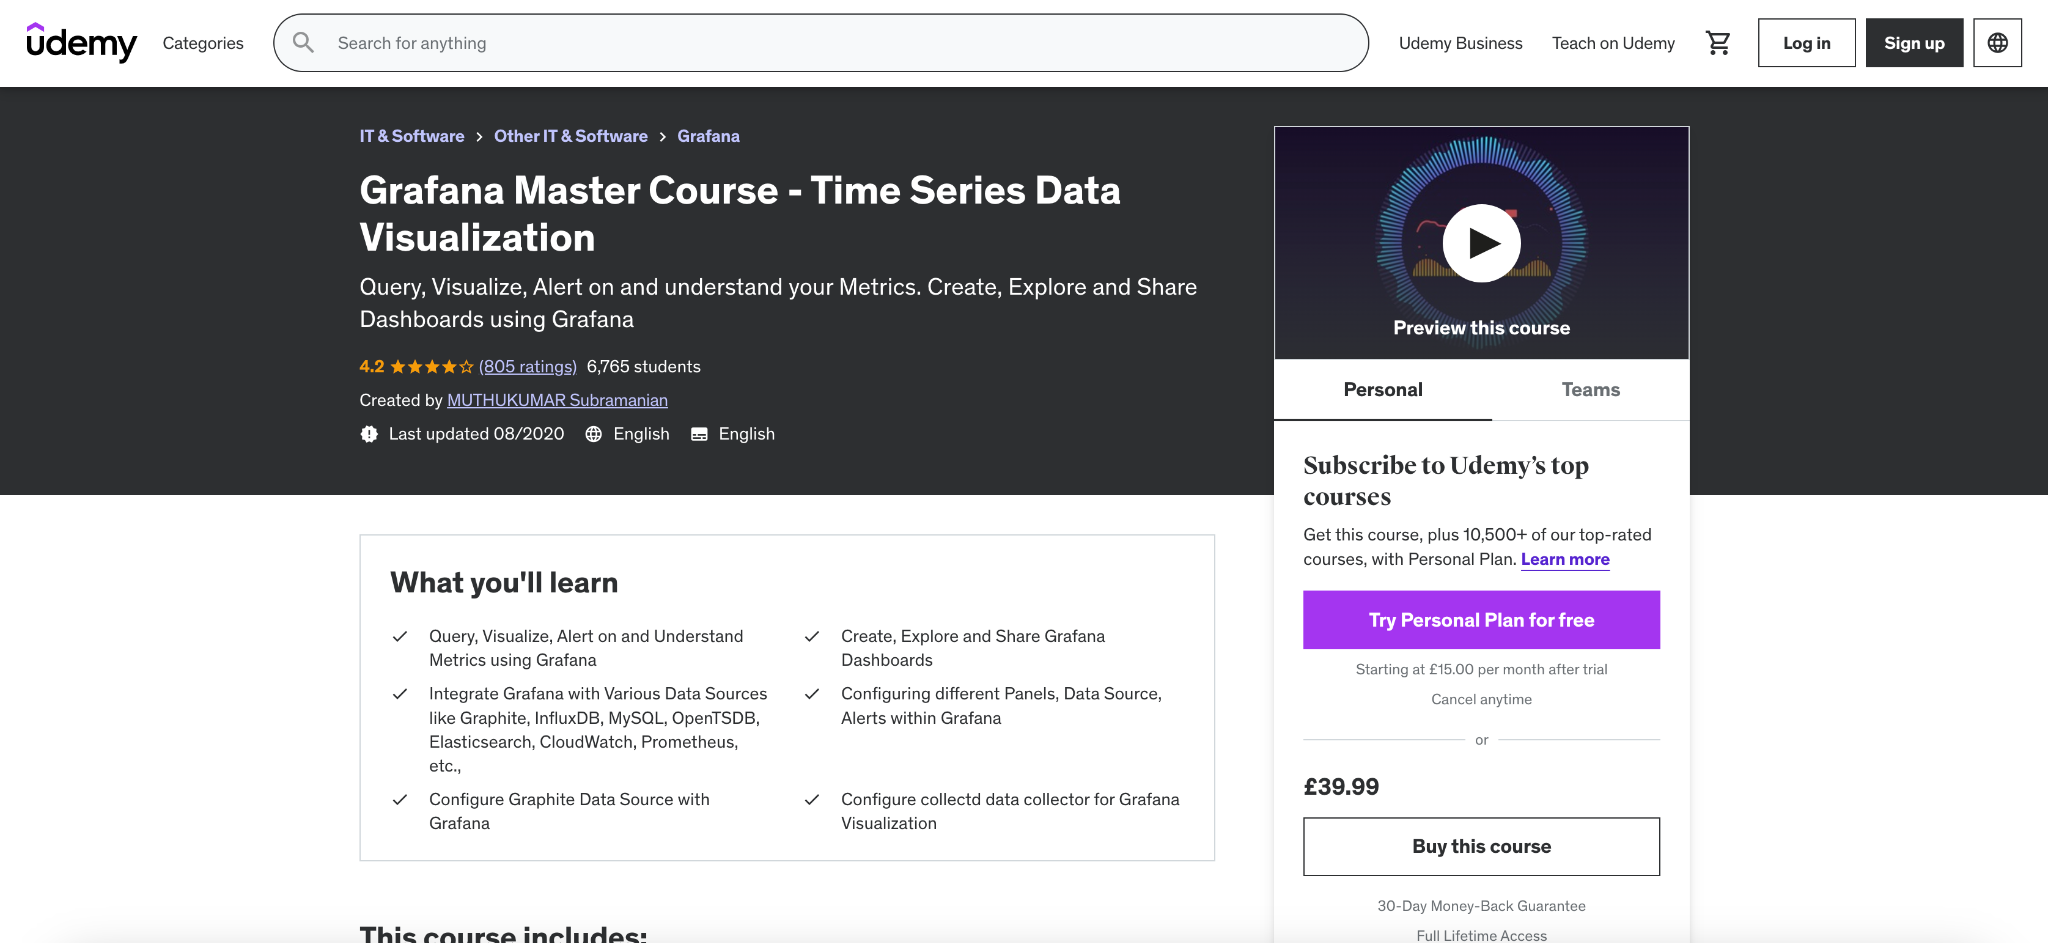
If you want to get a true grasp of Grafana and deepen your understanding of the tool then the Udemy Grafana Master Course is a great option. This course has received over 800 reviews and averages 4.2 out of 5 stars. It will include 3.5 hours of on-demand videos, with 14 downloadable resources making up 43 lectures.
This Grafana tutorial will include but is not limited to learning how to integrate Grafana with various data sources like Graphite, InfluxDB, MySQL, OpenTSDB, Elasticsearch, CloudWatch, Prometheus, etc., query, visualize, alert on and understand metrics using Grafana, and learn how to configure different Panels, Data Source, Alerts within Grafana. The Udemy Grafana Master Course costs £39.99, but as we mentioned in the previous example, you can subscribe to Udemy for £14.99 p/m and have the ability to complete both the Grafana and Grafana Master course within the first month. Also, like the first Udemy course, you will receive a certificate upon completion.
MindMajix (Grafana Training)
Similar to the Udemy Grafana course, this MindMajix Grafana Training provides users with a general overview of the tool and its capabilities. Whilst there aren’t too many reviews for this specific course (only 5 reviews, all of which rated 5 stars), MindMajix as a company are rated 4.7 out of 5 stars on Trust Pilot. What’s unique about the MindMajix course is that you can select the learning path that suits you best. Either choose from ‘self-paced’ videos’ where you will receive 25 hours of e-learning videos that you can go through in your own time. Or you can choose ‘live online’ where you’ll receive 25 hours of remote classes in Zoom/Google Meet.
This Grafana tutorial will include but is not limited to, installation and configuration, Grafana panels, alerts, Grafana dashboard organizing, Grafana administration and management, and the building blocks of Grafana. MindMajix currently doesn’t advertise pricing for this course, if you want to find out more you’ll have to register your interest on the course webpage.

LinkedIn Learning (Graphite and Grafana)
This LinkedIn course combines a few monitoring tools into one tutorial, StatsD, Graphite and Grafana. This course has received almost 200 reviews and has a rating of 4.5 out of 5 stars. The combination of different monitoring tools makes this Grafana tutorial unique. The course is split into four sections, metrics gathering with StatsD, Graphite: metrics aggregation, Grafana: metrics visualization, and using Graphite and Grafana together. If you wish to get a better grounding of a selection of monitoring tools and how they can work together, then this is the course for you.
This Grafana tutorial is listed as ‘advanced’ and has almost 2 hours of lessons/material. Upon completion of this course, you will receive a certificate, which can be added to your LinkedIn profile. Lastly, the course costs £29.99, however, you can sign up for a LinkedIn subscription and receive your first month free.

PluralSight (Building Dashboards from Prometheus Data in Grafana)
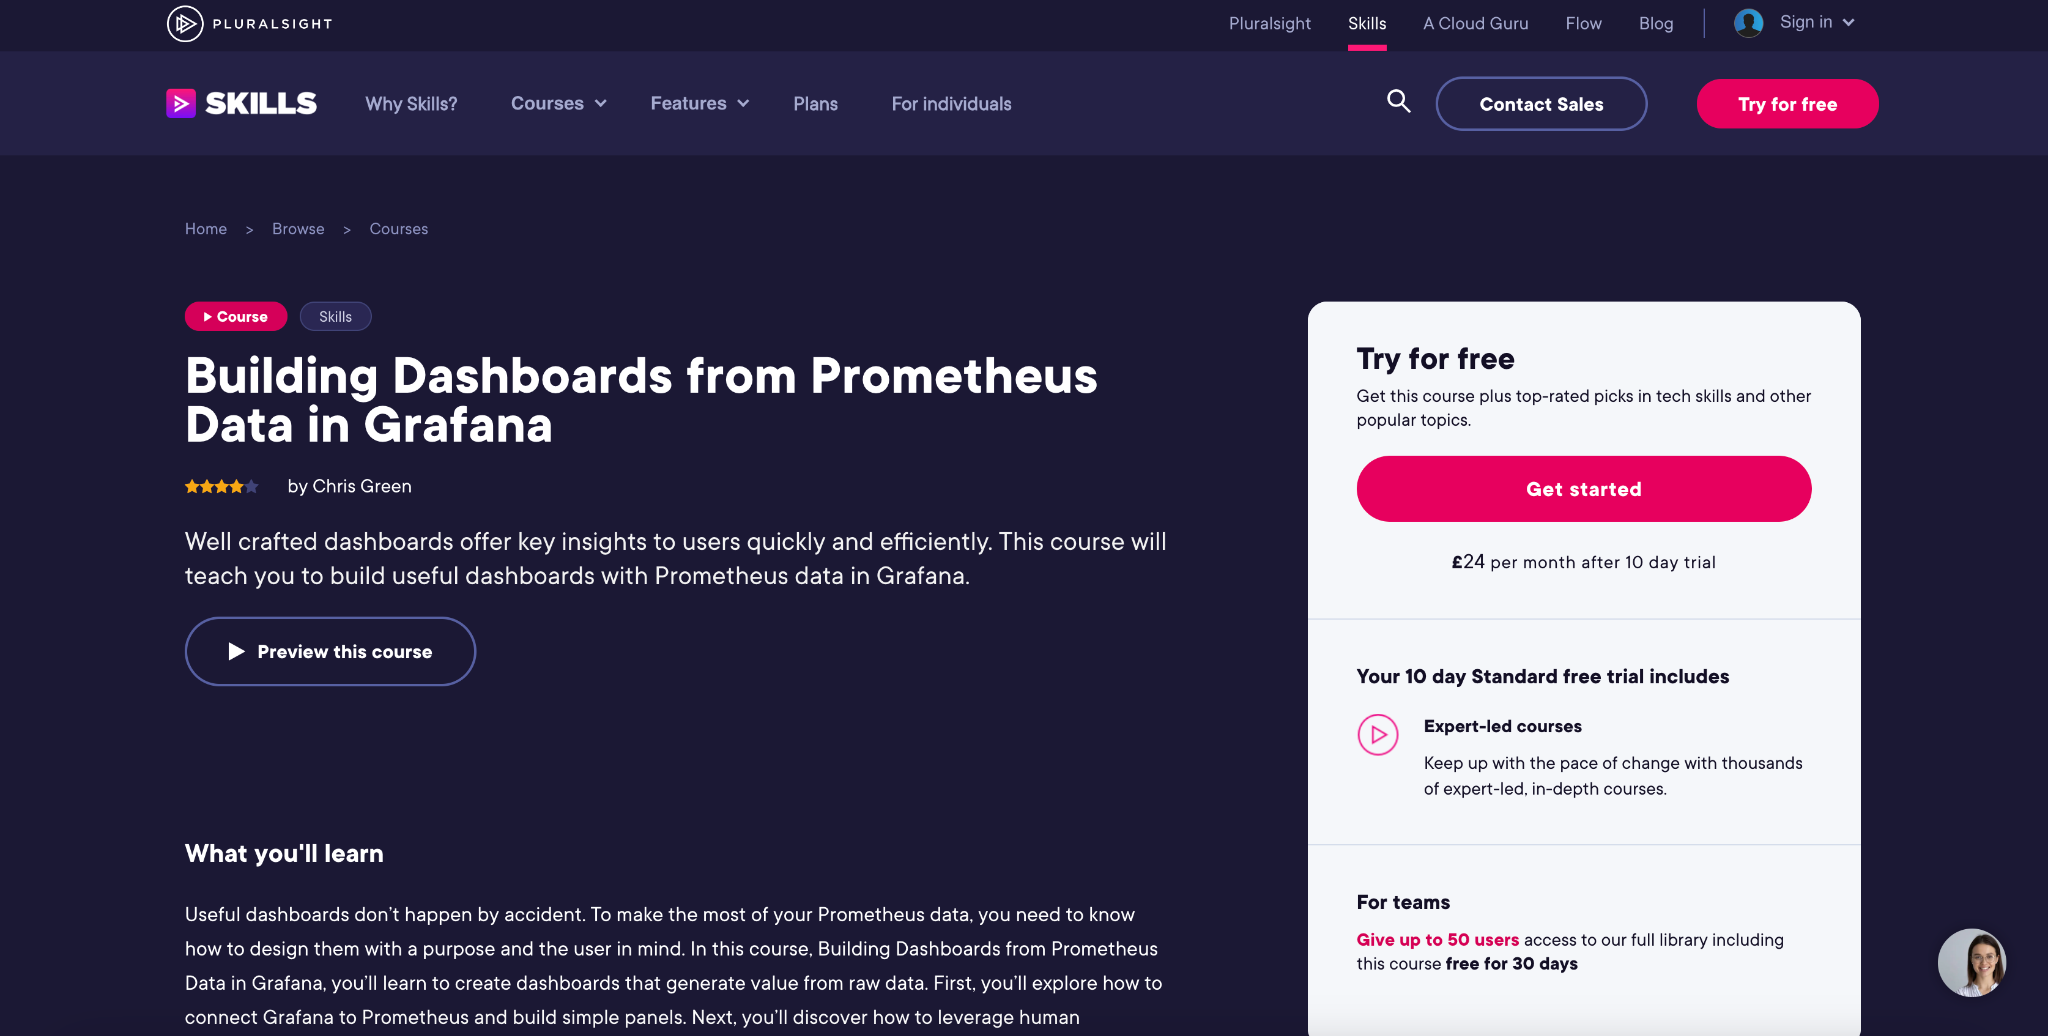
This Grafana tutorial is most appropriate if you’re looking for a more specific use case of Grafana, in this example creating dashboards from Prometheus data. This course is listed as ‘intermediate’ for difficult and is rated 4 out of 5 stars but only from 21 reviews. The course is split into three main sections, accessing Prometheus data from Grafana, designing useful dashboards, and managing dashboards. To purchase the course, you have to enroll on PluralSights subscription at £24 p/m. But you get a 10-day trial for this subscription and as the course has under 2 hours of material, it’ll be possible to complete the course in these 10 days.
Coursera (Monitoring Kubernetes Cluster Using Promethues and Grafana)
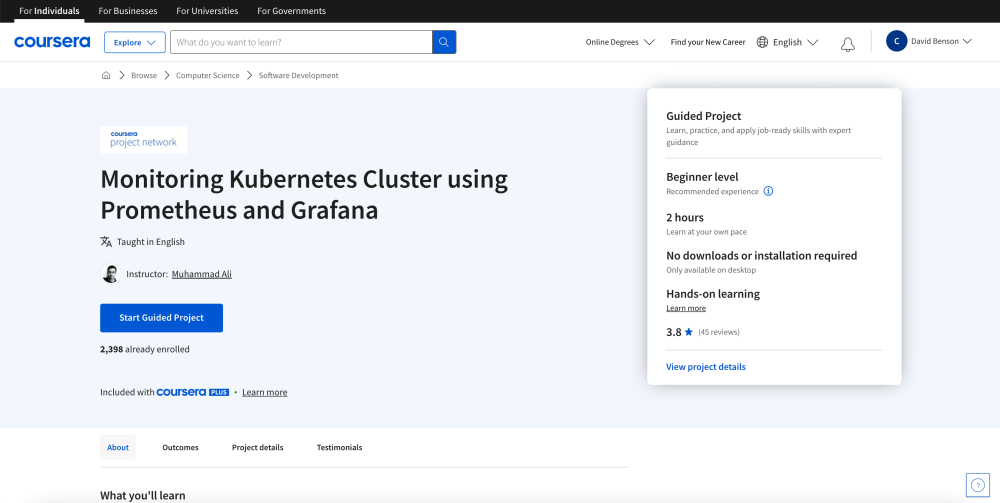
The Coursera Grafana tutorial enables you to learn how to create a Kubernetes cluster using kind, create deployment and service in the Kubernetes cluster, and deploy and explore the Kubernetes cluster using Web-UI, Prometheus and Grafana. The course is described as 'beginner' and has a rating of 3.8 stars out of 5 from 45 reviews. This Grafana tutorial is more specific and shorter than some of the other examples on this list, taking only two hours to complete. However, the price reflects this at only £7.
AWS Skill Builder (Amazon Managed Grafana - Getting Started)
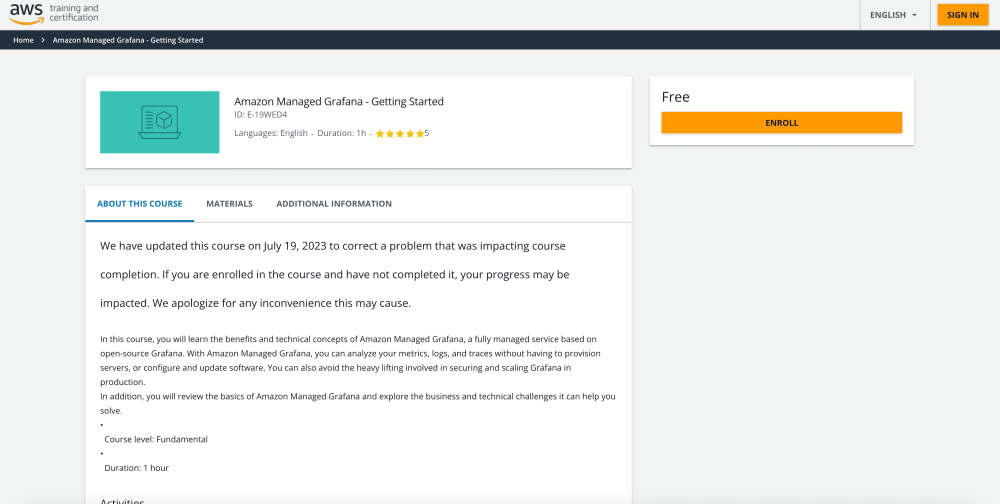
The Grafana tutorial provided by AWS Skill builder is a course for a specific use case, Amazon Managed Grafana. The course will teach you the benefits and technical concepts of Amazon Managed Grafana, a fully managed service based on open-source Grafana. The course is less 'hands-on' than some of the other examples in the list and follows a format of presentations, demonstrations, and knowledge checks. This Grafana tutorial is listed as 'fundamental' and is estimated to be completed in an hour. Finally, the course is entirely free to enroll and complete.
Pluralsight (Observability with OpenTelemetry and Grafana)
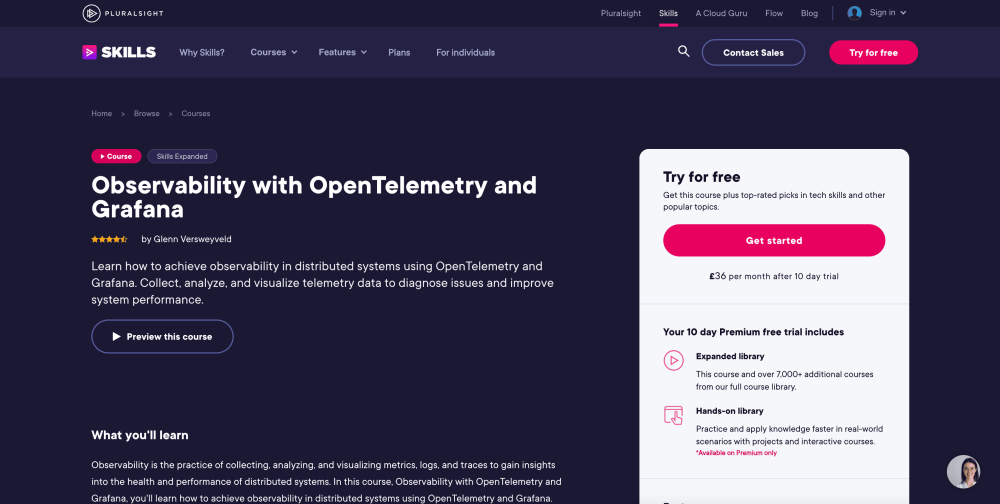
The final Grafana tutorial in this article is a Pluralsight course, observability with opentelemetry and Grafana. With this course you will discover how to attain observability in distributed systems utilizing OpenTelemetry and Grafana.
This Grafana tutorial is split into 5 key sections, overview of observability, observability project architecture, monitoring and alerting, logging and tracing, and opentelemetry in finer detail. The Pluralsight training is rated 4.5 stars out of 5 from 24 reviews and is listed at 'intermediate' level. To gain accesss to this course you will need to subscribe to Pluralsight at £36 per month.
If you enjoyed this article, why not read our blog on The Top 25 Grafana Dashboard Examples or Grafana vs. Kibana?
