Resources
5 min read
Kibana is a visual interface tool that offers the ability to explore, visualize, and create dashboards for data generated by Elasticsearch clusters. The solution is widely utilized for log and event data analysis, application performance monitoring, security analytics, and more. Also, Kibana offers ready-to-use filters and aggregations that enable effortless execution of various analytics tasks such as top-N queries, histograms, and trend analysis with minimal effort.
Kibana has grown in popularity due to it being a feature-rich, free, open-source, data visualization tool but it isn’t without its drawbacks. A common issue that users have experienced with Kibana is that the tool is restricted to using Elasticsearch as its exclusive data source, which can pose scalability difficulties for organizations looking to scale Kibana independently.
In addition to this, numerous users have felt that the tool is complex, particularly in configuring and managing the Elastic Stack. Comprising multiple components, each with its own configuration settings and dependencies, fine-tuning the stack to meet specific requirements can be time-consuming, particularly for users unfamiliar with the system.
These drawbacks and dissatisfaction that users have experienced with Kibana have led them to pursue other data visualization solutions. However, this process is not simple, it can be particularly time-consuming and difficult to know that you’ve found the most appropriate solution for your organization. So, to help you with this, in this article we will outline the leading Kibana alternatives.
Contents
Kibana Alternatives
Logit.io
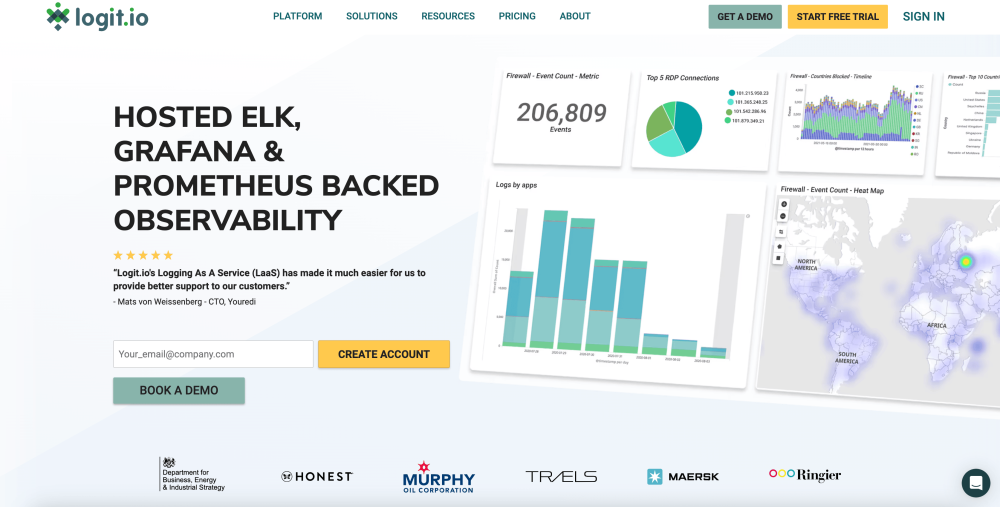
Logit.io is a powerful and cost-efficient observability platform built upon the ELK stack that offers numerous open-source tools as hosted solutions. As logit.io is built on the ELK stack hosted Kibana is available to all users. Still, if this isn’t your preferred data visualization tool, you also have access to Hosted Grafana and Hosted OpenSearch Dashboards. With these tools, you’re able to launch them directly from the Logit.io dashboard and begin creating stunning visualizations in a matter of minutes.
Hosted solutions from Logit.io offer you the best features and latest updates from each tool but without strenuous maintenance and configuration. This allows you and your team to concentrate your efforts on activities that are crucial to your organization. If you’re interested in finding out more about the Logit.io platform feel free to contact us or begin exploring the platform for yourself with a 14-day free trial.
Request a Demo
Want to learn more about Logit.io's powerful observability platform? Book a demo and we'll walk you through the extensive capabilities and discuss your requirements in detail.
Knowi
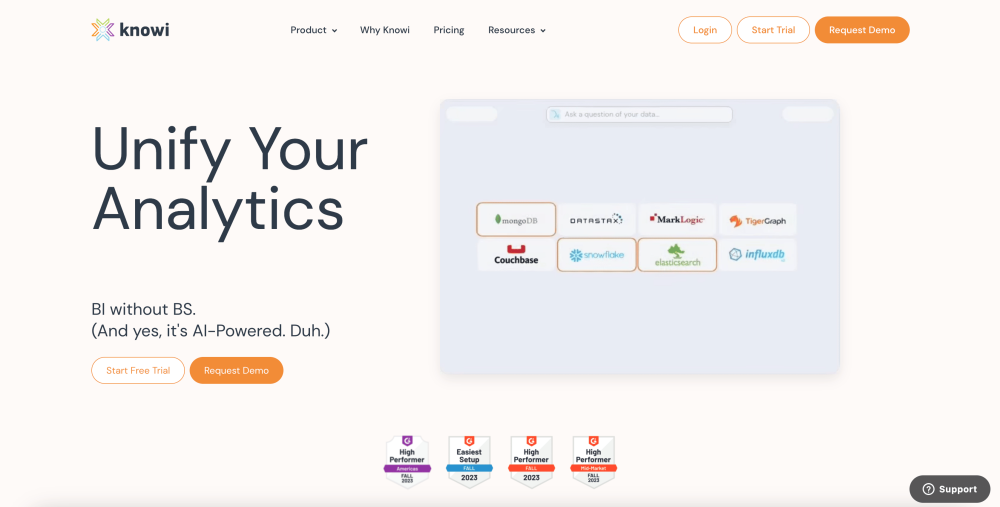
The first tool included in our list of Kibana alternatives is Knowi, a full-stack platform offering integrations for a variety of data sources and empowering users with AI and search-based analytics. The solution provides 30+ visualization options that can be customized and styled exactly like your application. Also, it supplies numerous levels of data security including role-based access controls guaranteeing sensitive data is only exposed to authorized users.
Datawrapper
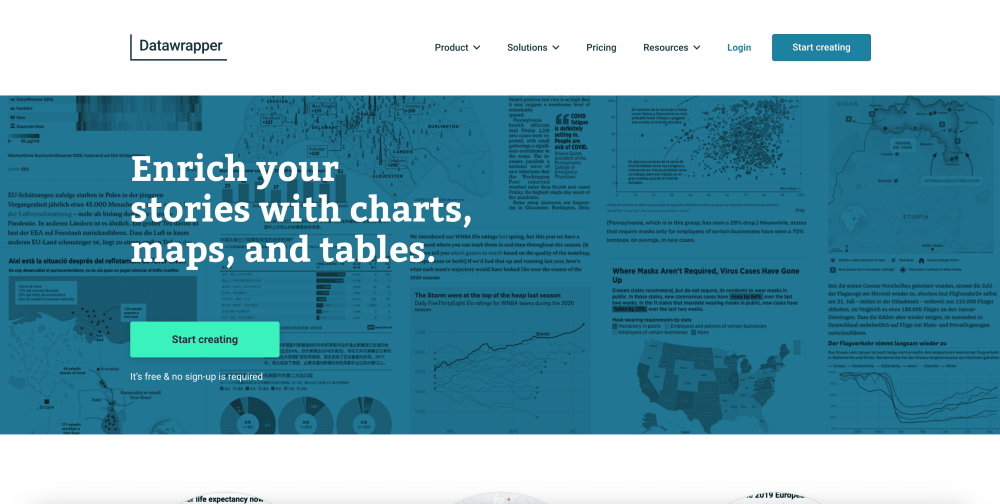
Datawrapper is another data visualization tool that enables you to show your data as charts, maps, or tables with a few clicks. Datawrapper aims to allow everyone to create visualization so the tool has no code or expertise required. The solution provides 20 interactive chart types, 3 interactive and responsive map types, and various responsive tables offering numerous styling options.
Grafana
Grafana is a versatile open-source platform for monitoring and observability. It excels in data visualization, offering a wide range of customizable dashboards, and supports multiple data sources, including Elasticsearch, Prometheus, Graphite, and more. Key features include advanced alerting, plugin extensibility, and a rich set of pre-built panels and integrations. Unlike Kibana, which is limited to Elasticsearch, Grafana provides greater flexibility by integrating with various databases, making it ideal for organizations seeking a more adaptable and scalable monitoring solution.
Datadog
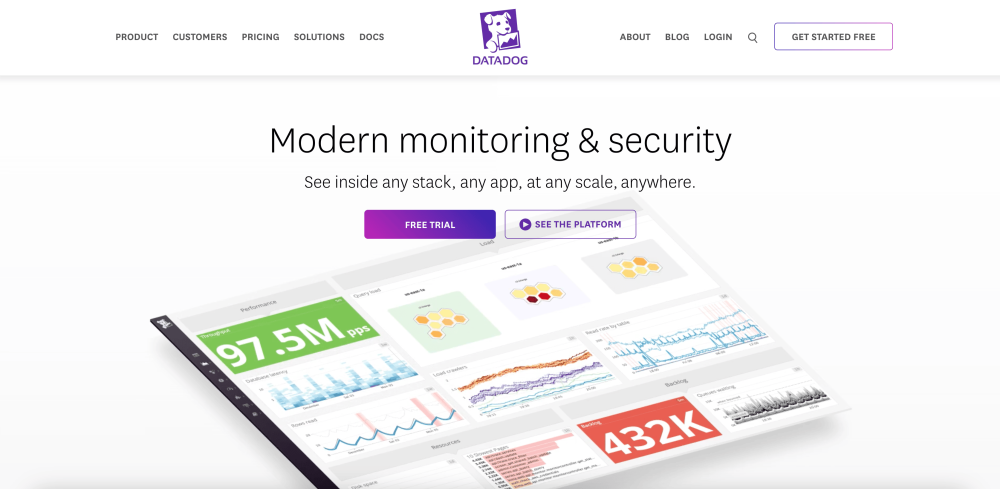
The next tool included in our list of Kibana alternatives is the observability platform Datadog. With Datadog’s out-of-the-box dashboards, you can analyze data from across your entire system in a single pane of glass. As well as this, you can autogenerate custom dashboards via the API for quick time creation. Lastly, it offers collaboration features to share dashboards with anyone in your organization during outages or ongoing investigations.
SigNoz
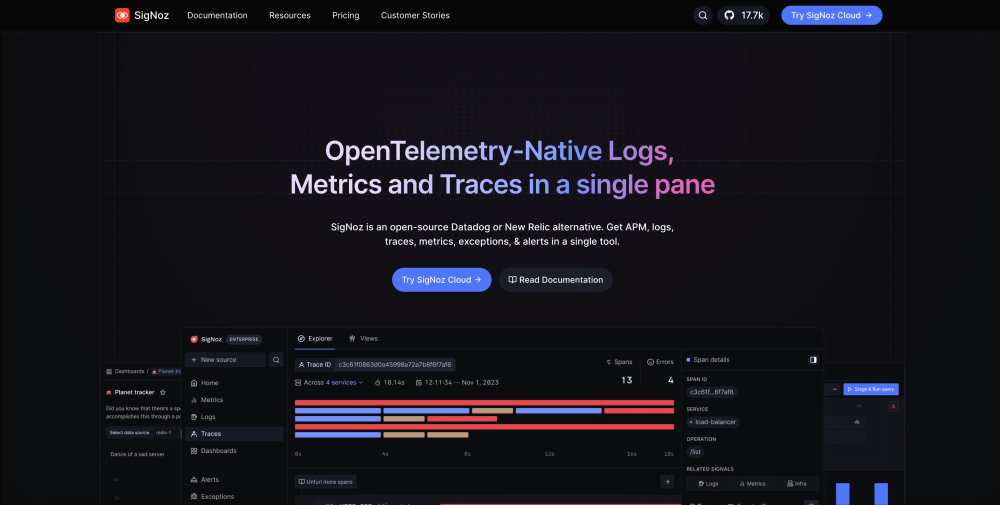
SigNoz is an open-source observability platform designed to monitor modern applications, offering a unified solution for metrics, logs, and traces. supports OpenTelemetry, providing seamless integration with various data sources and delivering powerful visualizations through its intuitive dashboards. The solution enables end-to-end observability, making it a robust choice for organizations aiming to enhance their application monitoring and troubleshooting capabilities.
Power BI
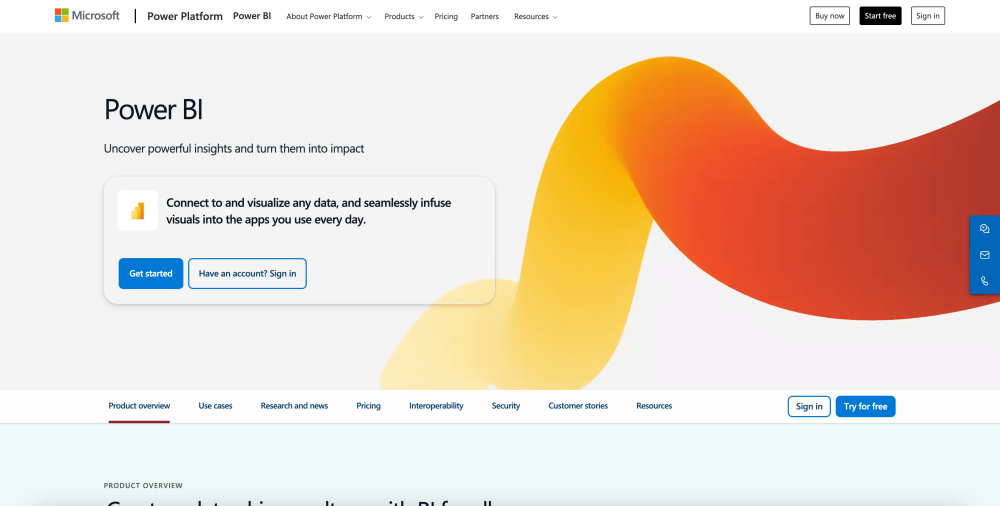
Power BI is a data visualization and business intelligence tool from Microsoft that often works best alongside other Microsoft products such as Azure and Office. The solution enables you to turn your data into visuals with advanced data-analysis tools, AI capabilities, and a user-friendly report-creation tool. As well as this it offers over 500 free connections allowing you to present and analyze data from a wide range of sources.
BetterStack

Continuing with our list of Kibana alternatives, another tool is BetterStack, a log management and metrics monitoring platform. BetterStack provides a variety of visualization options as the solution includes Grafana built in to offer you numerous plug-and-play dashboards to visualize your logs and metrics. This is a similar tool to Kibana in that it offers data visualization mainly for logs but with the addition of metrics, you’re able to gain more from the dashboard capabilities.
Sematext
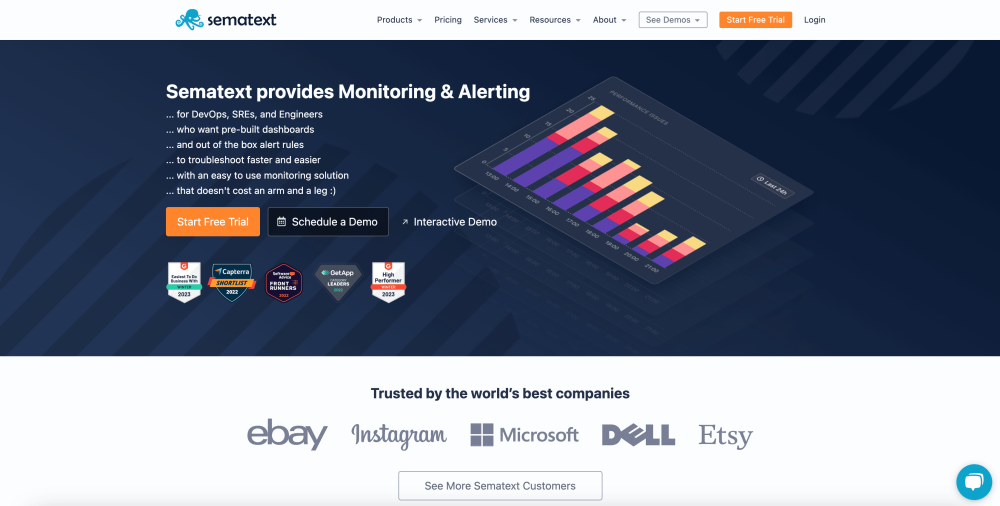
Sematext is a monitoring and log management platform for full-stack observability of your IT infrastructure. It offers data visualization functionality for users to create custom dashboards and visualizations for logs, metrics, and events monitoring in real-time, including automated discovery and mapping of network connections, real-user monitoring, and anomaly detection. Sematext's visualization tools help uncover insights, identify performance issues, and track key metrics across servers, containers, and cloud instances.
Observable
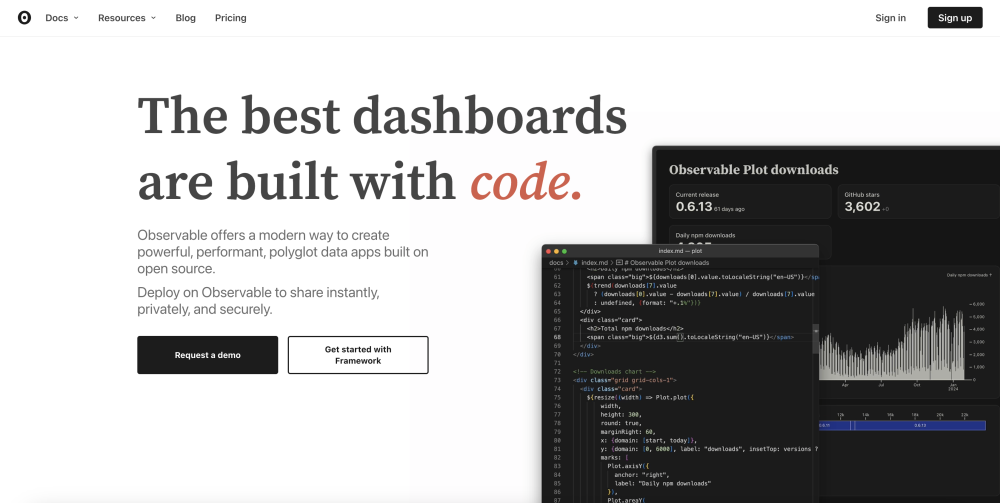
The final tool included in our list of Kibana alternatives is Observable, an open-source data visualization tool that allows you to code in your preferred language. The Observable framework combines the power of JavaScript on the front end for interactive graphics, with any language on the back end for data preparation and analysis. The solution also offers Notebooks where users can quickly access their data and combine text, analyses, and data visualizations in the same place.
If you've enjoyed this article why not read The Leading Power BI Alternatives or The Top 25 Kibana Dashboard Examples next?
