
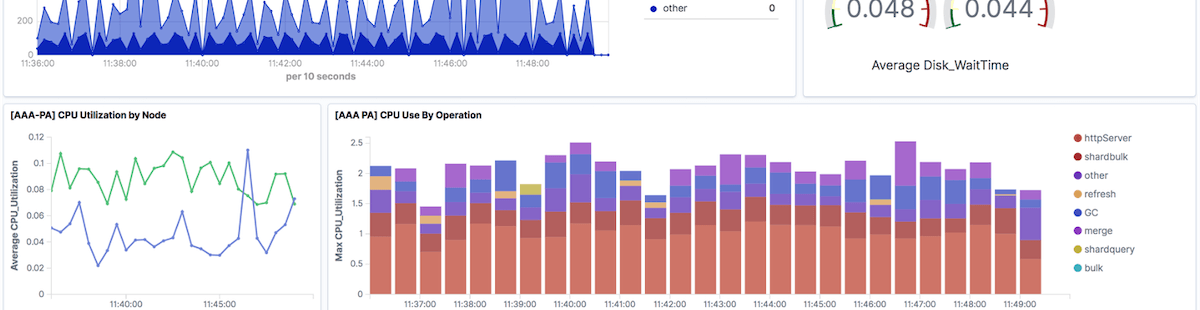

OpenSearch Dashboards is the visualisation user interface for OpenSearch. It is the open-source counterpart to Kibana: Discover, saved searches, and dashboards over log documents. This 2026 guide covers what it is, how it started, whether it is open source, DQL, and how to use it on Logit.io.
On Logit.io that UI is OpenSearch Dashboards on a Logs stack. List indexes, set timezones, then export search results when you have the window. Windows Event Log: Winlogbeat. The Kibana twin: What is Kibana?.
Contents
- What is OpenSearch Dashboards?
- What is an OpenSearch dashboard?
- What is OpenSearch Dashboards used for?
- Is OpenSearch Dashboards open source?
- How did OpenSearch Dashboards start?
- DQL and Lucene
- Start in Discover
- Access control and security
- Alerting
- How many versions of OpenSearch Dashboards have there been?
- Who uses OpenSearch Dashboards?
- How OpenSearch Dashboards handles search
- What features does OpenSearch Dashboards offer for managing data?
- What advanced analytical capabilities does OpenSearch Dashboards offer?
- Core concepts
- Empty Discover
- Can I keep using Kibana instead?
- What OpenSearch Dashboards is not
- OpenSearch Dashboards on Logit.io
What is OpenSearch Dashboards?
OpenSearch Dashboards is the open-source visualisation user interface for OpenSearch. You use it to search log documents, build saved searches, and pin visualisations onto dashboards — the same job Kibana does for Elasticsearch. It is the Apache-2.0 UI that shipped when the OpenSearch project forked the last OSI-licensed Kibana line (7.10.2) after Elastic moved Kibana 7.11+ to SSPL.
On Logit.io it is the default log UI on a Logs stack. Launch Dashboards from the stack, pick an index, and search. Product page: OpenSearch Dashboards. If you still run Elastic, hosted Kibana is on the same account. The Kibana twin of this guide is What is Kibana?.
What is an OpenSearch dashboard?
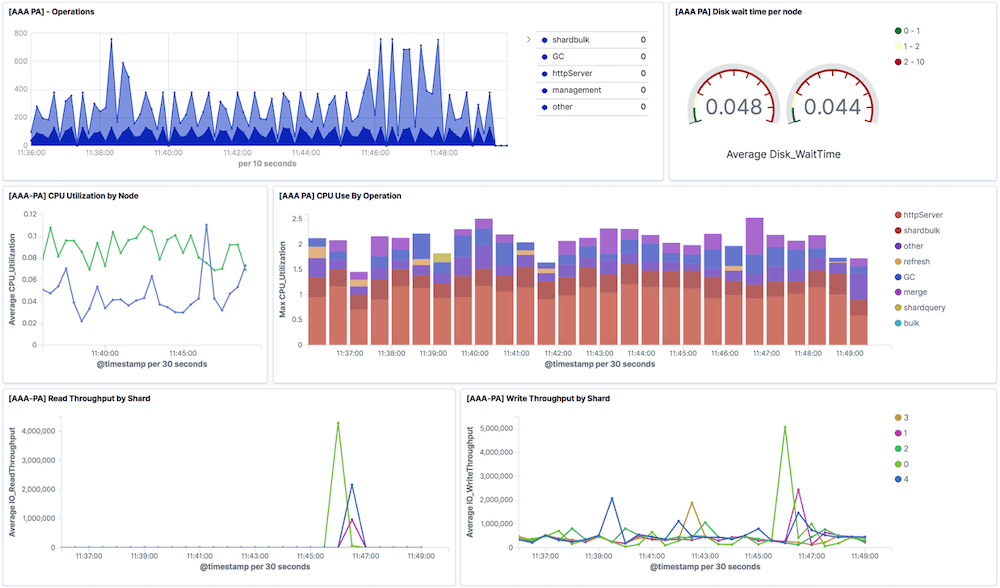
An OpenSearch dashboard is a saved layout of visualisations and saved searches over documents in OpenSearch: histograms of status codes, terms on host.name, a table of failed auths. Formats include line and pie charts, gauges, data tables, heat maps, coordinate maps, and tag clouds. How to add the first visualisation: creating visualisations.
Operator examples (log data, performance, tracing, Auditbeat, web traffic) are in OpenSearch dashboard examples. Kibana-side boards: Kibana dashboard examples.
CPU, memory, and Prometheus histograms belong in Grafana, not in OpenSearch Dashboards. Forcing PromQL-shaped questions into log dashboards is how you get empty pie charts.
What is OpenSearch Dashboards used for?
The leading use case is log and event analysis: unstructured and semi-structured documents shipped into OpenSearch. Typical boards include:
- Linux auth and syslog
- Windows Security (Winlogbeat)
- NGINX and request shape
- Kubernetes workload logs
- Jenkins and CI console output
- Firewall and SSH
- Website uptime from logs
- Vulnerability and audit events
Dashboards also cover observability views that OpenSearch ships as examples (tracing, anomaly detection, performance). Those are still log or trace documents, not a BI suite for sales by region.
Is OpenSearch Dashboards open source?
Yes. OpenSearch Dashboards is released under Apache License 2.0. That is the practical difference from Kibana 7.11 onwards (SSPL). You can use, modify, and redistribute OpenSearch Dashboards under Apache 2.0 terms. Kibana remains Elastic’s product under Elastic’s licence. Side-by-side: OpenSearch Dashboards vs Kibana. Cluster-layer comparison: OpenSearch vs Elasticsearch.
The OpenSearch project publishes a public roadmap on GitHub (OpenSearch Project org). Treat that as the source for upcoming Dashboards features rather than Elastic’s Kibana release notes.
How did OpenSearch Dashboards start?
In 2021 Amazon Web Services and others forked Elasticsearch and Kibana 7.10.2 into OpenSearch and OpenSearch Dashboards after Elastic’s licence change. The UI kept Discover, visualisations, and dashboards so operators who already knew Kibana 7.10 could keep working. Subsequent OpenSearch Dashboards releases added OpenSearch-specific plugins (security, alerting, observability) while staying Apache 2.0.
There is not a 2013-style founder story in the same way as Kibana (Rashid Khan). The product’s origin is the fork, not a separate greenfield UI.
DQL and Lucene
Dashboards Query Language (DQL) is the short filter syntax in OpenSearch Dashboards Discover — the counterpart to Kibana’s KQL. Lucene syntax is still available and is the older form many OpenSearch queries use. Neither is a reporting language for sales funnels. Keep KQL (the syntax still maps) and Lucene next to the query bar. Field names come from your parser. message:error is only useful if the field is message.
Unlock complete visibility with hosted ELK, Grafana, and Prometheus-backed Observability
Start in Discover
Create a Logs stack (Log Management getting started), ship one source, then launch OpenSearch Dashboards. Confirm the index with listing indexes. Linux files: Filebeat from Install Integration — Getting started with Filebeat. Windows Event Log: Winlogbeat.
Search, then export the window with exporting search results. Time picker wrong by an hour is timezone configuration, not a missing document. UI walkthrough: Getting started with OpenSearch Dashboards and the Dashboards overview.
Filter on host.name so you are not looking at another stack’s noise. First logs: First Logs on Logit.io. First Windows: First Windows Event Logs.
Access control and security
OpenSearch Dashboards sits in front of OpenSearch security: roles, tenants (the Spaces equivalent), and authentication against the cluster. On Logit.io that is managed with the stack — you do not stand up a separate security plugin day one. Share a dashboard by tenant and role, not by emailing a screenshot. Export CSV or the saved search when you hand off an incident: exporting search results.
SSO, LDAP, and SAML are OpenSearch security features, not a reason to skip Discover. Prove the pipe first, then tighten who can see which index.
Alerting
OpenSearch alerting watches indexes and fires to email, Slack, or similar when a query matches. That is document-based alerting (a query over logs), not Grafana PromQL. Configure it after Discover shows the events you care about. Metrics SLOs still belong in Grafana. OpenSearch alerting overview on the blog: OpenSearch alerting.
How many versions of OpenSearch Dashboards have there been?
OpenSearch Dashboards is versioned with the OpenSearch cluster, not as a separate 2013-era product line like Kibana 3.0. The fork started from Kibana 7.10.2. OpenSearch 1.x shipped the first Dashboards line that operators could run without an Elastic licence. OpenSearch 2.x is the current major line most hosted platforms, including Logit.io, run in 2026. You do not pick a random Kibana 8 UI and point it at OpenSearch — the Dashboards version has to match the cluster.
On Logit.io you launch the Dashboards build that belongs to your Logs stack. You do not maintain a compatibility matrix yourself. If you still need an older Kibana, that is a different stack path: hosted Kibana, covered in What is Kibana?.
Who uses OpenSearch Dashboards?
Teams that already store logs in OpenSearch use Dashboards to search and dashboard those logs. That is DevOps, SRE, security, and platform engineers who need Discover at 3 a.m., not a named-customer logo wall. If your documents are in Elasticsearch instead, Kibana is the matching UI. If they are in OpenSearch, Dashboards is the matching UI. Do not treat a vendor case-study list as proof that Discover works on your stack.
Interview-style OpenSearch questions (shards, mappings, security) live in OpenSearch interview questions. Security plugin detail: OpenSearch security.
How OpenSearch Dashboards handles search
Search in Dashboards is Discover plus DQL or Lucene, not a customer-facing relevance studio. You pick an index pattern, set a time field, type a filter, and get documents. Saved searches pin that query to a dashboard. When the window is right, export CSV. That is the operator loop.
OpenSearch can power application search, but that is the cluster and query DSL, not a reason to describe Dashboards as “optimising search experiences for customers.” If you are tuning product search, you are in a different job. If you are finding why checkout 500s started at 14:02, you are in Dashboards.
What features does OpenSearch Dashboards offer for managing data?
Index patterns tell Discover which indexes to search. Time fields drive the picker. Tenants (the Spaces equivalent) separate dashboards between teams. Role-based access decides who can see which pattern. On Logit.io the stack already has OpenSearch security; you do not install the plugin from scratch for a first search. List indexes when a pattern looks empty: listing indexes.
Ingest and retention live on the Logs stack (Logstash + OpenSearch), not inside a dashboard panel. Dashboards visualises what already arrived. If the field you charted was never parsed, fix the shipper or pipeline — Filebeat, Winlogbeat, or the integration page — then come back to the visualisation.
What advanced analytical capabilities does OpenSearch Dashboards offer?
OpenSearch ships plugins that Kibana’s Elastic catalogue markets separately: anomaly detection on numeric series, observability for traces, and alerting on query matches. Those are real features. They are not a substitute for a saved search on event.code: 4625. Use anomaly jobs after Discover shows a clean signal. Tracing boards need trace documents, not syslog. Geospatial maps need a geo field; empty maps usually mean the parser never set one.
Time-series charts in Dashboards are still over log or metric documents in OpenSearch. Host and container CPU from Prometheus belong in Grafana. Mixing those in one OpenSearch pie chart is how you get “no results.” Observability write-up: OpenSearch observability.
Core concepts
Five objects cover almost all day-to-day work. An index holds documents. An index pattern selects indexes for Discover. A saved search is a query plus columns you will reopen. A visualisation aggregates a field (histogram, terms, metric). A dashboard lays those out on one time range. Learn those five before tenants, anomaly jobs, or reporting PDFs.
Query syntax sits in the KQL cheat sheet and Lucene cheat sheet. DQL is close enough to KQL that the same patterns transfer. Field names still come from your parser.
Empty Discover
Wrong stack endpoints, wrong index pattern, timezone skew, or the shipper never started. Copy Install Integration again. List indexes. Widen the time picker past 15 minutes. Security 4624 needs audit policy; Application and System still prove Winlogbeat. Do not add dashboard panels until Discover shows the host.
Can I keep using Kibana instead?
Yes, if your data is still in Elasticsearch. OpenSearch Dashboards talks to OpenSearch. Kibana talks to Elasticsearch. Logit.io can run both UIs on one account so a migration is not “throw away Discover.” Move the log source to a Logs stack, prove documents in OpenSearch Dashboards, then retire the Elastic stack when you are ready. Comparison: OpenSearch Dashboards vs Kibana.
Do not paste a Kibana 8 NDJSON dashboard into OpenSearch Dashboards and expect every Lens panel to import. Recreate the saved searches you actually page on, the same way you would rebuild a Splunk XML board. Visualisation how-to: creating visualisations.
What OpenSearch Dashboards is not
It is not a customer-facing search box for your product catalogue. It is not Google Analytics. It is not Grafana. Those jobs have other tools. OpenSearch Dashboards answers: which host, which error, which window — then export the lines. Named-customer roundups are not a substitute for proving Discover on your own stack.
Advanced anomaly plugins exist in OpenSearch. They do not replace listing indexes and fixing a shipper. Learn Discover first.
OpenSearch Dashboards on Logit.io
You do not assemble OpenSearch, Dashboards, and Logstash yourself for the first search. Create a Logs stack, launch Dashboards, ship one source. Compare OpenSearch pricing when you are choosing stack size — not while Discover is empty. Hosted path: hosted OpenSearch.
If you enjoyed this article, read What is Kibana? or OpenSearch dashboard examples next.