Configure OpenSearch notifications for high CPU (logs)
Alerting and notifications for log management
Managing critical events in your OpenSearch environment is easier when Alerting is set up for your metrics. This guide focuses on a high CPU warning delivered through Notifications (for example Slack). It assumes you are already shipping Metricbeat data (or similar host metrics) into the index you query.
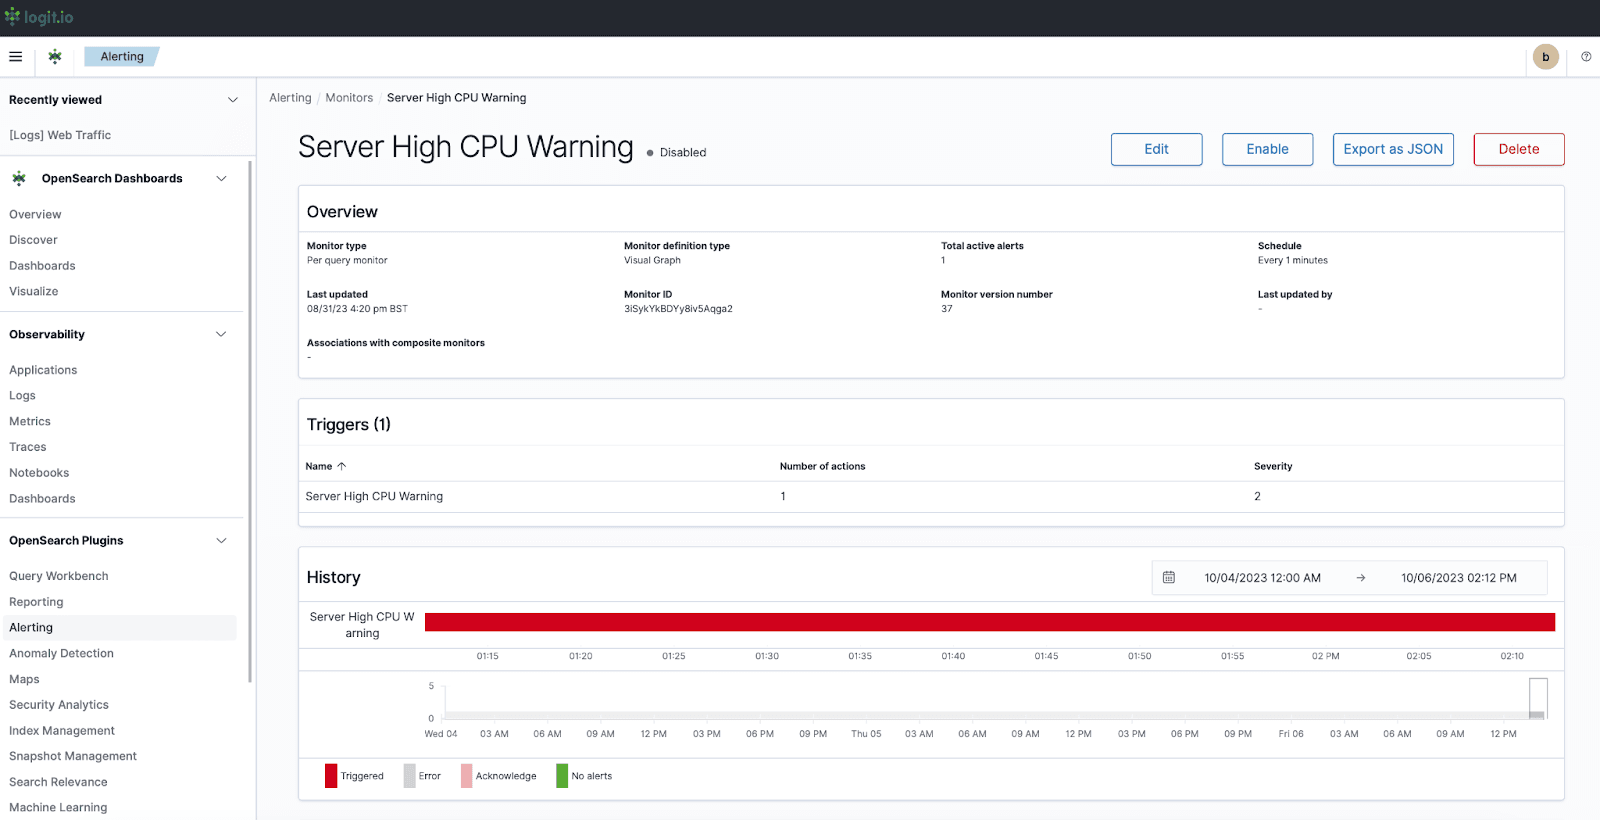
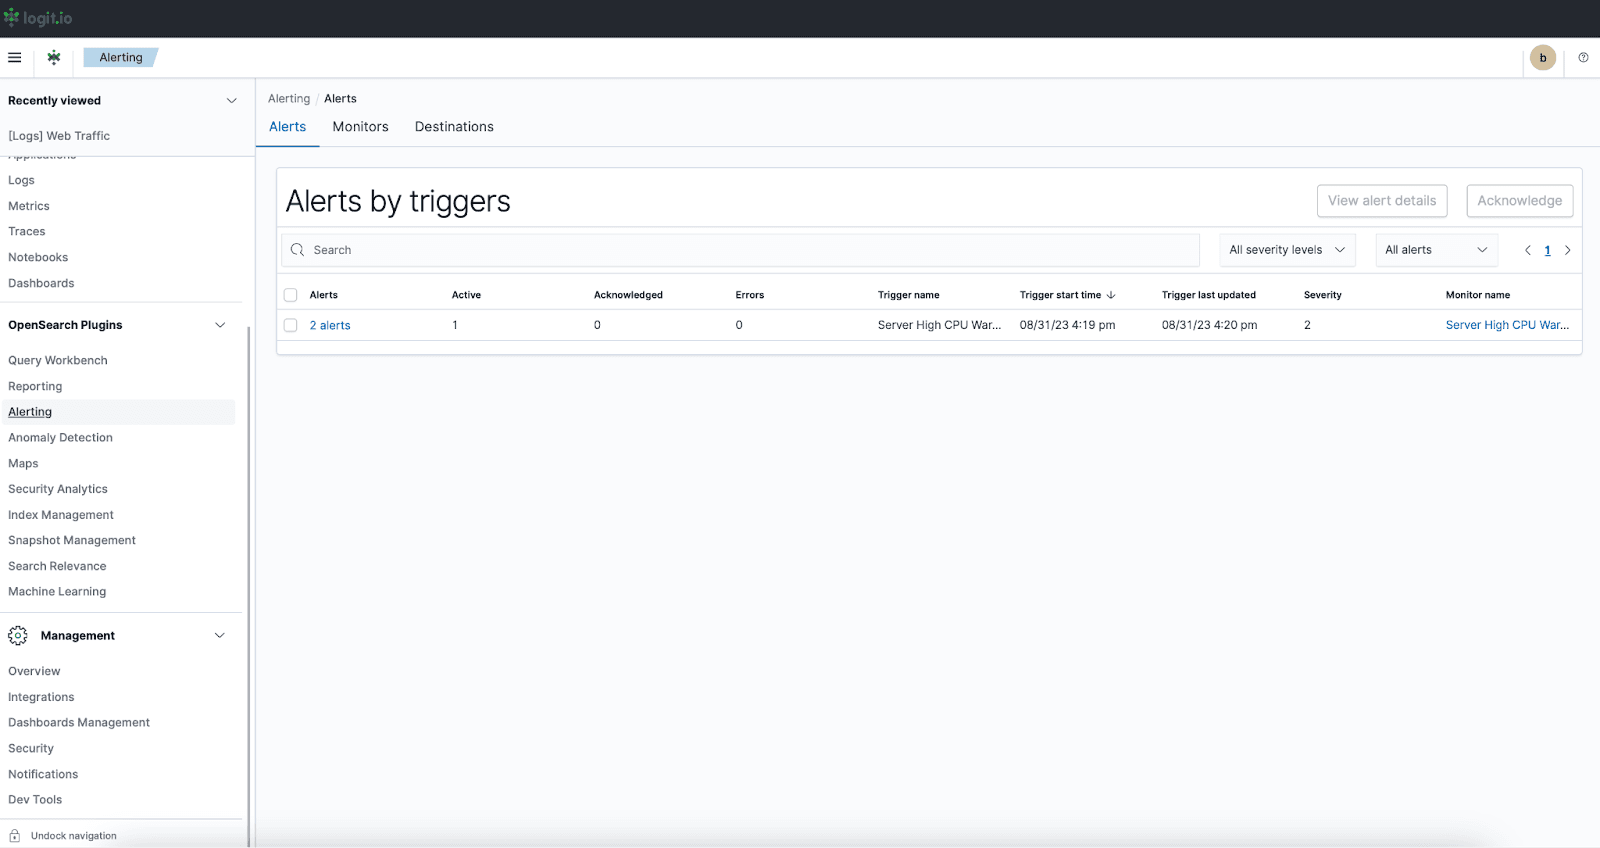
Example: a server high CPU alert in triggered state.
OpenSearch Alerting is organised into three areas—Alerts, Monitors, and Notifications—that work together: monitors evaluate data, alerts represent fired conditions, and notifications carry messages to channels you configure.
Alerts, monitors, and notifications
Alerts tab
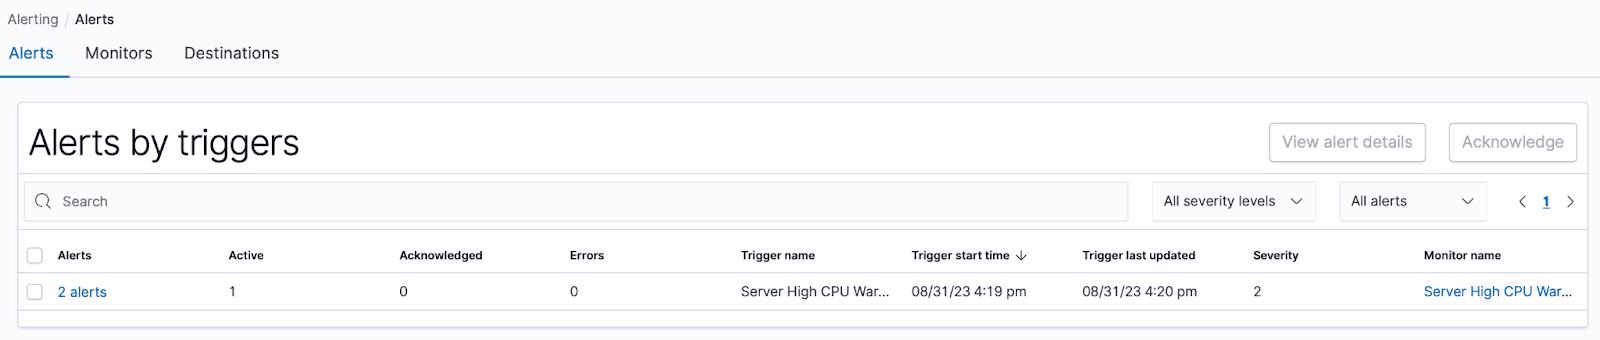
- Overview — Lists configured alerts, status, and last triggered time.
- Managing alerts — Alerts fire from monitors; under Monitor name, open an alert for details.
- Alert status — See which alerts are active, acknowledged, or resolved.
Monitors tab
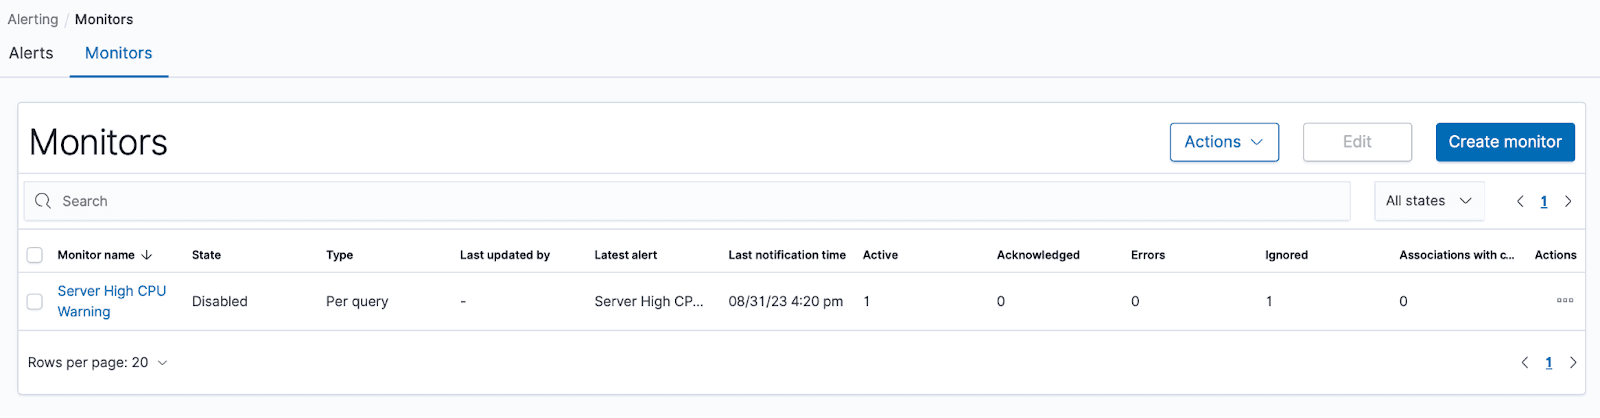
- Overview — Create and edit monitors that run on a schedule.
- Creating monitors — Track conditions in your data; monitors can run without sending notifications until you attach triggers and actions.
- Monitoring metrics — Execution frequency and performance of each monitor.
- Integration with alerts — Triggers turn monitor results into alerts and drive notifications.
Notifications tab
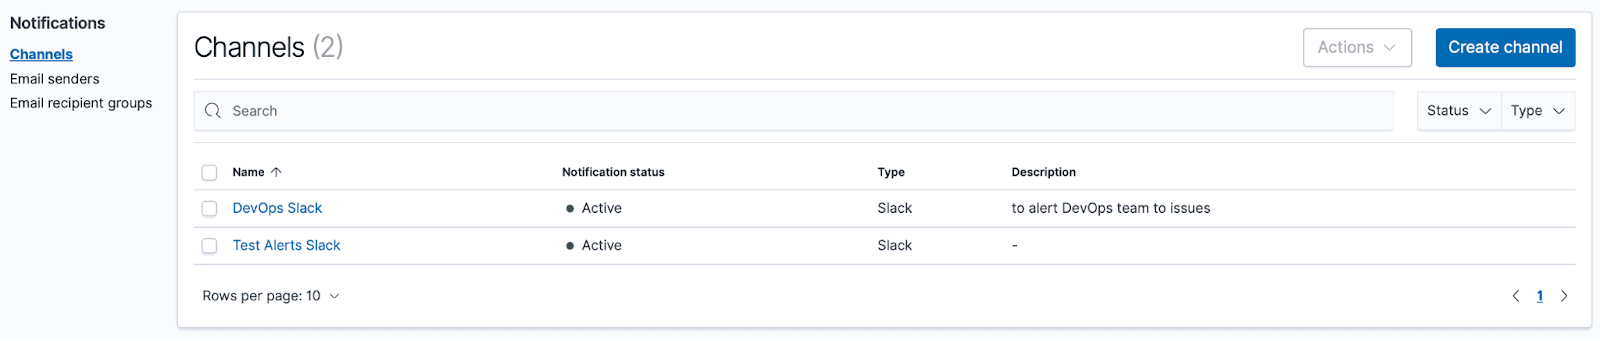
- Overview — Configure channels (email, Slack, webhooks) and message defaults.
- Creating notification channels — Add the destinations alerts will use.
- Recipient settings — Control who receives each channel’s messages.
Examples
High CPU warning (per-query monitor, visual editor)
From the Logit.io dashboard, open Launch logs, then Alerting in the left menu and go to the Monitors tab. This example uses a per-query monitor with the visual editor and a 5 minute run interval.
Choose Create monitor.
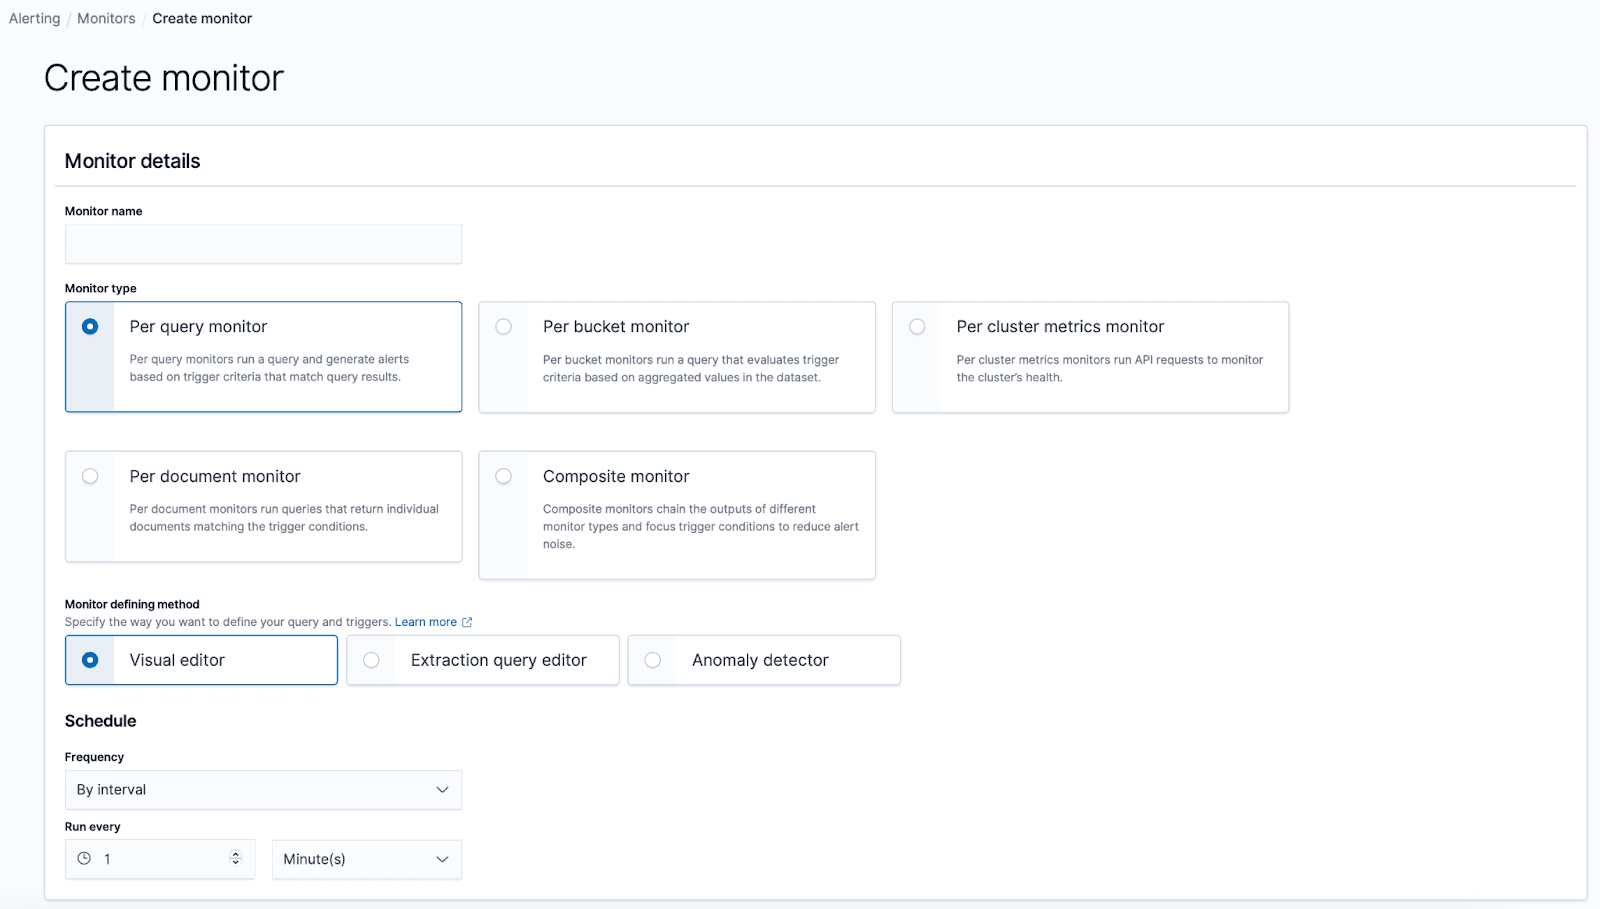
- Monitor name — A clear name for the monitor’s purpose.
- Monitor type — Per query monitor (tracks a single query).
- Monitor defining method — Visual editor.
- Schedule — Run every — for example 5 minutes.
Define the query
- In the visual editor, pick the index, time field (usually
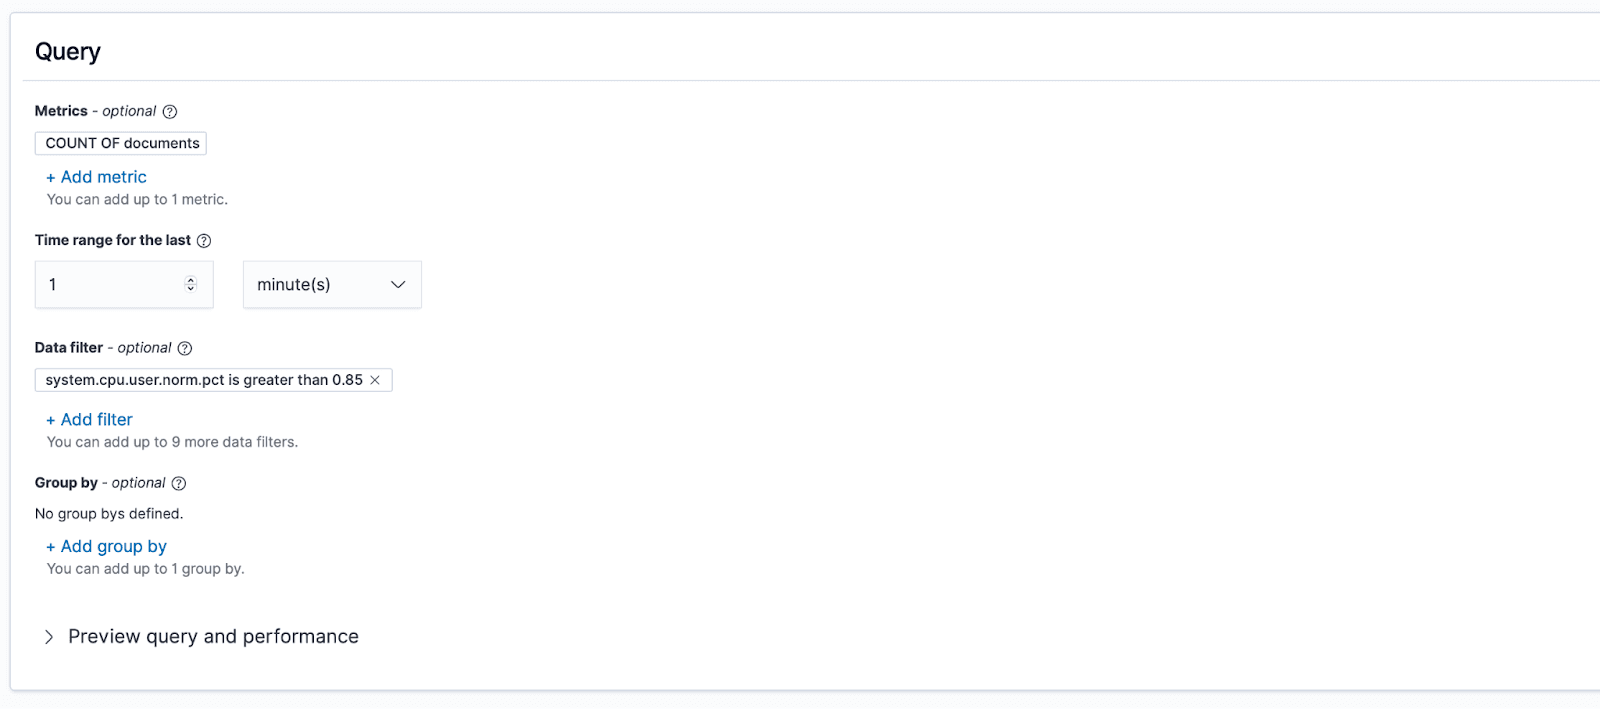
@timestamp), and conditions. - Set Time range for the last to 1 minute and add a data filter:
system.cpu.user.norm.pctgreater than0.85(adjust for your metric naming). - Use Preview query and performance to confirm hit counts.
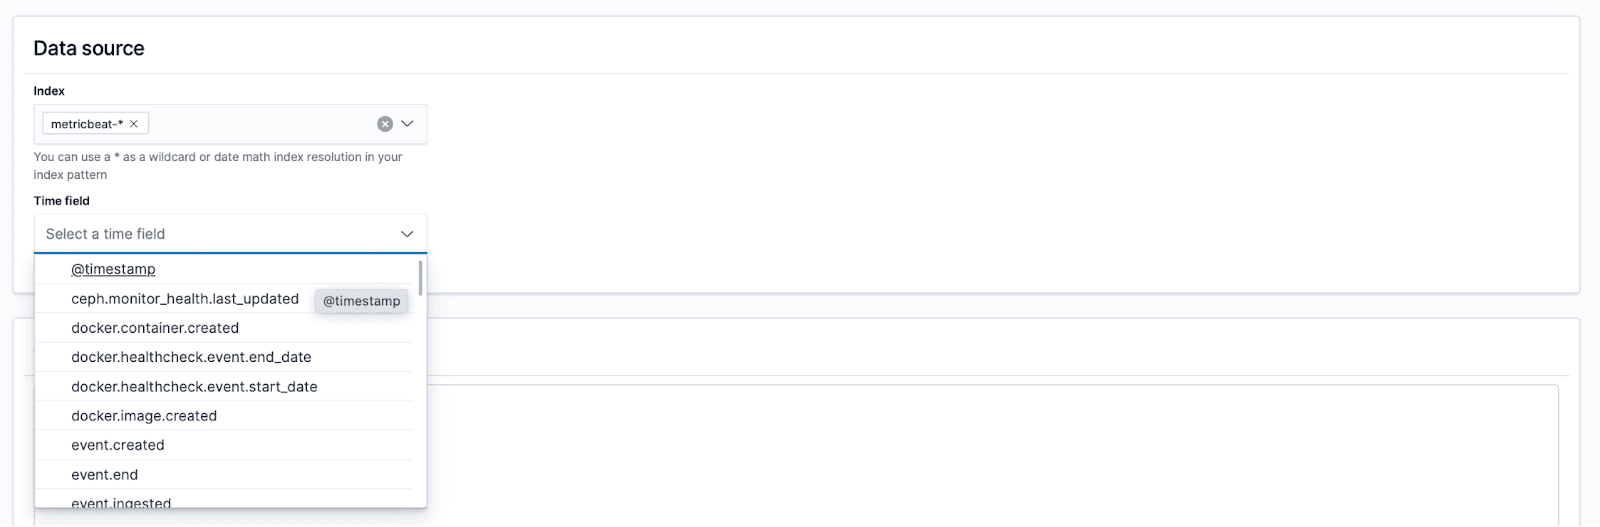
Selecting the data source and time field.
Set trigger conditions
- Choose Add trigger and set a severity (for example High).
- Set the trigger so an alert fires when the query matches; for a first test you can use a trigger condition of 0 hits as described in the UI, then tighten it for production.
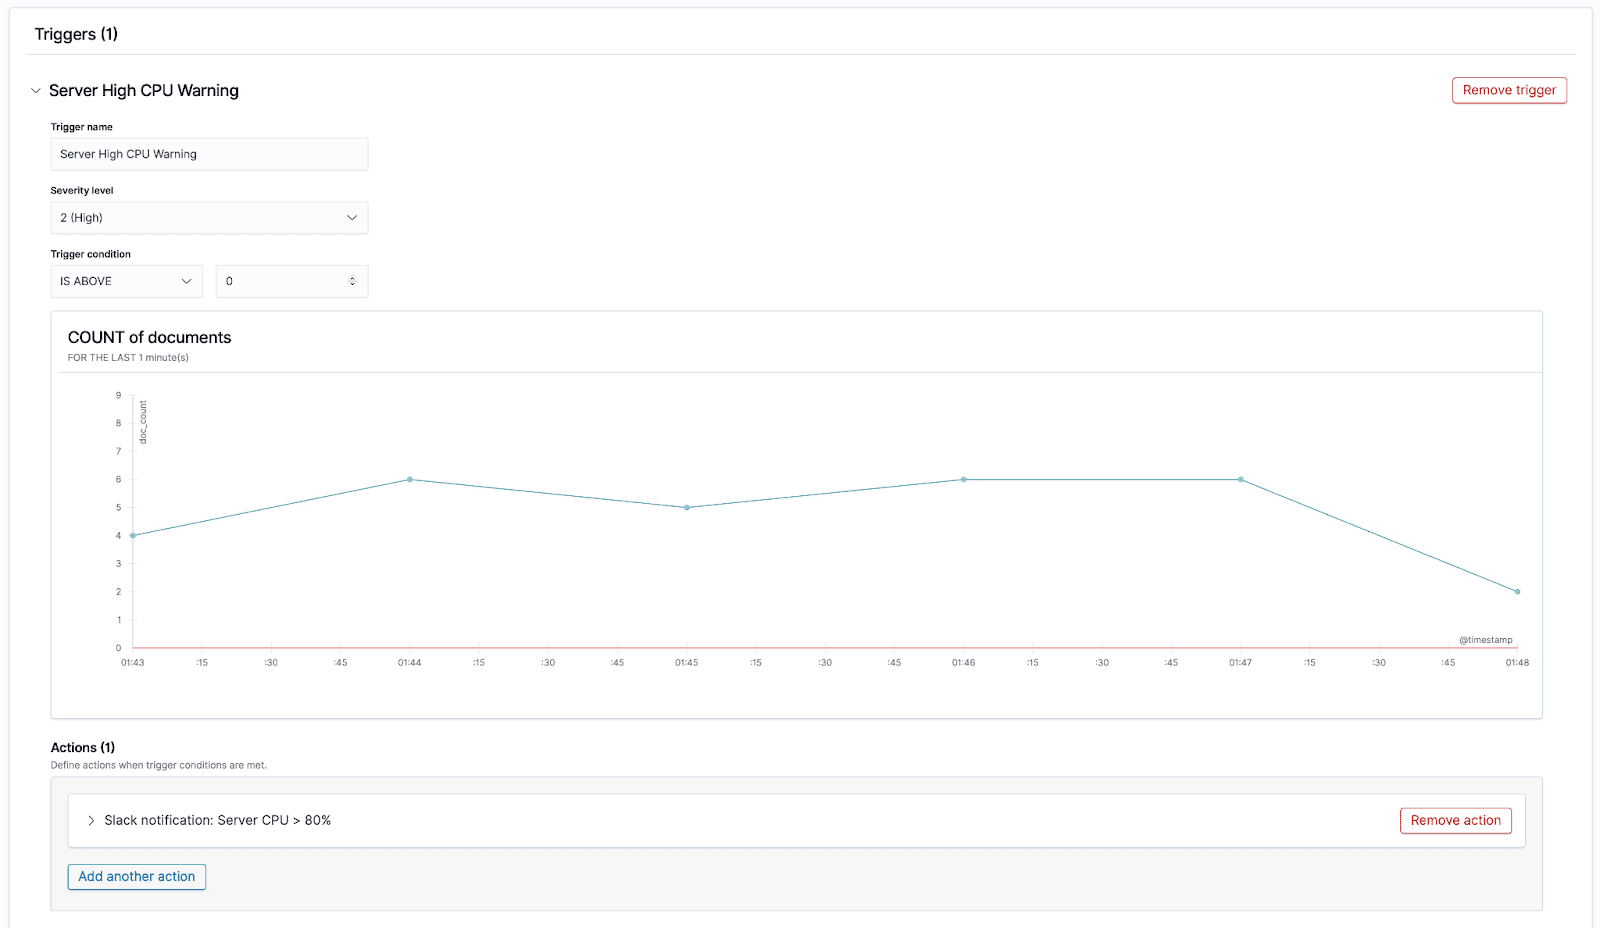
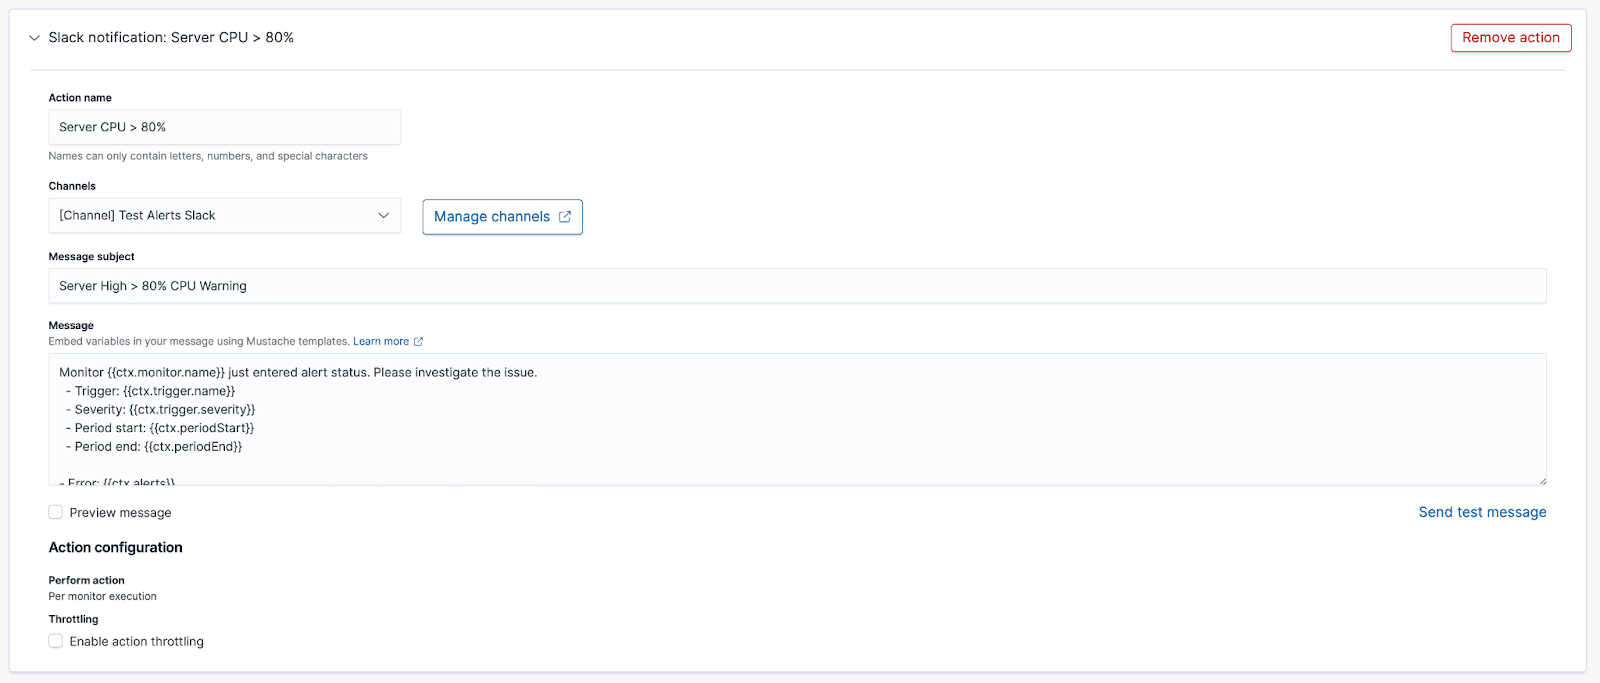
Define actions
- Under actions, open Manage channels to add Slack (or another channel), then select that channel for this monitor.
- Optionally send a test message to verify delivery.
Save and activate
- Click Create to save the monitor.
- Activate it so scheduled runs begin against your query and triggers.