OpenSearch Alerting monitors
Log Management stacks can use two alerting paths:
- ElastAlert 2 rules (YAML) — configured under Alerting & Notifications in the Logit.io dashboard. This is the primary, YAML-based workflow described in Create a rule and Rule types.
- OpenSearch Alerting — monitors created inside Launch Logs (OpenSearch Dashboards). This guide covers that UI workflow.
For YAML rules, OpenSearch Dashboards links, aggregation, and ElastAlert-specific behaviour, start with the Alerting overview.
Prerequisites
You need a Logit.io account. You can sign up for a free trial. If your Logs stack is not yet receiving data, complete your ingestion setup first.
Step 1 — Create a monitor
- Sign in to Logit.io.
- From your dashboard choose Launch Logs to open OpenSearch Dashboards.
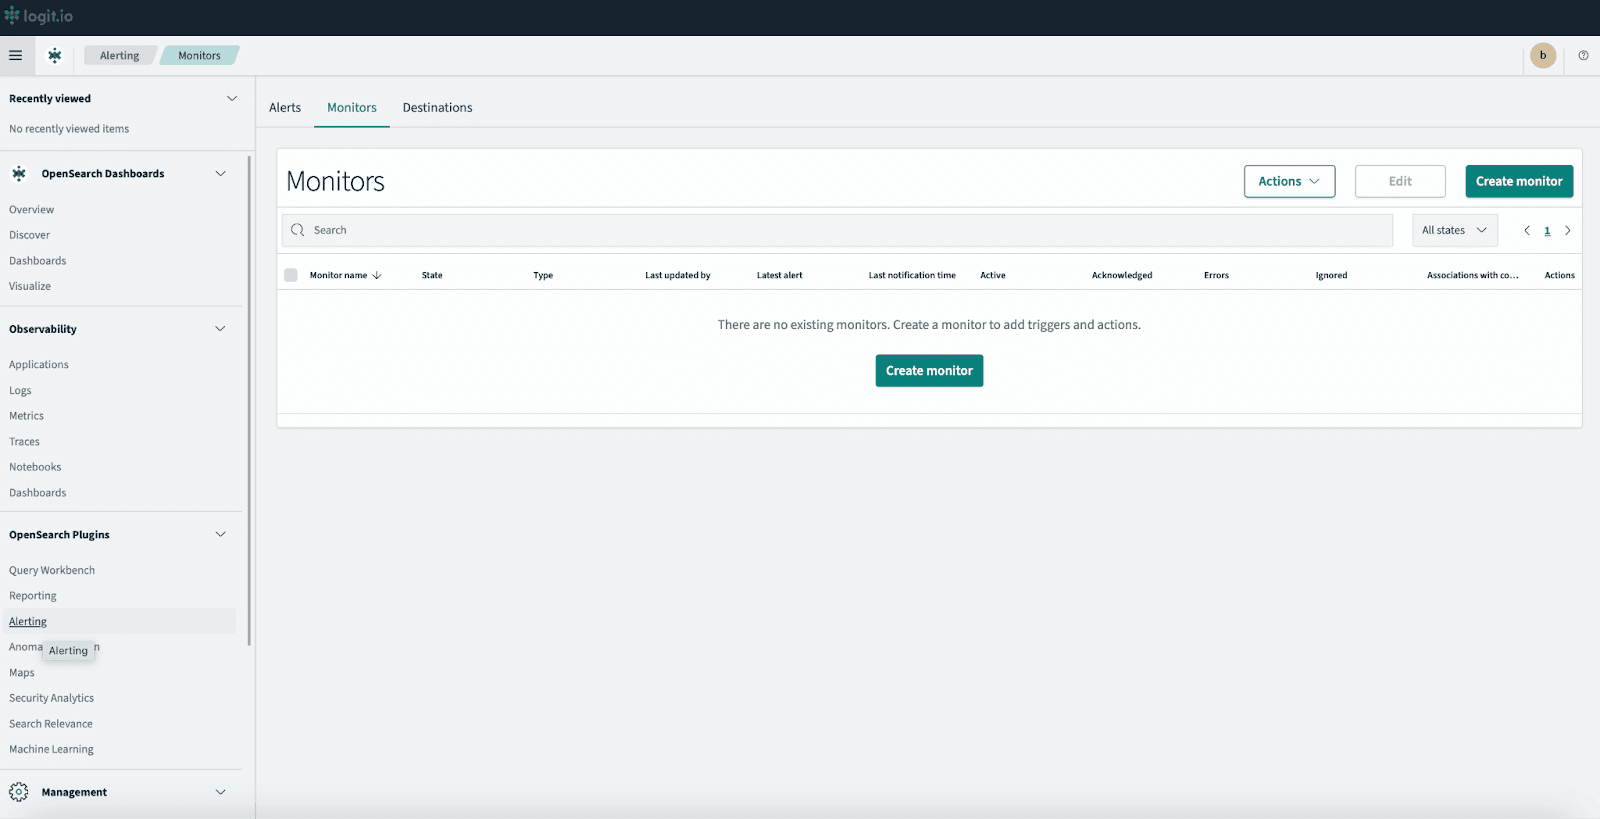
- In the left menu, open Alerting under OpenSearch Plugins.
- Choose Create monitor.
Monitor details
- Monitor name — use a clear name.
- Monitor type — choose Per query monitor to track a search query.
- Defining method — Visual editor is the simplest starting point.
- Schedule — set Run every (for example, every 5 minutes).
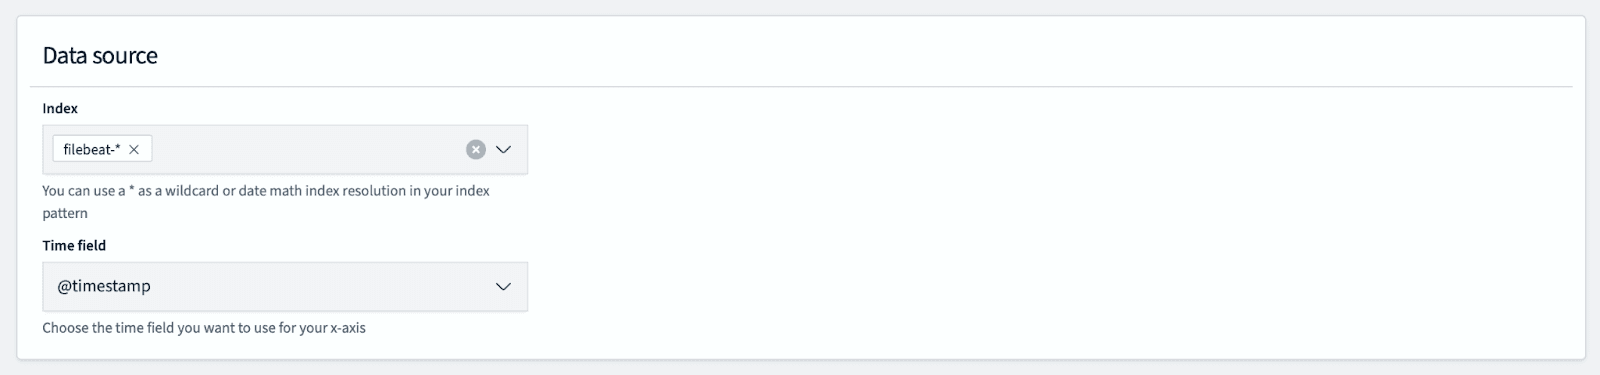
Step 2 — Data source
- Index — enter the index or pattern that holds your data (for example
filebeat-*). - Time field — usually
@timestamp.
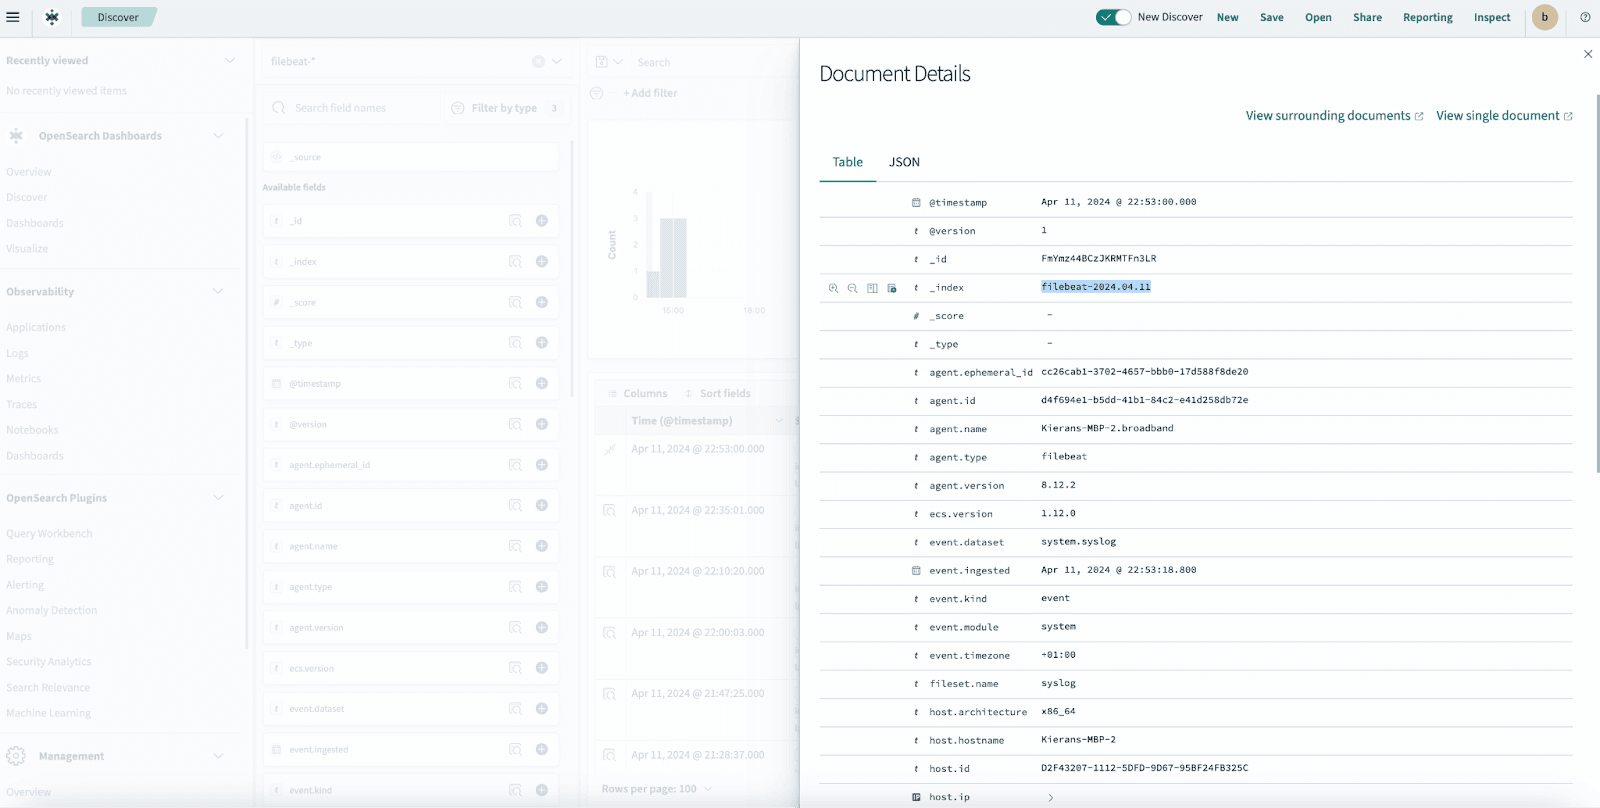
To confirm which index pattern to use, open a document in Discover and check the _index field.
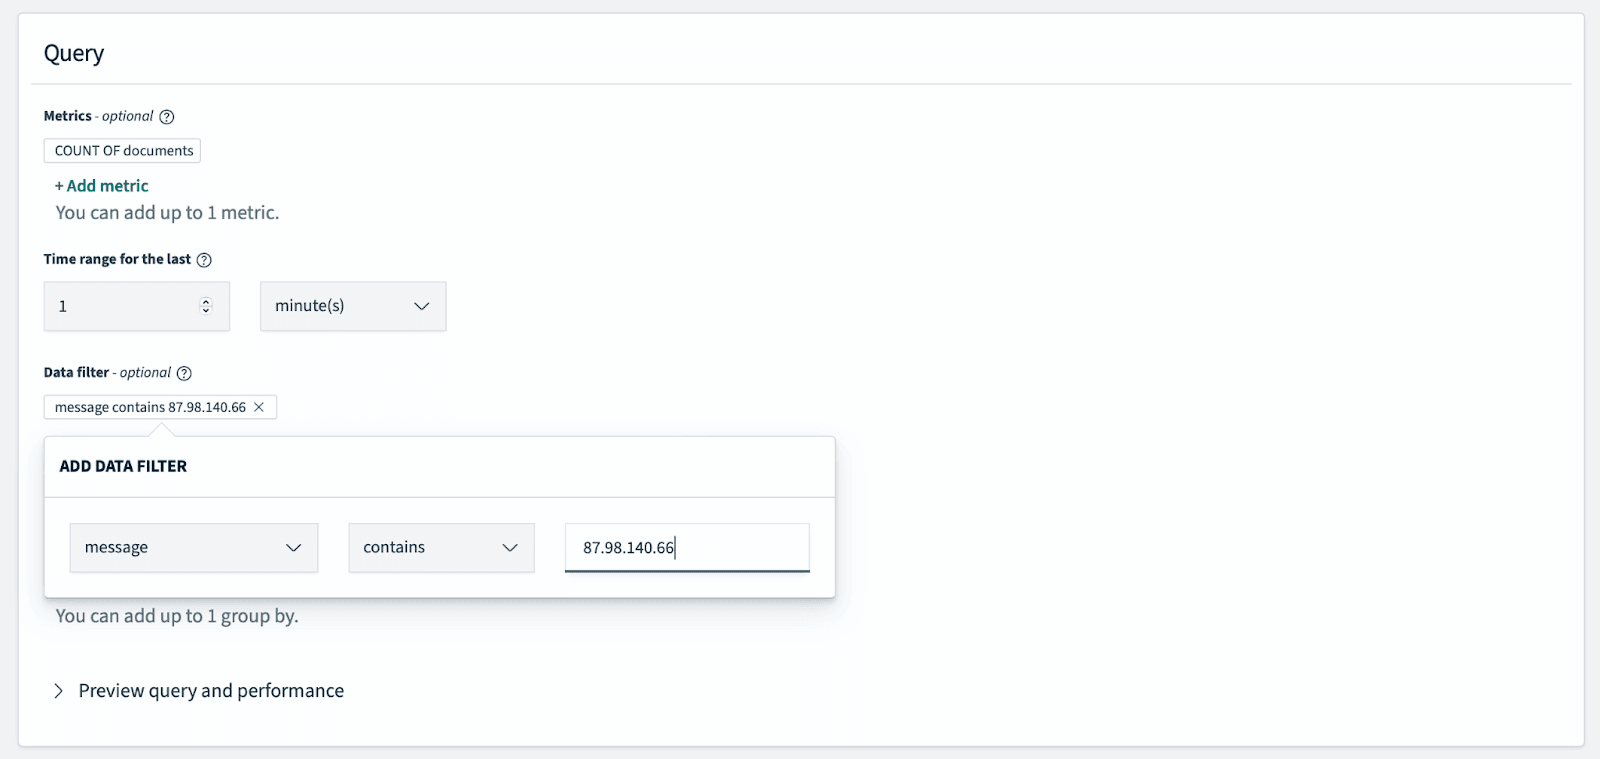
Step 3 — Query / filter
- In the Query section, add filters that define which documents should be evaluated (for example, a value in the
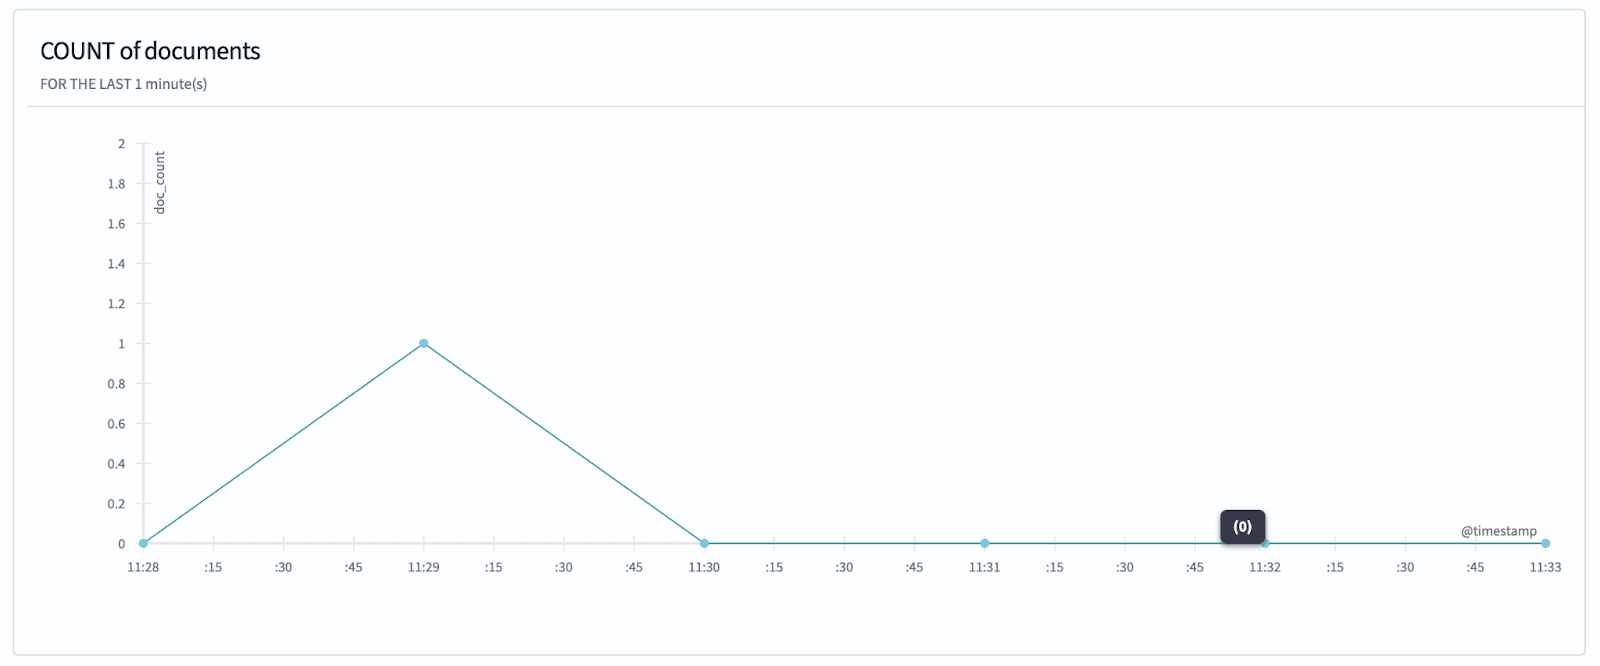
messagefield). - Expand the preview to confirm matches look correct.
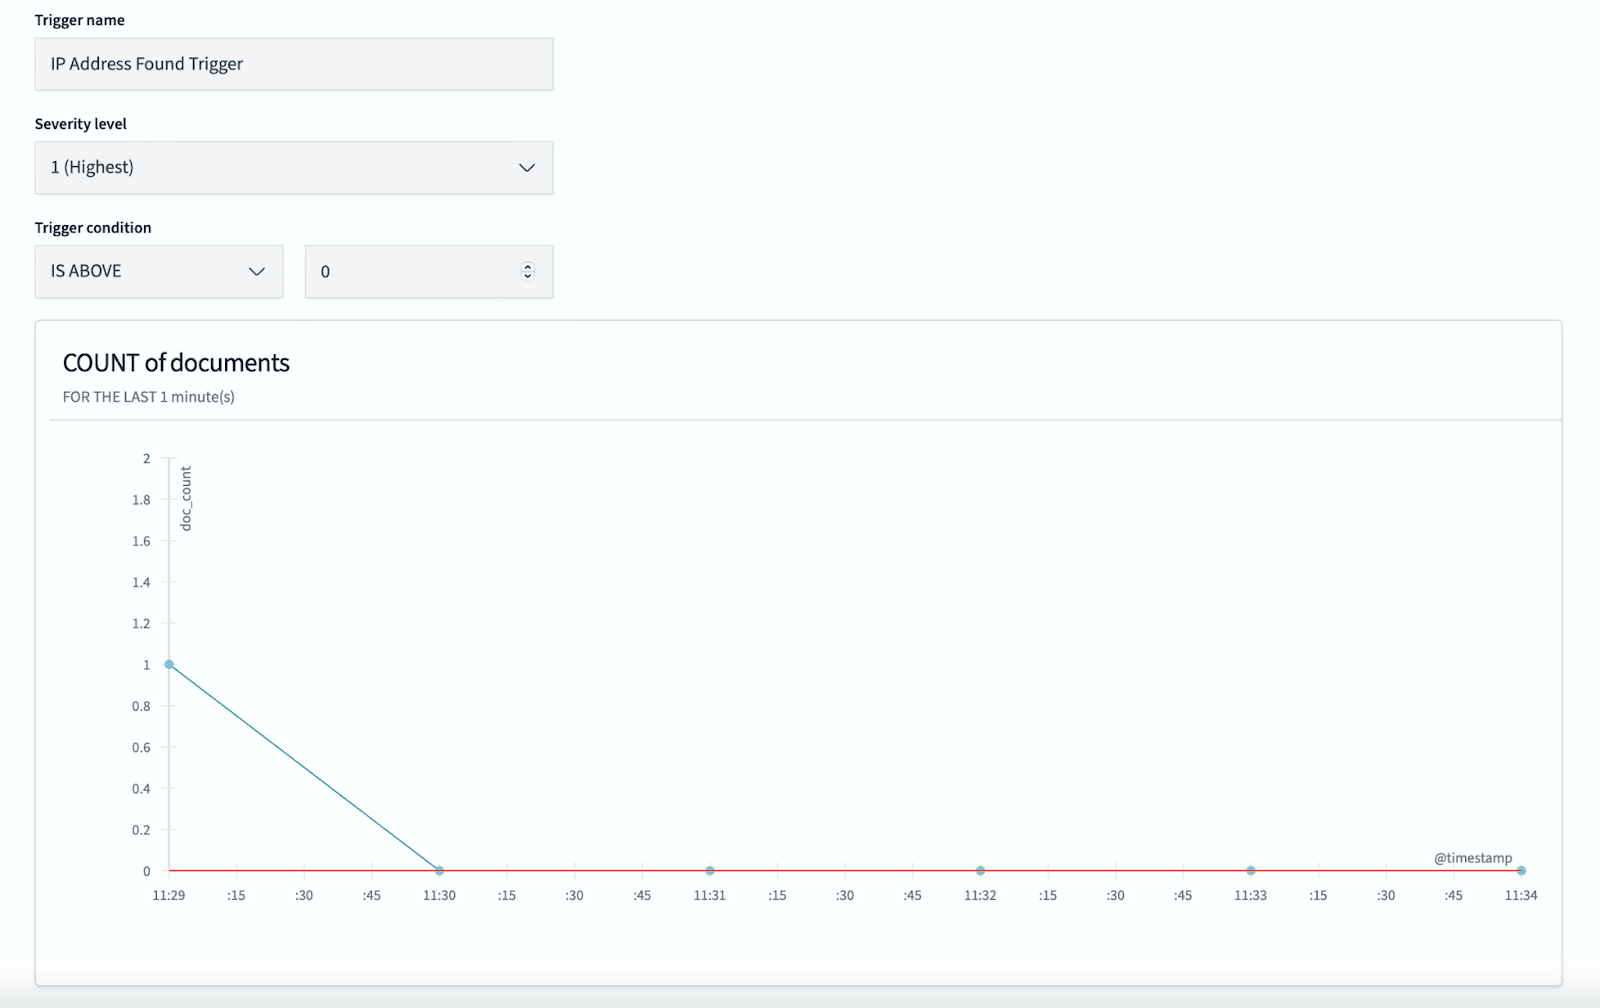
Step 4 — Trigger
- Add a trigger with a name and condition (for example, count IS ABOVE 0 for a simple “any match” test).
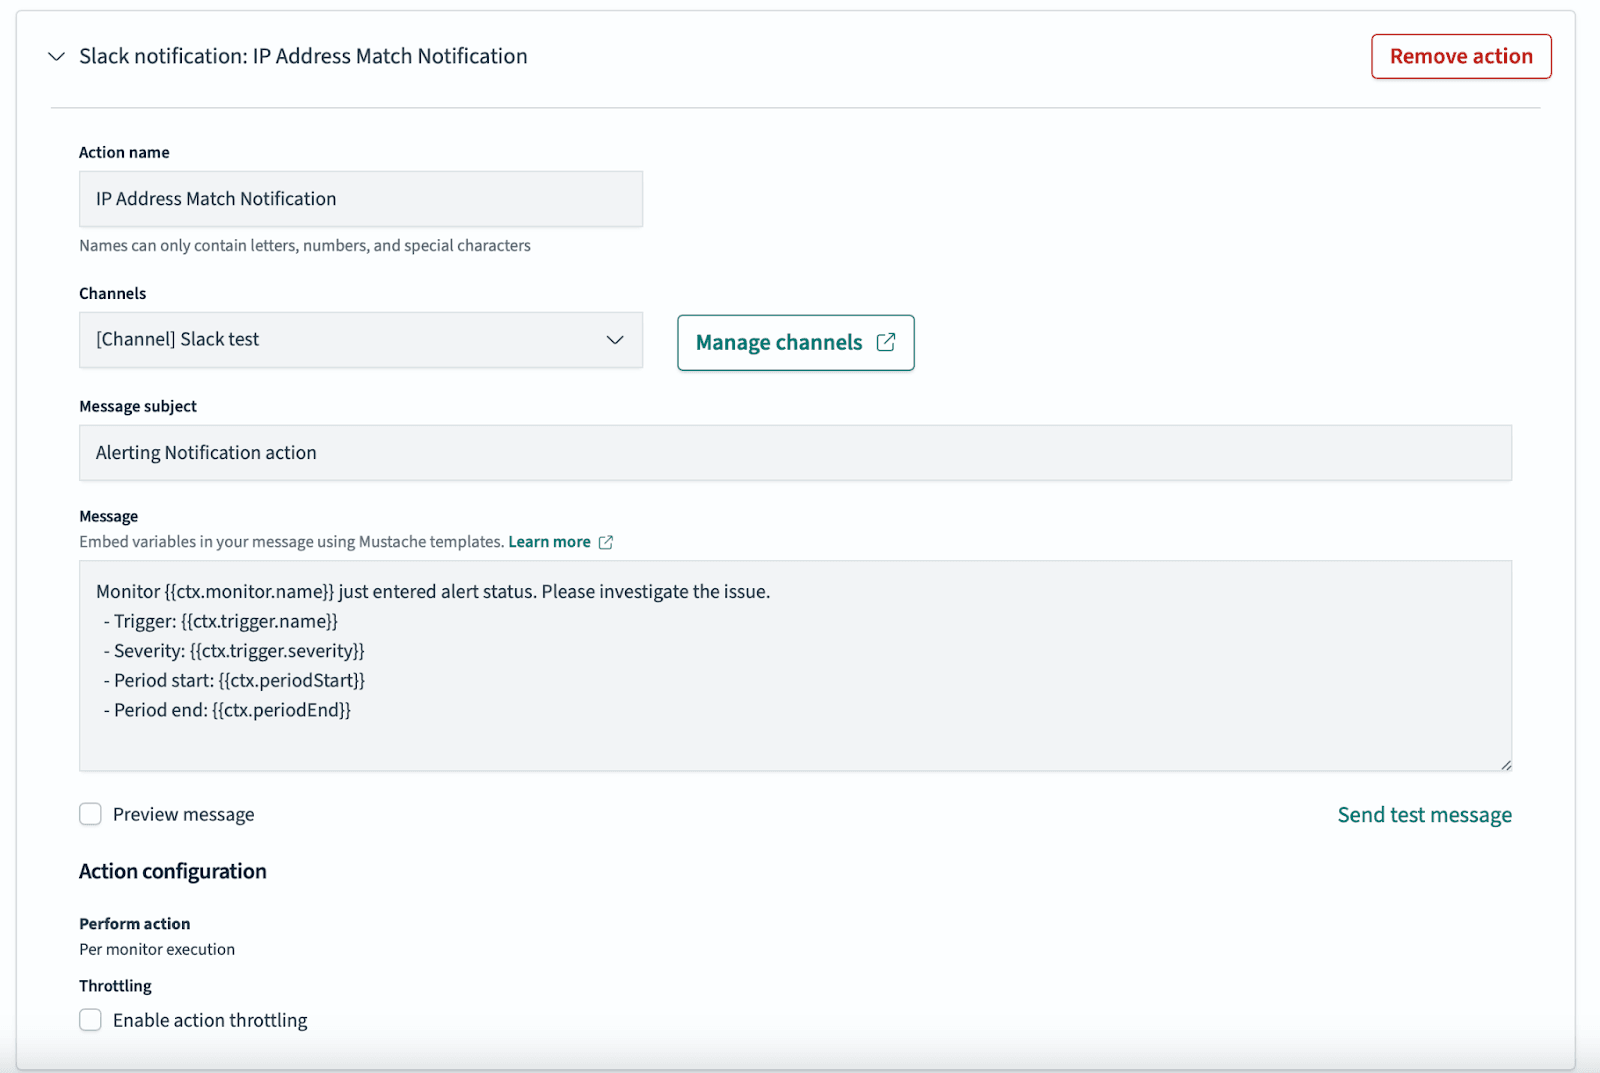
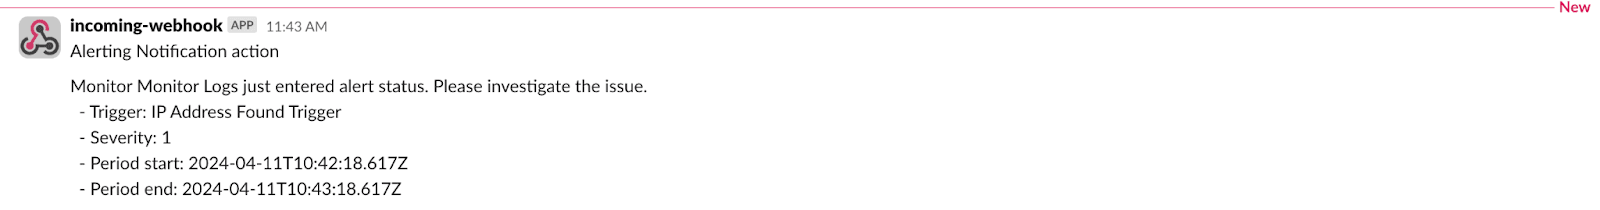
Step 5 — Notification action
- Choose Add action.
- Open Manage Channels to configure Slack, email, custom webhooks, or other channel types, then select the channel for this action.
- Use Send test message to verify delivery.
Choose Create to save the monitor, trigger, and actions.
Monitor and troubleshoot
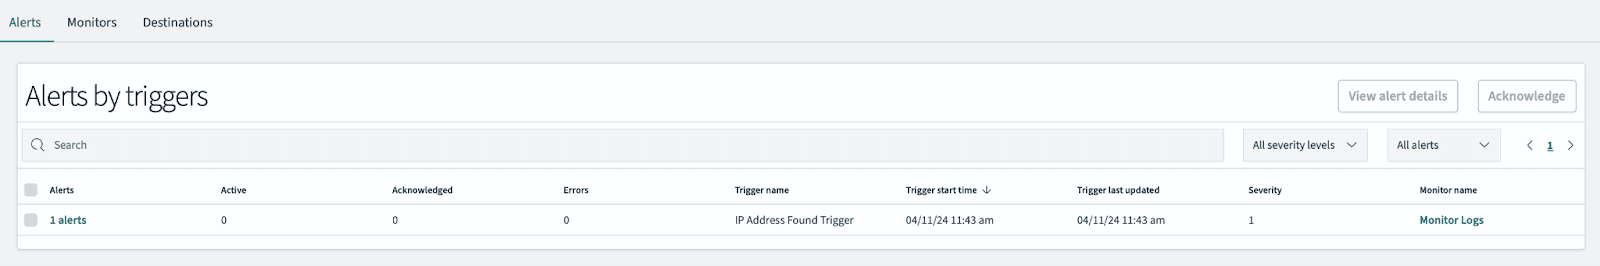
Use the monitor dashboard to review execution history and open alerts.
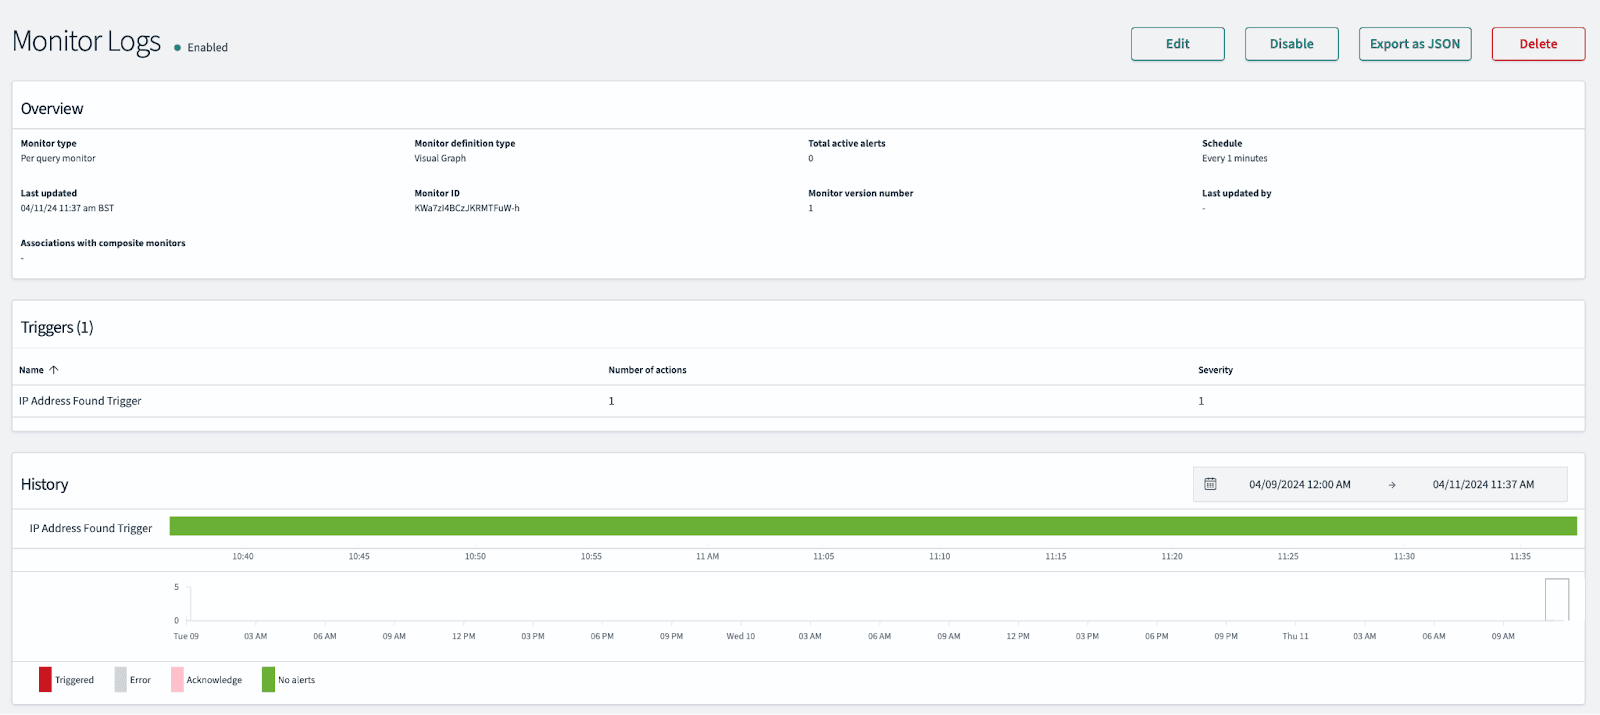
Alerts appear on the timeline when they fire.
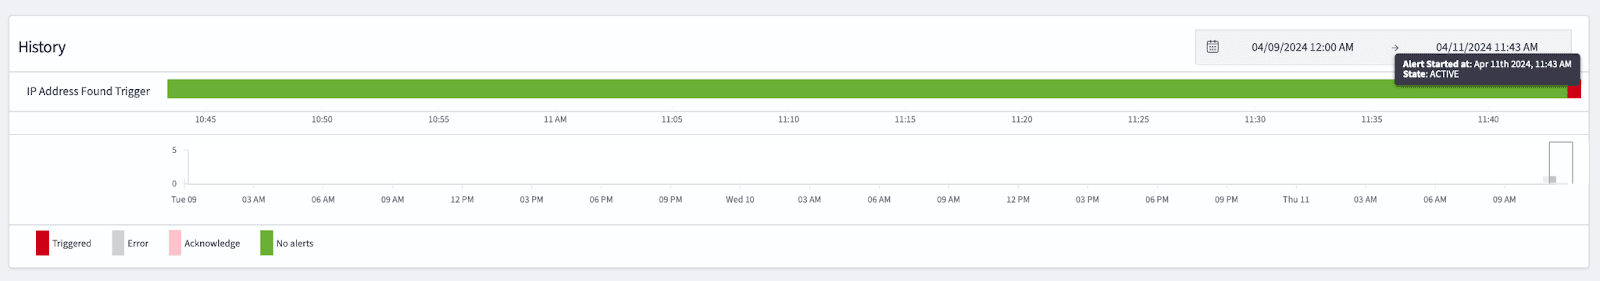
The Alerts tab lists active alerts.